Taking Geocoder to Work - Caris
Taking Geocoder to Work - Caris
Taking Geocoder to Work - Caris

You also want an ePaper? Increase the reach of your titles
YUMPU automatically turns print PDFs into web optimized ePapers that Google loves.
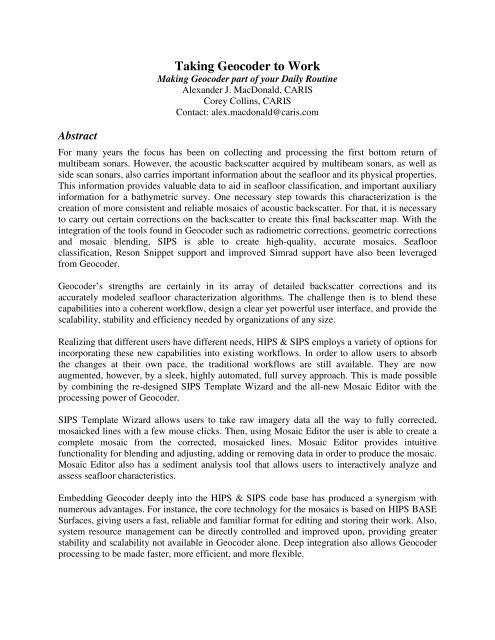
Abstract<br />
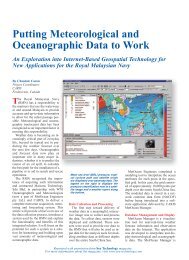
<strong>Taking</strong> <strong>Geocoder</strong> <strong>to</strong> <strong>Work</strong><br />
Making <strong>Geocoder</strong> part of your Daily Routine<br />
Alexander J. MacDonald, CARIS<br />
Corey Collins, CARIS<br />
Contact: alex.macdonald@caris.com<br />
For many years the focus has been on collecting and processing the first bot<strong>to</strong>m return of<br />
multibeam sonars. However, the acoustic backscatter acquired by multibeam sonars, as well as<br />
side scan sonars, also carries important information about the seafloor and its physical properties.<br />
This information provides valuable data <strong>to</strong> aid in seafloor classification, and important auxiliary<br />
information for a bathymetric survey. One necessary step <strong>to</strong>wards this characterization is the<br />
creation of more consistent and reliable mosaics of acoustic backscatter. For that, it is necessary<br />
<strong>to</strong> carry out certain corrections on the backscatter <strong>to</strong> create this final backscatter map. With the<br />
integration of the <strong>to</strong>ols found in <strong>Geocoder</strong> such as radiometric corrections, geometric corrections<br />
and mosaic blending, SIPS is able <strong>to</strong> create high-quality, accurate mosaics. Seafloor<br />
classification, Reson Snippet support and improved Simrad support have also been leveraged<br />
from <strong>Geocoder</strong>.<br />
<strong>Geocoder</strong>’s strengths are certainly in its array of detailed backscatter corrections and its<br />
accurately modeled seafloor characterization algorithms. The challenge then is <strong>to</strong> blend these<br />
capabilities in<strong>to</strong> a coherent workflow, design a clear yet powerful user interface, and provide the<br />
scalability, stability and efficiency needed by organizations of any size.<br />
Realizing that different users have different needs, HIPS & SIPS employs a variety of options for<br />
incorporating these new capabilities in<strong>to</strong> existing workflows. In order <strong>to</strong> allow users <strong>to</strong> absorb<br />
the changes at their own pace, the traditional workflows are still available. They are now<br />
augmented, however, by a sleek, highly au<strong>to</strong>mated, full survey approach. This is made possible<br />
by combining the re-designed SIPS Template Wizard and the all-new Mosaic Edi<strong>to</strong>r with the<br />
processing power of <strong>Geocoder</strong>.<br />
SIPS Template Wizard allows users <strong>to</strong> take raw imagery data all the way <strong>to</strong> fully corrected,<br />
mosaicked lines with a few mouse clicks. Then, using Mosaic Edi<strong>to</strong>r the user is able <strong>to</strong> create a<br />
complete mosaic from the corrected, mosaicked lines. Mosaic Edi<strong>to</strong>r provides intuitive<br />
functionality for blending and adjusting, adding or removing data in order <strong>to</strong> produce the mosaic.<br />
Mosaic Edi<strong>to</strong>r also has a sediment analysis <strong>to</strong>ol that allows users <strong>to</strong> interactively analyze and<br />
assess seafloor characteristics.<br />
Embedding <strong>Geocoder</strong> deeply in<strong>to</strong> the HIPS & SIPS code base has produced a synergism with<br />
numerous advantages. For instance, the core technology for the mosaics is based on HIPS BASE<br />
Surfaces, giving users a fast, reliable and familiar format for editing and s<strong>to</strong>ring their work. Also,<br />
system resource management can be directly controlled and improved upon, providing greater<br />
stability and scalability not available in <strong>Geocoder</strong> alone. Deep integration also allows <strong>Geocoder</strong><br />
processing <strong>to</strong> be made faster, more efficient, and more flexible.
<strong>Taking</strong> <strong>Geocoder</strong> <strong>to</strong> <strong>Work</strong><br />
I. Overview<br />
The embedding of <strong>Geocoder</strong> in<strong>to</strong> CARIS HIPS and SIPS is nothing short of a new benchmark in<br />
backscatter processing. <strong>Geocoder</strong> contains advanced algorithms for radiometric and geometric<br />
backscatter corrections as well as sophisticated sediment angular response analysis capabilities.<br />
<strong>Geocoder</strong> was developed by Dr. Luciano Fonseca and is licensed by the University of New<br />
Hampshire.<br />
<strong>Geocoder</strong> brings great benefits <strong>to</strong> SIPS on its own merits, but this union has in fact produced<br />
unique strengths that neither <strong>Geocoder</strong> nor SIPS can claim on their own. This result is by design<br />
and is the main purpose behind incorporating <strong>Geocoder</strong> in a commercial application. This section<br />
will provide an overview of the reciprocity between <strong>Geocoder</strong> and CARIS HIPS and SIPS before<br />
exploring the <strong>to</strong>pics in more detail in the sections that follow.<br />
Multibeam Backscatter Processing<br />
<strong>Geocoder</strong> was purpose-built <strong>to</strong> process multibeam backscatter, both beam averaged intensity data<br />
and the higher resolution time series returns. As a result, HIPS and SIPS now supports Reson<br />
“snippet” data and has greatly improved support for Reson beam averaged data, Simrad beam<br />
averaged data, and Simrad time series data, all thanks <strong>to</strong> the inclusion of <strong>Geocoder</strong> as a<br />
processing engine.<br />
Survey Approach<br />
The traditional mode of processing imagery in a waterfall display, one line at a time, has its<br />
merits, but SIPS aims <strong>to</strong> promote greater efficiency by advocating a “whole survey approach”.<br />
Using SIPS’ new Mosaic Edi<strong>to</strong>r, users are encouraged <strong>to</strong> correct and geo-reference their survey<br />
data en masse, create a mosaic, then examine the data for anomalies requiring closer attention.<br />
SIPS Template Wizard may also be used in this way <strong>to</strong> help standardize operations through the<br />
use of process templates.<br />
Sediment Analysis Tool<br />
For some users of HIPS and SIPS, it is the inclusion of <strong>Geocoder</strong>’s sediment analysis engine that<br />
will be of key interest. The sediment analysis <strong>to</strong>ol in Mosaic Edi<strong>to</strong>r allows users <strong>to</strong> analyze the<br />
angular responses of corrected data <strong>to</strong> determine the sediment type in that location. Perhaps less<br />
apparent is that this functionality also allows the sediment angular artifacts <strong>to</strong> be removed from<br />
empirically generated beam patterns – providing improved accuracy when correcting data for<br />
this effect.<br />
With all that <strong>Geocoder</strong> has <strong>to</strong> offer, it may be difficult for some <strong>to</strong> imagine how integrating it<br />
with a commercial application such as HIPS and SIPS could create additional noteworthy<br />
advantages. The aim of this paper is <strong>to</strong> provide a detailed look at exactly how joining the two<br />
produces crucial new strengths that neither could claim otherwise.<br />
Shallow Survey 2008 A.J. MacDonald / C. Collins 2 / 9
<strong>Taking</strong> <strong>Geocoder</strong> <strong>to</strong> <strong>Work</strong><br />
II. <strong>Work</strong>flow Overview<br />
It is important <strong>to</strong> give an overview of the new SIPS workflow (see Figure 1) and how it relates <strong>to</strong><br />
the previous workflow, before going any further. The initial steps of conversion, bathymetric<br />
processing, and merging in HIPS are required before processing multibeam backscatter. This is<br />
essential for producing the geo-referenced data required <strong>to</strong> process certain types of data using<br />
<strong>Geocoder</strong>. On its own, <strong>Geocoder</strong> requires a separate GSF file <strong>to</strong> process such data, but the<br />
integration in<strong>to</strong> HIPS and SIPS makes this unnecessary.<br />
Figure 1: HIPS and SIPS Multibeam Imagery <strong>Work</strong>flow<br />
Now that the data is prepared for backscatter processing, the user can choose <strong>to</strong> use the SIPS<br />
Template Wizard <strong>to</strong> process the survey data with a new or existing template; or they may decide<br />
<strong>to</strong> interact with the data more closely by using Mosaic Edi<strong>to</strong>r. In either case, the user corrects<br />
and geo-references their data. From here, the user may create a mosaic from some or all of the<br />
processed data, or they may choose <strong>to</strong> investigate the sediment properties of the lines using the<br />
Sediment Analysis Tool in Mosaic Edi<strong>to</strong>r.<br />
To allow users time <strong>to</strong> adjust <strong>to</strong> the workflow and <strong>to</strong>ol changes, the traditional workflow is still<br />
available but has a crossover point <strong>to</strong> the new workflow. Users may still process Side Scan data<br />
using Side Scan Edi<strong>to</strong>r. Following this, they enter Mosaic Edi<strong>to</strong>r <strong>to</strong> create their mosaics.<br />
Shallow Survey 2008 A.J. MacDonald / C. Collins 3 / 9
<strong>Taking</strong> <strong>Geocoder</strong> <strong>to</strong> <strong>Work</strong><br />
III. Survey Approach<br />
From the workflow overview, we can see that the intention now is <strong>to</strong> have users perform all of<br />
their backscatter correction, analysis, and mosaicking in one place: Mosaic Edi<strong>to</strong>r. This is all part<br />
of a fundamental shift in SIPS methodology analogous <strong>to</strong> the impact of Subset Edi<strong>to</strong>r on HIPS.<br />
In this new model, the user is encouraged <strong>to</strong> process data using the <strong>Geocoder</strong> engine with its<br />
default settings, which produce geo-referenced, corrected data. The user next selects some or all<br />
of the processed data and creates a mosaic. The next step then is <strong>to</strong> examine the mosaic and<br />
determine if it warrants further work.<br />
If there are areas of concern arising from inspection of the mosaic (or analysis of the sediment<br />
data using the SAT), the user may elect <strong>to</strong> examine the data more closely (see Figure 2). The<br />
geo-referenced, corrected data may provide the necessary clues <strong>to</strong> reprocess some or all of the<br />
data. If a deeper analysis is required, a time-based, waterfall style edi<strong>to</strong>r is integrated in<strong>to</strong> Mosaic<br />
Edi<strong>to</strong>r. The waterfall edi<strong>to</strong>r is capable of ping-based editing, processing and analysis that will be<br />
immediately familiar <strong>to</strong> SIPS users. It features a Signal Display Window, contact editing <strong>to</strong>ols,<br />
numerous correction <strong>to</strong>ols and an area based zoom window.<br />
IV. <strong>Geocoder</strong> Processing<br />
Figure 2: Levels of Investigation in a Survey Approach<br />
To process source data with the <strong>Geocoder</strong> engine is <strong>to</strong> apply Dr. Fonseca’s suite of accurately<br />
modelled backscatter correction algorithms. <strong>Geocoder</strong> has numerous radiometric and geometric<br />
corrections, all of which are available <strong>to</strong> the user in SIPS. Generally speaking, due <strong>to</strong> the<br />
sophistication and reliability of <strong>Geocoder</strong>’s corrections, it is best <strong>to</strong> leave the default settings<br />
enabled. Due <strong>to</strong> the integration with HIPS and SIPS, raw source data need only be read and<br />
processed once, thus clearly offering a simple and efficient manner of processing data while<br />
taking full advantage of <strong>Geocoder</strong>’s abilities.<br />
With the integration in SIPS, the output for <strong>Geocoder</strong>-processed data is s<strong>to</strong>red in a new type of<br />
file called a GeoBaR (Geo-referenced, Backscatter Raster). GeoBaRs are central <strong>to</strong> Mosaic<br />
Edi<strong>to</strong>r and the new workflow. GeoBaRs use BASE Surface technology and share in all of the<br />
benefits of that technology such as data caching which helps provide scalability. With the<br />
introduction of CARIS’ new CSAR framework <strong>to</strong> BASE Surfaces, fully editable, gigapixel<br />
mosaics are now realizable.<br />
Shallow Survey 2008 A.J. MacDonald / C. Collins 4 / 9
<strong>Taking</strong> <strong>Geocoder</strong> <strong>to</strong> <strong>Work</strong><br />
Using GeoBaRs as <strong>Geocoder</strong>’s output target provides another clear advantage: the ability <strong>to</strong> have<br />
many GeoBaRs per survey line. This can be very useful when dealing with file formats such as<br />
XTF which can have multiple sources of imagery data. The Reson XTF record, for instance, may<br />
have Beam Average Intensity, Side Scan, and Snippet data. Mosaic Edi<strong>to</strong>r allows the user <strong>to</strong><br />
process all of these and even visually compare them if desired. Mosaic Edi<strong>to</strong>r also allows the<br />
user <strong>to</strong> process and s<strong>to</strong>re the data at different resolutions.<br />
It may be prudent <strong>to</strong> note that this flexibility may present its own management issues with the<br />
number of mosaics and GeoBaRs being produced. Fortunately, since these are all actually BASE<br />
Surfaces, they can be s<strong>to</strong>red in CARIS Bathy DataBASE. This facilitates sharing of such data<br />
between different users, groups, or offices. It also provides other advantages like the ability <strong>to</strong><br />
correlate mosaic imagery data with bathymetry data and the ability <strong>to</strong> restrict access <strong>to</strong> data<br />
based on user privileges.<br />
V. Creating Mosaics<br />
GeoBaRs are the prerequisite for creating any mosaic in SIPS. The conformity that this imposes<br />
actually provides significant new opportunities in SIPS. As noted, more than one GeoBaR may<br />
be created per line, permitting mosaics <strong>to</strong> be created from different types of source data and from<br />
various resolutions. Additionally, GeoBaRs from other surveys in the same geographical area<br />
may also be used in the creation of a mosaic. In this way, mosaics can be composited using<br />
survey data from various vessels, equipment, and logged data formats from any number of<br />
related surveys.<br />
Creating mosaics in SIPS can be done in a variety of ways. Such diversity is useful since not all<br />
situations can be anticipated. However, there is a suggested workflow and associated <strong>to</strong>ol set for<br />
mosaic creation that will be examined in this section.<br />
First step: Select GeoBaRs for inclusion.<br />
The GeoBaRs that are <strong>to</strong> be used as source data for the mosaic must be selected and loaded in<br />
Mosaic Edi<strong>to</strong>r. This is likely one of the times that the user will encounter the Conflict Resolution<br />
dialog, which helps au<strong>to</strong>mate the selection process. The Conflict Resolution dialog presents<br />
options <strong>to</strong> the user when survey lines are found <strong>to</strong> have multiple associated GeoBaRs. It allows<br />
the user <strong>to</strong> au<strong>to</strong>matically select from the most recently created, finest resolution, or particular<br />
source data type. The user may opt <strong>to</strong> choose the GeoBaR manually as well using the au<strong>to</strong>generated<br />
drop-down list. The user has the option <strong>to</strong> apply the au<strong>to</strong>mated decision logic <strong>to</strong> all<br />
conflicts at once, or may decide each one sequentially. Once the GeoBaRs are selected and<br />
loaded, they can be used <strong>to</strong> create a mosaic.<br />
Second step: Create an initial mosaic<br />
To create the initial mosaic, the user has a choice of three au<strong>to</strong>mated compositing algorithms:<br />
au<strong>to</strong>-seam, shine-through, and overwrite. Au<strong>to</strong>-seam uses a weighting scheme <strong>to</strong> determine<br />
which value is the most valid <strong>to</strong> display in overlapping regions. Shine-through uses the largest<br />
value from the set of possible values in a contested cell. Overwrite uses the draw order <strong>to</strong><br />
determine the successful point. For the overwrite case, the effect of draw order can be seen<br />
before creating a mosaic. Controls have been provided on the edit panel <strong>to</strong> allow the user <strong>to</strong> raise<br />
Shallow Survey 2008 A.J. MacDonald / C. Collins 5 / 9
<strong>Taking</strong> <strong>Geocoder</strong> <strong>to</strong> <strong>Work</strong><br />
or lower the currently selected GeoBaR, i.e. change its Z-order, and see the result instantly. Gone<br />
is the multi-step Mosaic Wizard; <strong>to</strong> create mosaics now, a simple dialog is invoked where a few<br />
necessary parameters are entered.<br />
It is important <strong>to</strong> note that it is not necessary <strong>to</strong> include all GeoBaRs in the mosaic at once, more<br />
may be added at any time using the Add <strong>to</strong> Mosaic function. If performing this step, there are<br />
two other combine types that may be used: underlay (opposite of overwrite) and default (uses the<br />
mosaic’s combine method). GeoBaRs already included in a mosaic may be removed. These<br />
“Component GeoBaRs” may be removed using the Remove from Mosaic command and one of<br />
two options: Remove Complete and Remove Explicit. Remove Complete will re-mosaic the area<br />
covered by the Component GeoBaR being removed, but without data from this GeoBaR.<br />
Remove Explicit uses the Contribu<strong>to</strong>r layer <strong>to</strong> remove only those values that are explicitly listed<br />
as being from the GeoBaR being removed. This allows any blended points <strong>to</strong> remain in the<br />
mosaic.<br />
Third step: His<strong>to</strong>gram editing and Blending<br />
The his<strong>to</strong>gram controls allow the user <strong>to</strong> adjust the target item’s values by reshaping the<br />
his<strong>to</strong>gram for that target. Individual GeoBaRs, Component GeoBaRs (those which are already<br />
part of a mosaic), and Mosaics may all be edited in this fashion. The intent of this control, and of<br />
all controls on this panel, is for the user <strong>to</strong> focus on the visual impact of their changes and not on<br />
the controls themselves. To this end, no numeric values have been used on this interface. All<br />
changes are made <strong>to</strong> the Current Intensity layer of the target, the Original Intensity layer always<br />
contains the originally processed data. The Current Intensity layer may be reset <strong>to</strong> the Original<br />
Intensity values if desired.<br />
The Blend function is only available for Component GeoBaRs. This is the same blend function<br />
as is found in <strong>Geocoder</strong> and can be very effective. Changes made while using this function are<br />
s<strong>to</strong>red on a temporary GeoBaR and may be applied <strong>to</strong> the mosaic or cancelled.<br />
Fourth Step: Finish editing / Re-edit<br />
When editing is complete, the user should exit the mosaic edit mode. The mosaic may be edited<br />
further at any time. When re-entering edit mode, all unloaded component GeoBaRs will be<br />
au<strong>to</strong>matically reloaded and their draw order re-instated. This allows mosaic editing <strong>to</strong> be<br />
performed over multiple sessions.<br />
VI. Sediment Analysis<br />
One of the most innovative aspects of <strong>Geocoder</strong> is its sediment analysis capabilities. This is<br />
made possible by the accurate removal of acquisition artifacts found in the source data and by the<br />
sediment angular response models built in<strong>to</strong> <strong>Geocoder</strong>. These models were implemented in<br />
<strong>Geocoder</strong> by Dr. Fonseca and are based on years of published research in this area. This is a<br />
crucial point, for it is these models that drive the analysis, rather than any sort of “curve fitting”<br />
algorithm. This powerful <strong>to</strong>ol, known in <strong>Geocoder</strong> as ARA, is realized in SIPS as the Sediment<br />
Analysis Tool (SAT). The SAT was designed <strong>to</strong> provide the complete capabilities of <strong>Geocoder</strong>’s<br />
ARA engine in an easy-<strong>to</strong>-use interface that accommodates the varying needs of SIPS users.<br />
Shallow Survey 2008 A.J. MacDonald / C. Collins 6 / 9
<strong>Taking</strong> <strong>Geocoder</strong> <strong>to</strong> <strong>Work</strong><br />
The Sediment Analysis Tool is composed of two main parts: a dockable, resizable SIPS graph<br />
window that displays the average angular response for a given range of data (see Figure 3), and<br />
an uncomplicated set of controls for initiating analysis or interacting with the backscatter models.<br />
The controls have both standard and advanced modes of operation.<br />
Figure 3: The Sediment Analysis Graph Window<br />
The standard mode allows the user <strong>to</strong> analyze results for port and/or starboard returns. With a<br />
single click, <strong>Geocoder</strong>’s sediment analysis engine springs in<strong>to</strong> action, evidenced by the graph’s<br />
visibly converging backscatter model traces. When the analysis is complete, the user may choose<br />
<strong>to</strong> view the model’s parameter values for either port or starboard, or they may be satisfied with<br />
the provided textual result.<br />
In the advanced mode, the user has the freedom <strong>to</strong> interact with the model, adjusting the<br />
parameters and seeing the graph’s backscatter traces update au<strong>to</strong>matically. Model parameters<br />
may be adjusted using either a single slider control or using a numeric entry box. At any point,<br />
the user may ask <strong>Geocoder</strong> <strong>to</strong> analyze the angular response they have entered <strong>to</strong> get <strong>Geocoder</strong>’s<br />
corresponding textual representation.<br />
As noted above, the sediment analysis graph plays an important part in both standard and<br />
advanced analysis modes. The graph’s display is based on the same technology as SIPS’ other<br />
graphs windows, such as the Signal Display Window, thus it has features like au<strong>to</strong>matic scaling<br />
of data in<strong>to</strong> human-friendly values, an interactive <strong>to</strong>ol-tip <strong>to</strong> display values, and cus<strong>to</strong>mizable<br />
colours. However, the graph window does not need <strong>to</strong> be open <strong>to</strong> use the sediment analysis<br />
functionality.<br />
Shallow Survey 2008 A.J. MacDonald / C. Collins 7 / 9
<strong>Taking</strong> <strong>Geocoder</strong> <strong>to</strong> <strong>Work</strong><br />
VII. Au<strong>to</strong>mation<br />
A notable advantage for some organizations has been the ability <strong>to</strong> create, share, recall, and<br />
apply process templates for performing work in SIPS. This allows for routine operations <strong>to</strong> be<br />
au<strong>to</strong>mated, and also permits organizations <strong>to</strong> standardize operations and workflows. The<br />
templates allow the user <strong>to</strong> set up any of the SIPS Processing <strong>to</strong>ols and even determine their<br />
process order for maximum flexibility. The process template may be applied <strong>to</strong> one or more<br />
survey lines.<br />
With the inclusion of <strong>Geocoder</strong>, the SIPS Template Wizard (STW) has been augmented <strong>to</strong> allow<br />
users <strong>to</strong> choose which processing engine they wish <strong>to</strong> use, <strong>Geocoder</strong> or SIPS. All process options<br />
available in the application are also available in the STW. Also, now that GeoBaRs are the target<br />
output of all processing in SIPS, the STW has provision <strong>to</strong> make these au<strong>to</strong>matically. For<br />
convenience when creating new templates, the most recently used settings from Mosaic Edi<strong>to</strong>r<br />
will be the default values for the STW.<br />
VIII. Conclusions<br />
The integration of <strong>Geocoder</strong> in HIPS and SIPS has brought numerous benefits. <strong>Geocoder</strong> is the<br />
engine behind much of Mosaic Edi<strong>to</strong>r, with its correction, sediment analysis, mosaic creation and<br />
editing capabilities, making it a complete solution for backscatter processing and analysis. These<br />
new competencies, alongside the existing bathymetric and side scan processing, allows an<br />
organization <strong>to</strong> have one application and one overall workflow for all Bathymetry and Imagery<br />
post-processing needs. Efficiency and consistency can also be increased through the use of<br />
process templates. Al<strong>to</strong>gether, this allows greater control and promotes quality through<br />
consistent processes.<br />
The use of BASE Surface technology provides scalability and efficiencies in large data sets with<br />
CARIS’ CSAR Framework. S<strong>to</strong>ring Mosaics and GeoBaRs in Bathy DataBASE provides the<br />
ability <strong>to</strong> share data between users, groups, offices; easily correlate mosaic imagery with<br />
bathymetry; restrict access <strong>to</strong> data; and provide traceability. Creating and retaining GeoBaRs<br />
means that originally processed data, i.e. not altered by the editing controls, is always available.<br />
Since the GeoBaR information is not lost, Mosaics can also be re-edited or recreated from the<br />
originally processed data.<br />
<strong>Geocoder</strong> in CARIS HIPS and SIPS offers stability. CARIS is ISO 9001 certified and uses a<br />
standardized process approach <strong>to</strong> ensuring quality in software. CARIS’ static and dynamic<br />
testing processes include Requirements, Design and Code Reviews; Unit, Integration,<br />
Regression, and <strong>Work</strong>flow testing; and a client Beta testing program.<br />
By carefully integrating <strong>Geocoder</strong> with proven HIPS & SIPS technology, CARIS has met the<br />
challenges involved in bringing <strong>Geocoder</strong> <strong>to</strong> the commercial environment. Combining years of<br />
proven software, workflows, and data formats with innovative ideas and purpose-built interfaces,<br />
HIPS & SIPS maximizes the potential of <strong>Geocoder</strong>’s processing and analysis.<br />
Shallow Survey 2008 A.J. MacDonald / C. Collins 8 / 9
<strong>Taking</strong> <strong>Geocoder</strong> <strong>to</strong> <strong>Work</strong><br />
IX. Future <strong>Work</strong><br />
Though there may be many small and medium enhancements <strong>to</strong> come, there are two major<br />
initiatives that are expected <strong>to</strong> be the centrepiece of the next version of SIPS. The first is the<br />
complete overhaul of the contact editing facility in SIPS. A new set of <strong>to</strong>ols will be developed <strong>to</strong><br />
make contact cataloguing smooth and intuitive. It is expected <strong>to</strong> have an intelligent contact<br />
correlation system, built on <strong>to</strong>p of a relational database with cus<strong>to</strong>mizable feature catalogues. It<br />
will also have the kinds of powerful but easy-<strong>to</strong>-use controls such as an interactive pan and zoom<br />
snapshot window, his<strong>to</strong>gram controls, and simple measurement <strong>to</strong>ols. This new <strong>to</strong>ol will be<br />
integrated in<strong>to</strong> Mosaic Edi<strong>to</strong>r and also allow for contact creation on GeoBaRs and mosaics rather<br />
being limited <strong>to</strong> the traditional waterfall approach.<br />
The second major initiative is the ability <strong>to</strong> produce a new type of SIPS output product, an<br />
au<strong>to</strong>mated sediment classification map. Building on <strong>Geocoder</strong>’s abilities and using existing<br />
CARIS technology, the sediment classification map will take the form of a mosaic with<br />
additional layers and attributes. It will also allow for integrated ground truth recording and<br />
provide options for a legend and other image formatting considerations. Leveraging both code<br />
bases most useful qualities in this area, the classification algorithm will be au<strong>to</strong>mated and<br />
efficient. This is expected <strong>to</strong> fully compatible with Bathy DataBASE.<br />
References<br />
Fonseca, L., and Mayer, L.A., 2007, Remote estimation of surficial seafloor properties through<br />
the application Angular Range Analysis <strong>to</strong> multibeam sonar data. Marine Geophysical<br />
Researches, p. 119-126. (Refereed Publication)<br />
Fonseca, L., and Calder, B., 2005, <strong>Geocoder</strong>: an efficient backscatter map construc<strong>to</strong>r.<br />
Proceedings of the U.S. Hydrographic Conference 2005, San Diego, C.A.<br />
Masry, M., and Collins, C., 2008, Scaling Bathymetry: Data handling for large volumes.<br />
Proceedings of the Shallow Survey Conference 2008, Portsmouth, N.H.<br />
Shallow Survey 2008 A.J. MacDonald / C. Collins 9 / 9