annual_repport_staatsolie_2016_lr

You also want an ePaper? Increase the reach of your titles
YUMPU automatically turns print PDFs into web optimized ePapers that Google loves.
Annual REPORT<br />
Confidence in Our Own Abilities<br />
50<br />
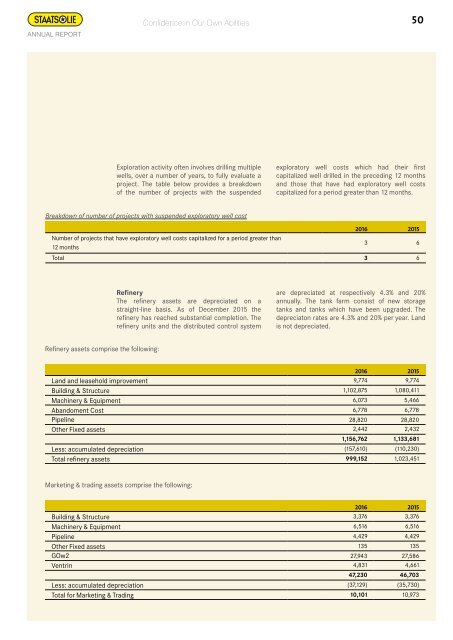
Exploration activity often involves drilling multiple<br />
wells, over a number of years, to fully evaluate a<br />
project. The table below provides a breakdown<br />
of the number of projects with the suspended<br />
exploratory well costs which had their first<br />
capitalized well drilled in the preceding 12 months<br />
and those that have had exploratory well costs<br />
capitalized for a period greater than 12 months.<br />
Breakdown of number of projects with suspended exploratory well cost<br />
<strong>2016</strong> 2015<br />
Number of projects that have exploratory well costs capitalized for a period greater than<br />
12 months<br />
3 6<br />
Total 3 6<br />
Refinery<br />
The refinery assets are depreciated on a<br />
straight‐line basis. As of December 2015 the<br />
refinery has reached substantial completion. The<br />
refinery units and the distributed control system<br />
are depreciated at respectively 4.3% and 20%<br />
<strong>annual</strong>ly. The tank farm consist of new storage<br />
tanks and tanks which have been upgraded. The<br />
depreciaton rates are 4.3% and 20% per year. Land<br />
is not depreciated.<br />
Refinery assets comprise the following:<br />
<strong>2016</strong> 2015<br />
Land and leasehold improvement 9,774 9,774<br />
Building & Structure 1,102,875 1,080,411<br />
Machinery & Equipment 6,073 5,466<br />
Abandoment Cost 6,778 6,778<br />
Pipeline 28,820 28,820<br />
Other Fixed assets 2,442 2,432<br />
1,156,762 1,133,681<br />
Less: accumulated depreciation (157,610) (110,230)<br />
Total refinery assets 999,152 1,023,451<br />
Marketing & trading assets comprise the following:<br />
<strong>2016</strong> 2015<br />
Building & Structure 3,376 3,376<br />
Machinery & Equipment 6,516 6,516<br />
Pipeline 4,429 4,429<br />
Other Fixed assets 135 135<br />
GOw2 27,943 27,586<br />
Ventrin 4,831 4,661<br />
47,230 46,703<br />
Less: accumulated depreciation (37,129) (35,730)<br />
Total for Marketing & Trading 10,101 10,973