annual_repport_staatsolie_2016_lr

Create successful ePaper yourself
Turn your PDF publications into a flip-book with our unique Google optimized e-Paper software.
Annual REPORT<br />
Confidence in Our Own Abilities 67<br />
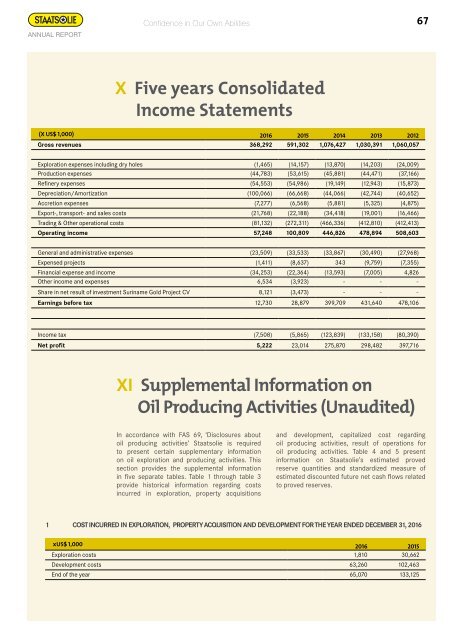
X Five years Consolidated<br />
Income Statements<br />
(x US$ 1,000) <strong>2016</strong> 2015 2014 2013 2012<br />
Gross revenues 368,292 591,302 1,076,427 1,030,391 1,060,057<br />
Exploration expenses including dry holes (1,465) (14,157) (13,870) (14,203) (24,009)<br />
Production expenses (44,783) (53,615) (45,881) (44,471) (37,166)<br />
Refinery expenses (54,553) (54,986) (19,149) (12,943) (15,873)<br />
Depreciation/Amortization (100,066) (66,668) (44,066) (42,744) (40,652)<br />
Accretion expenses (7,277) (6,568) (5,881) (5,325) (4,875)<br />
Export‐, transport‐ and sales costs (21,768) (22,188) (34,418) (19,001) (16,466)<br />
Trading & Other operational costs (81,132) (272,311) (466,336) (412,810) (412,413)<br />
Operating income 57,248 100,809 446,826 478,894 508,603<br />
General and administrative expenses (23,509) (33,533) (33,867) (30,490) (27,968)<br />
Expensed projects (1,411) (8,637) 343 (9,759) (7,355)<br />
Financial expense and income (34,253) (22,364) (13,593) (7,005) 4,826<br />
Other income and expenses 6,534 (3,923) - - -<br />
Share in net result of investment Suriname Gold Project CV 8,121 (3,473) - - -<br />
Earnings before tax 12,730 28,879 399,709 431,640 478,106<br />
Income tax (7,508) (5,865) (123,839) (133,158) (80,390)<br />
Net profit 5,222 23,014 275,870 298,482 397,716<br />
XI Supplemental Information on<br />
Oil Producing Activities (Unaudited)<br />
In accordance with FAS 69, ‘Disclosures about<br />
oil producing activities’ Staatsolie is required<br />
to present certain supplementary information<br />
on oil exploration and producing activities. This<br />
section provides the supplemental information<br />
in five separate tables. Table 1 through table 3<br />
provide historical information regarding costs<br />
incurred in exploration, property acquisitions<br />
and development, capitalized cost regarding<br />
oil producing activities, result of operations for<br />
oil producing activities. Table 4 and 5 present<br />
information on Staatsolie’s estimated proved<br />
reserve quantities and standardized measure of<br />
estimated discounted future net cash flows related<br />
to proved reserves.<br />
1 Cost incurred in exploration, property acquisition and development for the year ended December 31, <strong>2016</strong><br />
xUS$ 1,000 <strong>2016</strong> 2015<br />
Exploration costs 1,810 30,662<br />
Development costs 63,260 102,463<br />
End of the year 65,070 133,125