Presentation_shippers meeting 2017

You also want an ePaper? Increase the reach of your titles
YUMPU automatically turns print PDFs into web optimized ePapers that Google loves.
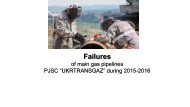
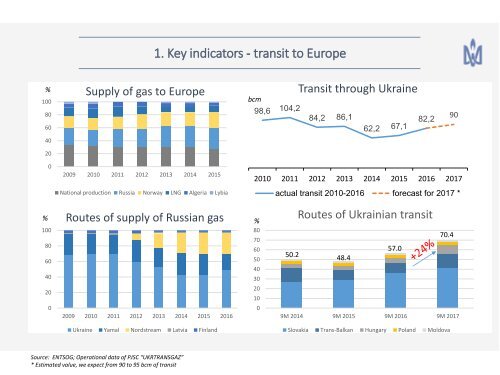
1. Key indicators - transit to Europe<br />
%<br />
100<br />
Supply of gas to Europe<br />
bcm<br />
Transit through Ukraine<br />
80<br />
60<br />
98,6 104,2 84,2 86,1<br />
62,2 67,1<br />
82,2<br />
90<br />
40<br />
20<br />
0<br />
2009 2010 2011 2012 2013 2014 2015<br />
National production Russia Norway LNG Algeria Lybia<br />
2010 2011 2012 2013 2014 2015 2016 <strong>2017</strong><br />
actual transit 2010-2016 forecast for <strong>2017</strong> *<br />
%<br />
100<br />
80<br />
60<br />
40<br />
20<br />
0<br />
Routes of supply of Russian gas<br />
2009 2010 2011 2012 2013 2014 2015 2016<br />
%<br />
80<br />
70<br />
60<br />
50<br />
40<br />
30<br />
20<br />
10<br />
0<br />
Routes of Ukrainian transit<br />
70.4<br />
57.0<br />
50.2<br />
48.4<br />
9M 2014 9M 2015 9M 2016 9M <strong>2017</strong><br />
Ukraine Yamal Nordstream Latvia Finland<br />
Slovakia Trans-Balkan Hungary Poland Moldova<br />
Source: ENTSOG; Operational data of PJSC “UKRTRANSGAZ”<br />
* Estimated value, we expect from 90 to 95 bcm of transit