quality-indicators-2017
You also want an ePaper? Increase the reach of your titles
YUMPU automatically turns print PDFs into web optimized ePapers that Google loves.
QUALITY INDICATORS <strong>2017</strong><br />
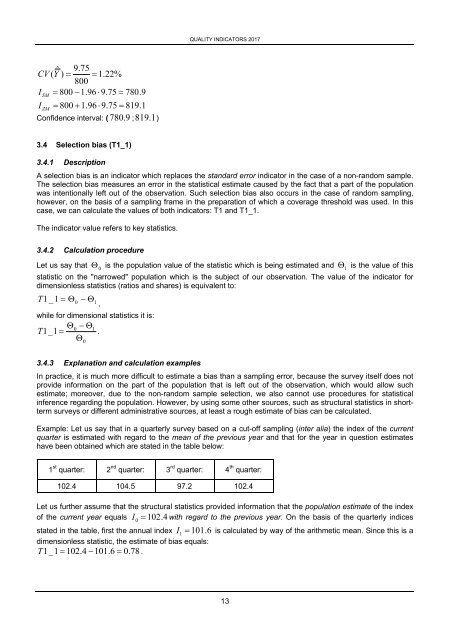
9.75<br />
CV ( Y<br />
ˆ<br />
) 1.22%<br />
800<br />
800 1.96<br />
9.75 780.9<br />
I<br />
SM<br />
I<br />
ZM<br />
800 1.96<br />
9.75 819.1<br />
Confidence interval: ( 780 . 9 ; 819 . 1)<br />
3.4 Selection bias (T1_1)<br />
3.4.1 Description<br />
A selection bias is an indicator which replaces the standard error indicator in the case of a non-random sample.<br />
The selection bias measures an error in the statistical estimate caused by the fact that a part of the population<br />
was intentionally left out of the observation. Such selection bias also occurs in the case of random sampling,<br />
however, on the basis of a sampling frame in the preparation of which a coverage threshold was used. In this<br />
case, we can calculate the values of both <strong>indicators</strong>: T1 and T1_1.<br />
The indicator value refers to key statistics.<br />
3.4.2 Calculation procedure<br />
Let us say that <br />
0<br />
is the population value of the statistic which is being estimated and <br />
1<br />
is the value of this<br />
statistic on the "narrowed" population which is the subject of our observation. The value of the indicator for<br />
dimensionless statistics (ratios and shares) is equivalent to:<br />
T1_1<br />
0<br />
1<br />
,<br />
while for dimensional statistics it is:<br />
0<br />
1<br />
T 1_1 .<br />
<br />
0<br />
3.4.3 Explanation and calculation examples<br />
In practice, it is much more difficult to estimate a bias than a sampling error, because the survey itself does not<br />
provide information on the part of the population that is left out of the observation, which would allow such<br />
estimate; moreover, due to the non-random sample selection, we also cannot use procedures for statistical<br />
inference regarding the population. However, by using some other sources, such as structural statistics in shortterm<br />
surveys or different administrative sources, at least a rough estimate of bias can be calculated.<br />
Example: Let us say that in a quarterly survey based on a cut-off sampling (inter alia) the index of the current<br />
quarter is estimated with regard to the mean of the previous year and that for the year in question estimates<br />
have been obtained which are stated in the table below:<br />
1 st quarter: 2 nd quarter: 3 rd quarter: 4 th quarter:<br />
102.4 104.5 97.2 102.4<br />
Let us further assume that the structural statistics provided information that the population estimate of the index<br />
of the current year equals I 102.<br />
0<br />
4 with regard to the previous year. On the basis of the quarterly indices<br />
stated in the table, first the annual index I<br />
1<br />
101. 6 is calculated by way of the arithmetic mean. Since this is a<br />
dimensionless statistic, the estimate of bias equals:<br />
T 1_1<br />
102.4 101.6<br />
0.78 .<br />
13


