quality-indicators-2017

Create successful ePaper yourself
Turn your PDF publications into a flip-book with our unique Google optimized e-Paper software.
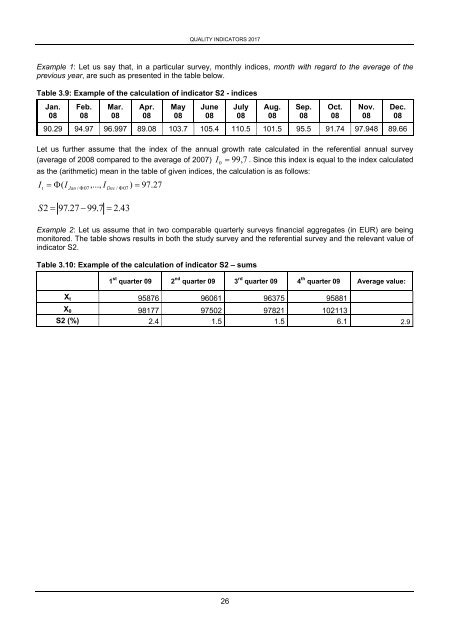
QUALITY INDICATORS <strong>2017</strong><br />
Example 1: Let us say that, in a particular survey, monthly indices, month with regard to the average of the<br />
previous year, are such as presented in the table below.<br />
Table 3.9: Example of the calculation of indicator S2 - indices<br />
Jan.<br />
08<br />
Feb.<br />
08<br />
Mar.<br />
08<br />
Apr.<br />
08<br />
May<br />
08<br />
June<br />
08<br />
90.29 94.97 96.997 89.08 103.7 105.4 110.5 101.5 95.5 91.74 97.948 89.66<br />
Let us further assume that the index of the annual growth rate calculated in the referential annual survey<br />
(average of 2008 compared to the average of 2007) I<br />
0<br />
99, 7 . Since this index is equal to the index calculated<br />
as the (arithmetic) mean in the table of given indices, the calculation is as follows:<br />
I<br />
t<br />
<br />
( I<br />
Jan Dec 07<br />
/ 07,...,<br />
I<br />
/<br />
) 97.27<br />
S 2 97.27 99.7 2.43<br />
Example 2: Let us assume that in two comparable quarterly surveys financial aggregates (in EUR) are being<br />
monitored. The table shows results in both the study survey and the referential survey and the relevant value of<br />
indicator S2.<br />
July<br />
08<br />
Table 3.10: Example of the calculation of indicator S2 – sums<br />
Aug.<br />
08<br />
Sep.<br />
08<br />
Oct.<br />
08<br />
Nov.<br />
08<br />
Dec.<br />
08<br />
1 st quarter 09 2 nd quarter 09 3 rd quarter 09 4 th quarter 09 Average value:<br />
X t 95876 96061 96375 95881<br />
X 0 98177 97502 97821 102113<br />
S2 (%) 2.4 1.5 1.5 6.1 2.9<br />
26