quality-indicators-2017

You also want an ePaper? Increase the reach of your titles
YUMPU automatically turns print PDFs into web optimized ePapers that Google loves.
QUALITY INDICATORS <strong>2017</strong><br />
The code list of variable statuses. The purpose of the code list in the statistical process is to provide simple yet<br />
exhaustive records on individual data changes in various phases of the statistical process. In terms of structure,<br />
this code list is a 3-level code list consisting of five-digit sign codes in the form xy.zz. The first level (x) tells us<br />
how the data were obtained (directly from the reporting unit or in some other way). The second level shows the<br />
status of data after the completed statistical process and provides in particular an overview of the data which in<br />
the data processing phase changed value and of the data which remained unchanged. The third, two-digit (xx)<br />
level is intended for the records on the method by which data whose values changed have been modified.<br />
6.2 Macro-level <strong>indicators</strong><br />
In Chapter 5, the content of <strong>indicators</strong> at the macro level has already been described. It follows from their<br />
definition that these <strong>indicators</strong> are always closely connected with the procedures for statistical processing<br />
through which original micro data are changed. In fact, macro-level <strong>indicators</strong> show the impact of individual<br />
procedures on the (key) statistics of the survey.<br />
The basic assumption to be fulfilled for the calculation of macro-level <strong>indicators</strong> through an automated<br />
procedure and general programme is that the data version can be precisely defined by individual processing<br />
steps and that the data version is recorded in a standard manner. SURS resolved this problem by using a<br />
separate standard variable appearing in all micro databases; it is called "record status". The values of the<br />
variable indicate at which step of the procedure an individual data version was created. Unlike the previously<br />
described statuses (e.g. the unit status, variable status) used in statistical processing, in this case the values are<br />
not related to the common standard code list; instead, the values of the record status are determined in<br />
individual surveys.<br />
The automated procedure for calculating macro-level <strong>indicators</strong> thus results in values of selected statistics by<br />
individual steps of statistical processing, and the differences between the value of the statistics in the preceding<br />
step. Below, a purely hypothetical example of "made up" survey data is presented involving two steps of<br />
statistical data processing: corrections and imputations. Record status 1 thus designates raw data, while record<br />
status 2 designates data that were changed in the correction phase, while record status 3 designates data that<br />
were changed in the imputation phase. The table below shows an example of a printout of macro-level<br />
<strong>indicators</strong>, the average income per employee in a certain activity (statistics designation POVP_PRIH).<br />
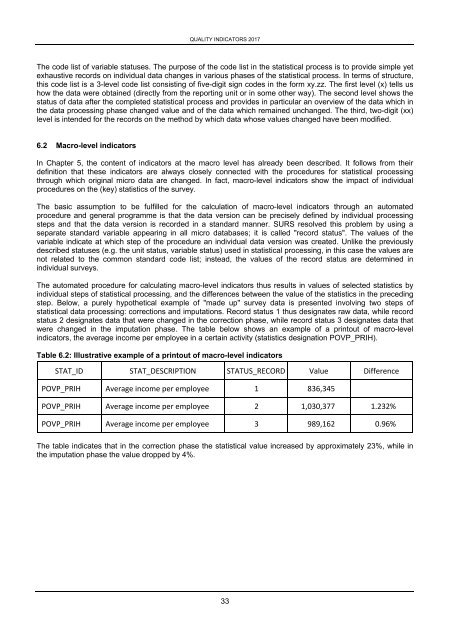
Table 6.2: Illustrative example of a printout of macro-level <strong>indicators</strong><br />
STAT_ID STAT_DESCRIPTION STATUS_RECORD Value Difference<br />
POVP_PRIH Average income per employee 1 836,345<br />
POVP_PRIH Average income per employee 2 1,030,377 1.232%<br />
POVP_PRIH Average income per employee 3 989,162 0.96%<br />
The table indicates that in the correction phase the statistical value increased by approximately 23%, while in<br />
the imputation phase the value dropped by 4%.<br />
33