quality-indicators-2017

Create successful ePaper yourself
Turn your PDF publications into a flip-book with our unique Google optimized e-Paper software.
QUALITY INDICATORS <strong>2017</strong><br />
5 PROCESS INDICATORS AT THE MACRO LEVEL<br />
5.1 Description<br />
The development of new statistical methods and procedures and the development of computer applications that<br />
enable the introduction of such progressive methods has substantially changed the modern process of statistical<br />
data processing. Despite the undisputable positive impact, in particular in terms of efficiency and professional<br />
consistency, such development also brings consequences which producers in particular have not accepted with<br />
great enthusiasm. One of the less positive results of this development is that statistical processing is turning into<br />
an increasingly closed system for subject-matter statisticians – a black box, into which they have no insight and<br />
can only see the final results "produced" by that box (if things work as they should). In a very simplified way,<br />
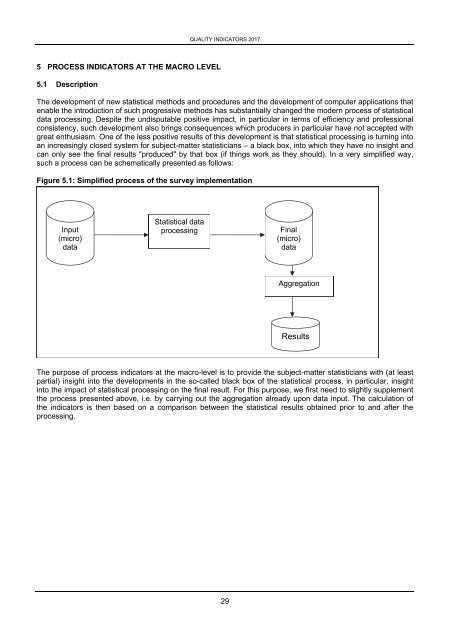
such a process can be schematically presented as follows:<br />
Figure 5.1: Simplified process of the survey implementation<br />
Input<br />
(micro)<br />
data<br />
Statistical data<br />
processing<br />
Final<br />
(micro)<br />
data<br />
Aggregation<br />
Results<br />
The purpose of process <strong>indicators</strong> at the macro-level is to provide the subject-matter statisticians with (at least<br />
partial) insight into the developments in the so-called black box of the statistical process, in particular, insight<br />
into the impact of statistical processing on the final result. For this purpose, we first need to slightly supplement<br />
the process presented above, i.e. by carrying out the aggregation already upon data input. The calculation of<br />
the <strong>indicators</strong> is then based on a comparison between the statistical results obtained prior to and after the<br />
processing.<br />
29