quality-indicators-2017

Create successful ePaper yourself
Turn your PDF publications into a flip-book with our unique Google optimized e-Paper software.
QUALITY INDICATORS <strong>2017</strong><br />
If w is the final weight, the weighted value is calculated as follows:<br />
i<br />
p<br />
<br />
Vi<br />
wi<br />
yi<br />
i1<br />
T5 ut<br />
<br />
.<br />
p<br />
w y<br />
<br />
i 1<br />
i<br />
i<br />
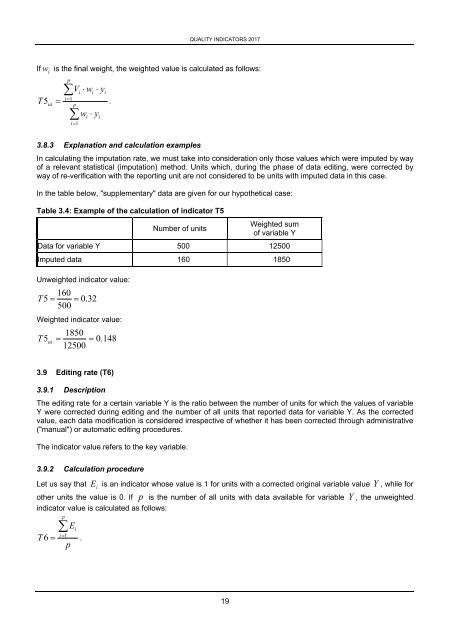
3.8.3 Explanation and calculation examples<br />
In calculating the imputation rate, we must take into consideration only those values which were imputed by way<br />
of a relevant statistical (imputation) method. Units which, during the phase of data editing, were corrected by<br />
way of re-verification with the reporting unit are not considered to be units with imputed data in this case.<br />
In the table below, "supplementary" data are given for our hypothetical case:<br />
Table 3.4: Example of the calculation of indicator T5<br />
Number of units<br />
Weighted sum<br />
of variable Y<br />
Data for variable Y 500 12500<br />
Imputed data 160 1850<br />
Unweighted indicator value:<br />
160<br />
T 5 0.32<br />
500<br />
Weighted indicator value:<br />
1850<br />
T 5ut<br />
0.148<br />
12500<br />
3.9 Editing rate (T6)<br />
3.9.1 Description<br />
The editing rate for a certain variable Y is the ratio between the number of units for which the values of variable<br />
Y were corrected during editing and the number of all units that reported data for variable Y. As the corrected<br />
value, each data modification is considered irrespective of whether it has been corrected through administrative<br />
("manual") or automatic editing procedures.<br />
The indicator value refers to the key variable.<br />
3.9.2 Calculation procedure<br />
Let us say that E<br />
i<br />
is an indicator whose value is 1 for units with a corrected original variable value Y , while for<br />
other units the value is 0. If p is the number of all units with data available for variable Y , the unweighted<br />
indicator value is calculated as follows:<br />
p<br />
<br />
Ei<br />
i<br />
T 6 1 .<br />
p<br />
19