

The 21st Century Charter Schools Initiative
The 21st Century Charter Schools Initiative
The 21st Century Charter Schools Initiative

Create successful ePaper yourself
Turn your PDF publications into a flip-book with our unique Google optimized e-Paper software.
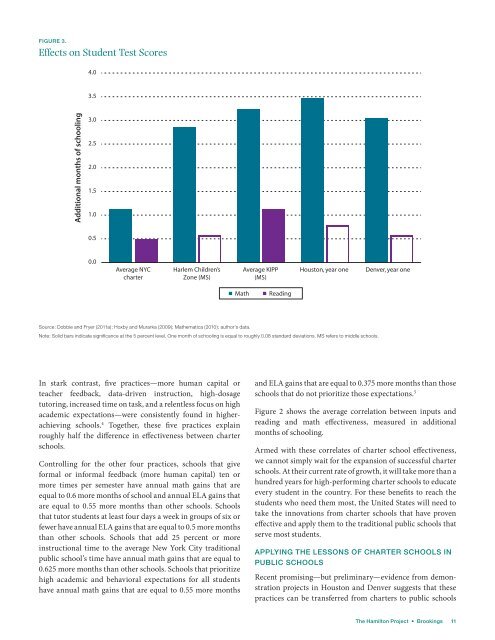
Figure 3.<br />
Effects on Student Test Scores<br />
4.0<br />
3.5<br />
Additional months of schooling<br />
3.0<br />
2.5<br />
2.0<br />
1.5<br />
1.0<br />
0.5<br />
0.0<br />
Average NYC<br />
charter<br />
Harlem Children’s<br />
Zone (MS)<br />
Average KIPP<br />
(MS)<br />
Houston, year one<br />
Denver, year one<br />
Math<br />
Reading<br />
Source: Dobbie and Fryer (2011a); Hoxby and Murarka (2009); Mathematica (2010); author’s data.<br />
Note: Solid bars indicate significance at the 5 percent level. One month of schooling is equal to roughly 0.08 standard deviations. MS refers to middle schools.<br />
In stark contrast, five practices—more human capital or<br />
teacher feedback, data-driven instruction, high-dosage<br />
tutoring, increased time on task, and a relentless focus on high<br />
academic expectations—were consistently found in higherachieving<br />
schools. 4 Together, these five practices explain<br />
roughly half the difference in effectiveness between charter<br />
schools.<br />
Controlling for the other four practices, schools that give<br />
formal or informal feedback (more human capital) ten or<br />
more times per semester have annual math gains that are<br />
equal to 0.6 more months of school and annual ELA gains that<br />
are equal to 0.55 more months than other schools. <strong>Schools</strong><br />
that tutor students at least four days a week in groups of six or<br />
fewer have annual ELA gains that are equal to 0.5 more months<br />
than other schools. <strong>Schools</strong> that add 25 percent or more<br />
instructional time to the average New York City traditional<br />
public school’s time have annual math gains that are equal to<br />
0.625 more months than other schools. <strong>Schools</strong> that prioritize<br />
high academic and behavioral expectations for all students<br />
have annual math gains that are equal to 0.55 more months<br />
and ELA gains that are equal to 0.375 more months than those<br />
schools that do not prioritize those expectations. 5<br />
Figure 2 shows the average correlation between inputs and<br />
reading and math effectiveness, measured in additional<br />
months of schooling.<br />
Armed with these correlates of charter school effectiveness,<br />
we cannot simply wait for the expansion of successful charter<br />
schools. At their current rate of growth, it will take more than a<br />
hundred years for high-performing charter schools to educate<br />
every student in the country. For these benefits to reach the<br />
students who need them most, the United States will need to<br />
take the innovations from charter schools that have proven<br />
effective and apply them to the traditional public schools that<br />
serve most students.<br />
Applying the Lessons of <strong>Charter</strong> <strong>Schools</strong> in<br />
Public <strong>Schools</strong><br />
Recent promising—but preliminary—evidence from demonstration<br />
projects in Houston and Denver suggests that these<br />
practices can be transferred from charters to public schools<br />
<strong>The</strong> Hamilton Project • Brookings 11


