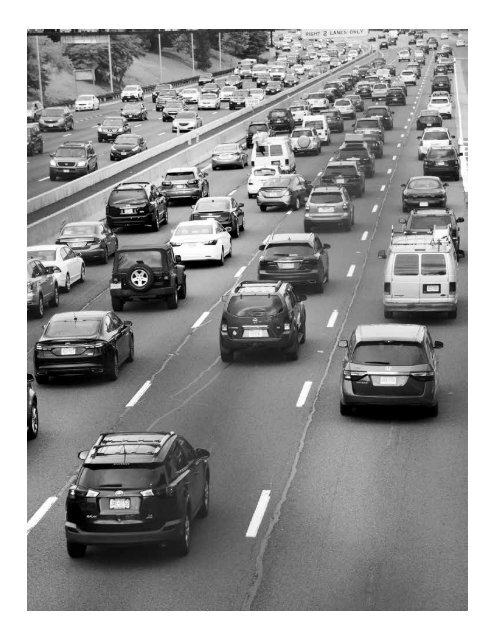
• Older cars that may need repairs make driving less safe and increase pollution for all, as does deferring car maintenance. This problem worsened during the Great Recession, which depressed car sales. As a result, cars on the road are older on average, and older cars emit higher levels <strong>of</strong> harmful emissions (Bishop & Stedman, 2014). • Vehicles without insurance increase costs for all motorists. In 2012, the most recent year for which statistics are available, uninsured motorist claims totaled $2.6 billion, a 75 percent increase from the previous decade. Those costs, largely borne by insurance companies, are passed on to insured drivers in the form <strong>of</strong> higher premiums. Uninsured and underinsured motorist coverage adds roughly 8 percent to an average auto premium for the rest <strong>of</strong> the community (McQueen, 2008; Wiltz, February 20, 2015). • Lack <strong>of</strong> reliable transportation can exacerbate an emergency. When there is an emergency, such as a child being sick or injured, if an ALICE household does not have reliable transportation, their options are poor – forgo treatment and risk the child’s health, rely on friends or neighbors for transportation, or resort to public specialty transit services or even an ambulance, increasing costs for all taxpayers. Providing non-emergency transportation for health care treatment for those without reliable transportation is also expensive, especially in rural areas (Myers, 2015; Hughes-Cromwick & Wallace, 2006). FUTURE TRENDS: TRANSPORTATION FOR ALICE For ALICE households across the country, housing and transportation are tightly linked, and that linkage can have a significant impact on the household budget. People who live in neighborhoods with convenient access to jobs, services, transit, and amenities have lower transportation costs than those who don’t (Center for Neighborhood Technology, 2003-2016). Commuting long distances will only increase in the coming years as lack <strong>of</strong> affordable housing persists and pushes people away from employment centers. Jobs and transportation are also linked. <strong>The</strong> rising trend <strong>of</strong> nonstandard and part-time schedules can complicate transportation for ALICE and poverty-level workers, who may be relying on friends or family for rides or using public transportation. Irregular work schedules can make it difficult to get to work on time, or transportation can become cost-prohibitive on less than a full-time work schedule (Vogtman & Tucker, 2017). Aging transportation contributes to additional costs for ALICE families. Given the size and age <strong>of</strong> the transportation infrastructure and the growing population in many U.S. states, it will be expensive for states to meet the increasing demand for transportation improvements. Tight state budgets make it difficult to maintain public transportation service and low fares. And without investment in roads and bridges, costs will increase for ALICE auto commuters in terms <strong>of</strong> both time spent in transit and wear and tear on their vehicles (American Society <strong>of</strong> Civil Engineers (ASCE), 2013; National Economic Council and the President’s Council <strong>of</strong> Economic Advisers, July 2014). 58 UNITED WAY ALICE REPORT – THE CONSEQUENCES OF INSUFFICIENT HOUSEHOLD INCOME
UNITED WAY ALICE REPORT – THE CONSEQUENCES OF INSUFFICIENT HOUSEHOLD INCOME 59
- Page 1 and 2:
ALICE: THE CONSEQUENCES OF INSUFFIC
- Page 3 and 4:
THE ALICE RESEARCH TEAM The United
- Page 5 and 6:
ALICE: BRINGING HARDSHIP INTO FOCUS
- Page 7 and 8:
TABLE OF CONTENTS INTRODUCTION ....
- Page 9 and 10:
...AND FOR ALL FAMILIES IMPACT ON T
- Page 11 and 12:
• The ALICE Threshold - a bare-mi
- Page 13 and 14: The purpose of this report is to pr
- Page 15 and 16: Figure 3. Monthly Housing Costs and
- Page 17 and 18: In 2014, the U.S. states with the h
- Page 19 and 20: No mother ever envisions finding he
- Page 21 and 22: Long-term effects on health and wel
- Page 23 and 24: friends grew to 7.7 million people
- Page 25 and 26: twice as much as redevelopment of i
- Page 27 and 28: UNITED WAY ALICE REPORT - THE CONSE
- Page 29 and 30: Figure 5. Monthly Child Care Costs
- Page 31 and 32: and accredited child care center fo
- Page 33 and 34: Having a child with special needs h
- Page 35 and 36: The slow progress in national enrol
- Page 37 and 38: Loss of education advancement: Near
- Page 39 and 40: Strategy 8: Drop out of High School
- Page 41 and 42: time students and 76 percent of par
- Page 43 and 44: • Closing the education achieveme
- Page 45 and 46: UNITED WAY ALICE REPORT - THE CONSE
- Page 47 and 48: Figure 7. Monthly Food Costs and Pe
- Page 49 and 50: • For children, lack of sufficien
- Page 51 and 52: Stigma: For many families, using pu
- Page 53 and 54: FUTURE TRENDS: FEEDING ALICE More y
- Page 55 and 56: UNITED WAY ALICE REPORT - THE CONSE
- Page 57 and 58: $26,960 annually (if full time, yea
- Page 59 and 60: Difficulty accessing health care: U
- Page 61 and 62: Despite working full time (and havi
- Page 63: Additional costs of longer commutes
- Page 67 and 68: • Health and financial stability
- Page 69 and 70: of seniors living in poverty have h
- Page 71 and 72: educational consequences of untreat
- Page 73 and 74: survey said cost was the primary re
- Page 75 and 76: had to use their own money or modif
- Page 77 and 78: others, such as caregivers of elder
- Page 79 and 80: the minimum income required to rece
- Page 81 and 82: UNITED WAY ALICE REPORT - THE CONSE
- Page 83 and 84: In the states with the most regress
- Page 85 and 86: children under the age of 18 make u
- Page 87 and 88: UNITED WAY ALICE REPORT - THE CONSE
- Page 89 and 90: • Assistance. Public and nonprofi
- Page 91 and 92: UNITED WAY ALICE REPORT - THE CONSE
- Page 93 and 94: Aron, L., Honberg, R., & Duckworth,
- Page 95 and 96: Carnevale, A., Rose, S., & Cheah, B
- Page 97 and 98: Cunningham, A., & Kienzl, G. (2011)
- Page 99 and 100: Glover, R., Miller, J., & Sadowski,
- Page 101 and 102: Johnson, R. (2015). Housing Costs a
- Page 103 and 104: Mayer, C., & Pence, K. (2008). Subp
- Page 105 and 106: Perez, G. (2016). Latino State of E
- Page 107 and 108: Stetser, M., & Stillwell, R. (2014,
- Page 109 and 110: United Way ALICE Project. (2016). 2