RPR_FY2015_08
You also want an ePaper? Increase the reach of your titles
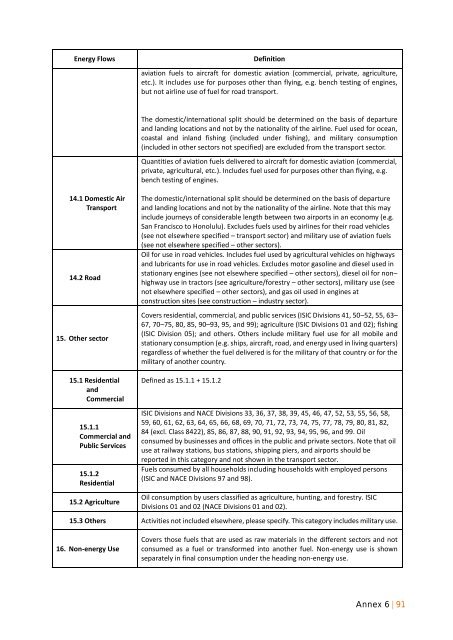
YUMPU automatically turns print PDFs into web optimized ePapers that Google loves.
CO2 emissions from energy consumption (including electricity) per ton<br />
of cement<br />
From an energy efficiency view, the most important indicator is the average<br />
energy consumption per ton of clinker produced. For most countries, the indicator<br />
shows a downward trend in the energy intensity of clinker production between 1990<br />
and 2011 (Figure A3.2). The reason for this downward trend has largely been due to<br />
the shift from wet-process to dry-process cement kilns, coupled with the<br />
replacement of older dry kilns by the latest technology using pre-heaters and precalciners.<br />
Using consistent definitions and boundaries across all countries, it can be<br />
seen that the average energy consumption per ton of clinker in China is currently<br />
about 3.45 GJ per ton whereas the European Union, Canada, and the United States<br />
all use around 3.8–4.0 GJ per ton of clinker.<br />
Figure A3.2 Energy Consumption per Ton of Clinker by Country<br />
Source: IEA (2014), Energy Efficiency Indicators: Essentials for Policy Making. Paris.<br />
Cement companies are investing in low-consumption technologies to be<br />
more competitive as they can reduce energy consumption and thus lower the<br />
production cost. Moreover, legislation in terms of greenhouse gas (GHG) emissions<br />
as well as local pollution often pushes industry to be cleaner and more energyconcerned.<br />
Today’s state-of-the-art dry rotary kilns are fairly fuel efficient, using<br />
around 2.9–3.0 GJ per ton of clinker.<br />
76 | Annex 3


