Etex-AR2017-WEBSITE

Create successful ePaper yourself
Turn your PDF publications into a flip-book with our unique Google optimized e-Paper software.
6.1<br />
Financial report<br />
Consolidated financial statements<br />
<strong>Etex</strong> Annual Report 2017<br />
Financial report<br />
Consolidated financial statements<br />
Explanatory notes<br />
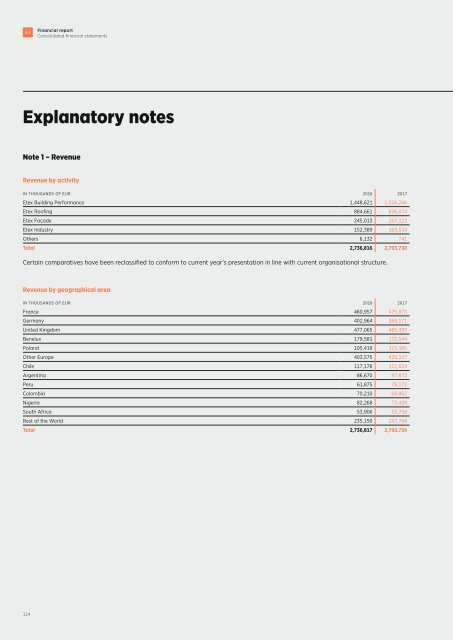
Note 1 – Revenue<br />
Note 2 – Operating charges by nature<br />
Revenue by activity<br />
IN THOUSANDS OF EUR 2016 2017<br />
<strong>Etex</strong> Building Performance 1,448,621 1,526,266<br />
<strong>Etex</strong> Roofing 884,661 836,074<br />
<strong>Etex</strong> Façade 245,013 267,123<br />
<strong>Etex</strong> Industry 152,389 163,534<br />
Others 6,132 741<br />
Total 2,736,816 2,793,738<br />
Certain comparatives have been reclassified to conform to current year’s presentation in line with current organisational structure.<br />
The Group’s major operating charges by function in 2017 are as follows:<br />
IN THOUSANDS OF EUR<br />
PERSONNEL &<br />
TEMPORARY<br />
DEPRECIATION &<br />
IMPAIRMENT<br />
GOODS &<br />
MATERIALS<br />
ENERGY<br />
TRANSPORT &<br />
TRAVEL<br />
Cost of sales -342,110 -125,571 -784,345 -165,031 -249,230 -265,775 -1,932,062<br />
Distribution expenses -223,021 -16,331 - -801 -19,874 -129,281 -389,309<br />
Administrative and general expenses -106,984 -10,113 - -757 -5,296 -62,692 -185,842<br />
Other operating charges -23,751 -1,896 - -146 -2,756 -227 -28,777<br />
Non recurring items -9,587 -9,514 - - - 22,062 2,961<br />
Total -705,453 -163,425 -784,345 -166,736 -277,156 -435,913 -2,533,029<br />
OTHERS<br />
TOTAL<br />
Revenue by geographical area<br />
IN THOUSANDS OF EUR 2016 2017<br />
France 460,957 475,873<br />
Germany 402,964 384,171<br />
United Kingdom 477,065 485,393<br />
Benelux 179,581 172,544<br />
Poland 105,419 115,165<br />
Other Europe 403,575 429,107<br />
Chile 117,178 111,624<br />
Argentina 86,670 97,872<br />
Peru 61,875 78,172<br />
Colombia 70,210 68,862<br />
Nigeria 82,268 73,428<br />
South Africa 53,906 53,758<br />
Rest of the World 235,150 247,768<br />
Total 2,736,817 2,793,738<br />
The Group’s major operating charges by function in 2016 are as follows:<br />
IN THOUSANDS OF EUR<br />
PERSONNEL &<br />
TEMPORARY<br />
DEPRECIATION &<br />
IMPAIRMENT<br />
GOODS &<br />
MATERIALS<br />
IN THOUSANDS OF EUR 2016 2017<br />
Wages and salaries -513,709 -520,098<br />
Social security contributions -109,814 -108,573<br />
Contributions to defined contribution plans -10,354 -13,727<br />
Charges for defined benefit plans (service cost) -7,565 -14,799<br />
Restructuring and termination charges -25,226 -7,281<br />
Other employee benefits expenses -52,428 -40,975<br />
Total employee benefits expenses -719,096 -705,453<br />
ENERGY<br />
TRANSPORT &<br />
TRAVEL<br />
Cost of sales -333,266 -124,909 -718,340 -167,992 -240,871 -316,952 -1,902,330<br />
Distribution expenses -217,414 -17,188 - -890 -19,874 -140,078 -395,444<br />
Administrative and general expenses -100,288 -10,361 - -766 -5,279 -54,381 -171,075<br />
Other operating charges -25,900 -2,386 - -105 -2,433 2,431 -28,392<br />
Non recurring items -42,228 -6,024 - - - -23,708 -71,960<br />
Total -719,096 -160,869 -718,340 -169,752 -268,457 -532,688 -2,569,201<br />
Certain comparatives have been reclassified to conform to current year’s presentation in line with current organisational structure.<br />
The Group’s total personnel expenses, are made up of the following elements:<br />
OTHERS<br />
TOTAL<br />
The number of the Group’s employees is split into the following categories:<br />
2016 2017<br />
Production 8,906 8,824<br />
Sales and marketing 4,124 4,097<br />
Administration and research 1,981 1,589<br />
Average number of personnel 15,011 14,510<br />
114 115