ENERGY Caribbean Yearbook (2013-14)
- No tags were found...
Create successful ePaper yourself
Turn your PDF publications into a flip-book with our unique Google optimized e-Paper software.
Countries<br />
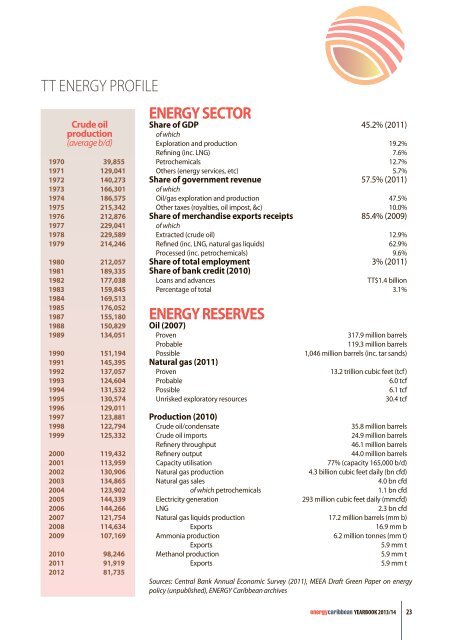
TT energy profile<br />
Crude oil<br />
production<br />
(average b/d)<br />
1970 39,855<br />
1971 129,041<br />
1972 <strong>14</strong>0,273<br />
1973 166,301<br />
1974 186,575<br />
1975 215,342<br />
1976 212,876<br />
1977 229,041<br />
1978 229,589<br />
1979 2<strong>14</strong>,246<br />
1980 212,057<br />
1981 189,335<br />
1982 177,038<br />
1983 159,845<br />
1984 169,513<br />
1985 176,052<br />
1987 155,180<br />
1988 150,829<br />
1989 134,051<br />
1990 151,194<br />
1991 <strong>14</strong>5,395<br />
1992 137,057<br />
1993 124,604<br />
1994 131,532<br />
1995 130,574<br />
1996 129,011<br />
1997 123,881<br />
1998 122,794<br />
1999 125,332<br />
2000 119,432<br />
2001 113,959<br />
2002 130,906<br />
2003 134,865<br />
2004 123,902<br />
2005 <strong>14</strong>4,339<br />
2006 <strong>14</strong>4,266<br />
2007 121,754<br />
2008 1<strong>14</strong>,634<br />
2009 107,169<br />
2010 98,246<br />
2011 91,919<br />
2012 81,735<br />
<strong>ENERGY</strong> SECTOR<br />
Share of GDP 45.2% (2011)<br />
of which<br />
Exploration and production 19.2%<br />
Refining (inc. LNG) 7.6%<br />
Petrochemicals 12.7%<br />
Others (energy services, etc) 5.7%<br />
Share of government revenue 57.5% (2011)<br />
of which<br />
Oil/gas exploration and production 47.5%<br />
Other taxes (royalties, oil impost, &c) 10.0%<br />
Share of merchandise exports receipts 85.4% (2009)<br />
of which<br />
Extracted (crude oil) 12.9%<br />
Refined (inc. LNG, natural gas liquids) 62.9%<br />
Processed (inc. petrochemicals) 9.6%<br />
Share of total employment 3% (2011)<br />
Share of bank credit (2010)<br />
Loans and advances<br />
TT$1.4 billion<br />
Percentage of total 3.1%<br />
<strong>ENERGY</strong> RESERVES<br />
Oil (2007)<br />
Proven<br />
Probable<br />
Possible<br />
Natural gas (2011)<br />
Proven<br />
Probable<br />
Possible<br />
Unrisked exploratory resources<br />
317.9 million barrels<br />
119.3 million barrels<br />
1,046 million barrels (inc. tar sands)<br />
13.2 trillion cubic feet (tcf)<br />
6.0 tcf<br />
6.1 tcf<br />
30.4 tcf<br />
Production (2010)<br />
Crude oil/condensate<br />
35.8 million barrels<br />
Crude oil imports<br />
24.9 million barrels<br />
Refinery throughput<br />
46.1 million barrels<br />
Refinery output<br />
44.0 million barrels<br />
Capacity utilisation<br />
77% (capacity 165,000 b/d)<br />
Natural gas production<br />
4.3 billion cubic feet daily (bn cfd)<br />
Natural gas sales<br />
4.0 bn cfd<br />
of which petrochemicals<br />
1.1 bn cfd<br />
Electricity generation<br />
293 million cubic feet daily (mmcfd)<br />
LNG<br />
2.3 bn cfd<br />
Natural gas liquids production 17.2 million barrels (mm b)<br />
Exports<br />
16.9 mm b<br />
Ammonia production 6.2 million tonnes (mm t)<br />
Exports<br />
5.9 mm t<br />
Methanol production<br />
5.9 mm t<br />
Exports<br />
5.9 mm t<br />
Sources: Central Bank Annual Economic Survey (2011), MEEA Draft Green Paper on energy<br />
policy (unpublished), <strong>ENERGY</strong> <strong>Caribbean</strong> archives<br />
energycaribbean YEARBOOK <strong>2013</strong>/<strong>14</strong><br />
23


