Asian Sky Quarterly 2018Q1 ASQ10 EN
Asian Sky Quarterly 2018Q1 - Falcon 6X
Asian Sky Quarterly 2018Q1 - Falcon 6X

You also want an ePaper? Increase the reach of your titles
YUMPU automatically turns print PDFs into web optimized ePapers that Google loves.
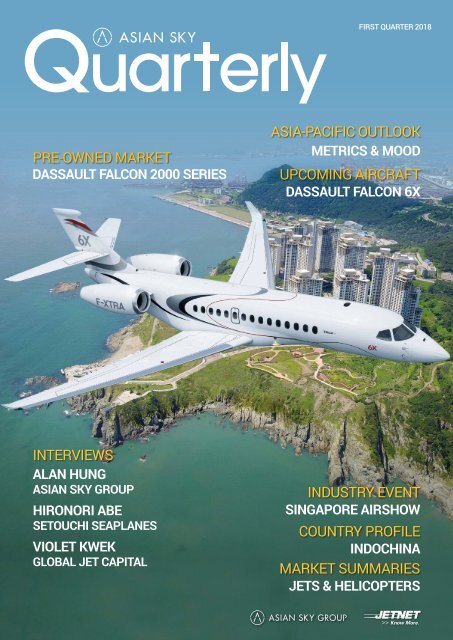
FIRST QUARTER 2018<br />
PRE-OWNED MARKET<br />
DASSAULT FALCON 2000 SERIES<br />
ASIA-PACIFIC OUTLOOK<br />
METRICS & MOOD<br />
UPCOMING AIRCRAFT<br />
DASSAULT FALCON 6X<br />
INTERVIEWS<br />
ALAN HUNG<br />
ASIAN SKY GROUP<br />
HIRONORI ABE<br />
SETOUCHI SEAPLANES<br />
VIOLET KWEK<br />
GLOBAL JET CAPITAL<br />
INDUSTRY EV<strong>EN</strong>T<br />
SINGAPORE AIRSHOW<br />
COUNTRY PROFILE<br />
INDOCHINA<br />
MARKET SUMMARIES<br />
JETS & HELICOPTERS
PUBLISHER’S NOTE<br />
For this quarter’s edition of <strong>Asian</strong> <strong>Sky</strong> <strong>Quarterly</strong>, there seems to be two<br />
stories unfolding. From our “Market Dynamics” section, we are seeing<br />
the market cheer as we move further and further into a seller’s territory<br />
with the percent of the fleet for sale decreasing and prices rising. But<br />
our “Mood & Intentions” survey highlights optimism flattening out and<br />
purchase intention subsequently diminishing.<br />
The latter first. Optimism has flatten out because frankly it couldn’t climb<br />
much higher. It has been on a constant rise since 2Q/3Q 2016 and now<br />
sits at around 90% for most areas in the Asia Pacific region. Optimism<br />
was also overall pulled down by a poor mood in the quarter from<br />
Australia which, as one can see from our “2017Q4 Economics” section,<br />
can be attributed to falling GDP. As to purchase intention, the changes<br />
have only been in the range of 1 – 3% (statistically insignificant?) which<br />
one could therefore simply cast off as being merely a “start of a new<br />
year” pause or fluctuation.<br />
lines, and sellers are hanging on to their aircraft longer waiting for that<br />
better deal i.e. days on market are rising.<br />
Another “right moment’ is the arrival of the Falcon 6X which is on<br />
the covers of this edition of <strong>Asian</strong> <strong>Sky</strong> <strong>Quarterly</strong> and featured as the<br />
“Upcoming Aircraft”. Falcon’s 2000 series of aircraft also gets our<br />
scrutiny in the “Pre-Owned Market Spotlight”. The “Country Profile” this<br />
time is of the Indochina region including Cambodia, Laos, Myanmar &<br />
Vietnam. And, as always, we are featuring a number of interviews, this<br />
time of Hironori Abe from Setouchi Holdings Inc, Violet Kwek from Global<br />
Jet Capital and ASG’s own Alan Hung.<br />
The reason I take such a flippant view of the “Mood & Intentions”<br />
this time is because of the former. As you can see from our “Market<br />
Dynamics” section everything seems to be going right at the moment.<br />
The over supply that existed in the market is getting burned down further<br />
now – good aircraft at good prices are selling – and with less supply,<br />
asking prices are firming up and even increasing. Consequently, we are<br />
moving deeper into seller’s territory, as seen from our “Market Trend”<br />
Sincerely,<br />
Jeffrey C. Lowe<br />
Managing Director, <strong>Asian</strong> <strong>Sky</strong> Group<br />
SPECIAL THANKS TO OUR CONTRIBUTORS:<br />
DHT Aiai<br />
M y ih rec<br />
FIRST QUARTER 2018 — ASIAN SKY QUARTERLY | 1
CONT<strong>EN</strong>TS<br />
04 ECONOMICS<br />
24<br />
06<br />
12<br />
14<br />
18<br />
22<br />
Overview of the Asia-Pacific region’s current status and<br />
specific country’s GDP versus their business jet fleet size.<br />
MOOD & INT<strong>EN</strong>TIONS<br />
Results of the survey on the Asia-Pacific region’s outlook<br />
on current economic status, aircraft utilization, purchase<br />
intentions and influencing factors.<br />
INTERVIEW:<br />
ALAN HUNG, DIRECTOR, BUSINESS DEVELOPM<strong>EN</strong>T<br />
ASIAN SKY GROUP<br />
Discussing his breadth of experience in the aviation<br />
industry and his eagerness to find the best solutions for<br />
clients including transactions, consulting and through<br />
ASG’s media services.<br />
COUNTRY PROFILE - INDOCHINA<br />
Overview and examination of Indochina’s business aviation<br />
industry, its business jet operating environment and<br />
potential for the future.<br />
UPCOMING SPOTLIGHT<br />
DASSAULT FALCON 6X<br />
An introduction to the French manufacturer’s recently<br />
launched 6X, with a first look at its specifications and<br />
capabilities.<br />
INDUSTRY EV<strong>EN</strong>T:<br />
SINGAPORE AIRSHOW REVIEW<br />
An overview of Asia’s largest aerospace and defence show,<br />
held biannually at the Changi Exhibition Centre.<br />
32<br />
35<br />
40<br />
43<br />
56<br />
MARKET DYNAMICS<br />
An in-depth analysis of inventory levels, market trends<br />
and the changing price signals for the business jet and<br />
helicopter fleets in the Asia-Pacific region, given the<br />
continual fluctuations in supply and demand.<br />
INTERVIEW:<br />
HIRONORI ABE, VICE PRESID<strong>EN</strong>T OF AVIATION<br />
COMPANY, SETOUCHI HOLDINGS INC.<br />
Speaking on the company’s use of seaplanes to revitalize<br />
cities, including its newest venture bringing the Kodiak 100<br />
to the Philippines.<br />
PRE-OWNED MARKET SPOTLIGHT<br />
DASSAULT FALCON 2000 SERIES<br />
A comprehensive analysis of the pre-owned Falcon 2000<br />
market.<br />
INTERVIEW:<br />
VIOLET KWEK, SALES DIRECTOR, GREATER CHINA<br />
& NORTH ASIA, GLOBAL JET CAPITAL<br />
Insight into aircraft financing and the benefits of<br />
using a specialized business jet finance company over<br />
traditional banks.<br />
MARKET SUMMARY - JETS<br />
A look at the market performance of featured pre-owned<br />
business jets over the last 12 months.<br />
MARKET SUMMARY - HELICOPTERS<br />
A look at the market performance of featured pre-owned<br />
helicopters over the last 12 months.<br />
PUBLISHER<br />
EDITORIAL<br />
Litalia Yoakum<br />
Iris Zhou<br />
DESIGN<br />
Michael Wong<br />
Aya Leung<br />
MARKET RESEARCH & DATA ANALYSIS<br />
Bowen Zhang<br />
Candice Yue<br />
Casper Zhuang<br />
Enoch Cheung<br />
Jersey Wu<br />
Michelle Shen<br />
Veronica Zhang<br />
The materials and information provided by <strong>Asian</strong> <strong>Sky</strong><br />
Group Limited (“ASG”) in this report is for reference<br />
only. Any information we provide about how we may<br />
interpret the data and market, or how certain issues<br />
may be addressed is provided generally without<br />
considering your specific circumstances. Such<br />
information should not be regarded as a substitute<br />
for professional advice. Independent professional<br />
advice should be sought before taking action on any<br />
matters to which information provided in this report<br />
may be relevant.<br />
ASG shall not be liable for any losses, damage, costs<br />
or expenses howsoever caused, arising directly or<br />
indirectly from the use of or inability to use this report<br />
or use of or reliance upon any information or material<br />
provided in this report or otherwise in connection with<br />
any representation, statement or information on or<br />
contained in this report.<br />
ASG endeavors to ensure that the information<br />
contained in this report is accurate as at the date<br />
of publication, but does not guarantee or warrant<br />
its accuracy or completeness, or accept any liability<br />
of whatever nature for any losses, damage, costs<br />
or expenses howsoever caused, whether arising<br />
directly or indirectly from any error or omission in<br />
compiling such information. This report also uses<br />
third party information not compiled by ASG. ASG<br />
is not responsible for such information and makes<br />
no representation about the accuracy, completeness<br />
or any other aspect of information contained. The<br />
information, data, articles, or resources provided by<br />
any other parties do not in any way signify that ASG<br />
endorses the same.<br />
ADVERTISING/AIRCRAFT SALES <strong>EN</strong>QUIRIES:<br />
sales@asianskygroup.com<br />
<strong>Asian</strong> <strong>Sky</strong> Group<br />
Suite 3905, Far East Finance Centre,<br />
16 Harcourt Road, Admiralty, Hong Kong<br />
Tel: (852) 2235 9222 | Fax: (852) 2528 2766<br />
sales@asianskygroup.com<br />
www.asianskygroup.com<br />
www.asianskymedia.com<br />
2 | ASIAN SKY QUARTERLY — FIRST QUARTER 2018
FIND OUT WHY SMART BUSINESSES ARE<br />
TURNING TO OPERATING LEASES.<br />
找 出 为 什 么 精 明 的 商 家 正 在 转 向 经 营 租 赁 。<br />
An operating lease is a popular financing tool that can provide you with the benefits of a private aircraft<br />
without the traditional risks of aircraft ownership. There are several different options, but in each case you do not take<br />
ownership of the aircraft, but have the full use of it as if you did. Plus instead of a large down payment, you put down a more<br />
modest security deposit and return the aircraft at the end of the lease term to Global Jet Capital.<br />
You can choose to:<br />
· Enter into a sale and leaseback arrangement for your current aircraft<br />
· Identify a new or pre-owned aircraft for us to purchase<br />
· Assign your purchase contracts to us for your new, on-order aircraft<br />
Loan<br />
Balance<br />
Sheet<br />
Assets:<br />
Lease<br />
Allocation of Capital<br />
Lower Residual Value Risk<br />
Predictable Costs<br />
Liabilities:<br />
Off Balance Sheet<br />
Easily adjust to<br />
changing needs<br />
Visit us at ABACE - Booth P224<br />
If you’re thinking about a true operating lease, give us a call at +1 (844) 436-8200.<br />
We’ll get you in the air.<br />
globaljetcapital.com<br />
LEASING & L<strong>EN</strong>DING SOLUTIONS FOR PRIVATE AIRCRAFT
2017Q4 ECONOMICS<br />
Australia<br />
Australia’s GDP growth slipped to 2.4 percent in Q4, falling from<br />
2.8 percent the previous quarter. The household sector, including<br />
consumption and income, were major drivers of the country’s GDP, while<br />
net exports — particularly in rural goods and tourism — contributed to<br />
the drag.<br />
Malaysia<br />
The Southeast <strong>Asian</strong> nation of Malaysia expanded at 5.9 percent<br />
in Q4, compared to 6.2 percent the previous quarter. Services,<br />
manufacturing and the agriculture sectors have been the greatest<br />
contributors on the production side, with all sectors posting growth<br />
except mining and quarrying.<br />
Mainland China<br />
China’s economy grew 6.9 percent in 2017, ending on a positive note.<br />
2017 topped the previous year when growth was 6.7 percent — the<br />
lowest in 26 years. An increase in consumer spending and a rebound<br />
in the property market added to the final quarter’s growth. Signals from<br />
2017 show the country’s growth is moving away from manufacturing<br />
and investment-led growth.<br />
Japan<br />
Japan’s economy ended 2017 on a weaker note because of negative<br />
contribution from net exports, a consequence of a surge in imports<br />
in Q4. Still, the country continued its streak of expansion for now the<br />
eighth consecutive quarter. Overall growth in the October-December<br />
quarter grew at 1.2 percent, revised up from a preliminary reading of<br />
1.0 percent growth.<br />
Hong Kong<br />
Growth in the final quarter of the year expanded 3.4 percent year-onyear<br />
(y/y), for a full-year growth of 3.8 percent up from 2.1 percent in<br />
2016. Growth in private consumption continued at a steady pace of<br />
6.3% on the back of a tight labor market and higher household incomes.<br />
Moving forward, Hong Kong’s growth will likely get a boost from this<br />
year’s expansionary state budget announced in February.<br />
Taiwan<br />
Strong domestic demand and solid export growth led Taiwan’s economy<br />
to expand at the fastest pace in nearly three years in the fourth quarter<br />
of 2017. GDP rose 3.3% annually in Q4, just above Q3’s 3.2% increase,<br />
attributed greatly to the island’s export-driven manufacturing.<br />
South Korea<br />
South Korea’s economy slowed in the fourth quarter of 2017, after<br />
reaching a nearly four-year high in Q3. Preliminary data showed a<br />
3.0 percent deceleration (y/y) in Q4, down from 3.8 percent in Q3.<br />
Overall, the economy expanded 3.1 percent in 2017, higher than 2.8<br />
percent in 2016. Fewer exports and weaker fixed investment slowed<br />
growth, while private and government consumption were positive.<br />
Thailand<br />
Thailand’s economy grew slower than expected in Q4, despite being<br />
its 15th consecutive quarter of growth. The economy expanded by<br />
4.0 percent (y/y) in the last quarter of 2017, driven by tourism and<br />
manufacturing.<br />
India<br />
India’s economy expanded 7.2 percent (y/y) in the last three months of<br />
2017. This was versus a revised growth of 6.5 percent in the previous<br />
quarter and the strongest growth rate since 2016 Q3, which is attributed<br />
to a rise in investments and an increase in public spending.<br />
Philippines<br />
The Philippine economy posted a 6.6 percent GDP growth in Q4,<br />
driving the economy to grow by 6.7 percent for the entire year of 2017.<br />
Manufacturing, trade, real estate, renting and business activities were<br />
the main drivers of growth in the fourth quarter. With the country’s<br />
projected population reaching 105.3 million in the fourth quarter of<br />
2017, per capita GDP and per capita GNI grew by 5.1 percent and 4.7<br />
percent, respectively.<br />
Indonesia<br />
Expanding 5.07 percent (y/y), Indonesia’s economy saw positive signs<br />
in 2017. This growth is the nation’s fastest full-year GDP growth figure<br />
since 2013. The 5.19 percent (y/y) growth for Q4 is also the best Q4<br />
GDP growth since 2013. Household consumption, which generally<br />
accounts for over half of the country’s economic growth, remained low<br />
with a 5 percent mark.<br />
Singapore<br />
Singapore’s economy expanded 3.6 percent in 2017, up from 2.4<br />
percent in 2016. The unemployment rate in the city-state declined,<br />
positively influencing household spending. The Q4 figure was below<br />
the previous quarter’s 5.5 percent growth.<br />
* China's researching area includes Mainland China, Hong Kong, Macau & Taiwan.<br />
4 | ASIAN SKY QUARTERLY — FIRST QUARTER 2018
ECONOMICS<br />
BUSINESS JET FLEET AND GDP BY COUNTRY<br />
Australia<br />
China<br />
Hong Kong<br />
India<br />
Indonesia<br />
Japan<br />
Malaysia<br />
New Zealand<br />
Papua New<br />
Guinea<br />
Philippines<br />
Singapore<br />
South Korea<br />
Taiwan<br />
Thailand<br />
GDP (BILLION USD)*<br />
BUSINESS JET FLEET<br />
CIVIL TURBINE HELICOPTER FLEET<br />
11,061<br />
340<br />
832<br />
9,491<br />
749<br />
647<br />
4,909<br />
5,019<br />
250<br />
608<br />
581<br />
2,426<br />
1,862<br />
1,564<br />
1,306<br />
913<br />
1,452<br />
1,234<br />
916<br />
170<br />
140<br />
114<br />
186<br />
140<br />
139<br />
382<br />
478<br />
558<br />
274<br />
291<br />
511<br />
420<br />
323<br />
300<br />
276<br />
272<br />
191<br />
15<br />
409<br />
332<br />
325<br />
314<br />
308<br />
190<br />
20<br />
55<br />
48<br />
43<br />
39<br />
32<br />
20<br />
16<br />
9<br />
3<br />
56<br />
54<br />
48<br />
46<br />
37<br />
24<br />
21<br />
16<br />
4<br />
272<br />
210<br />
170<br />
136<br />
135<br />
128<br />
95<br />
36<br />
14<br />
1<br />
227<br />
208<br />
162<br />
157<br />
111<br />
104<br />
21<br />
15<br />
6<br />
2013 2014 2015 2016 2017 2013 2014 2015 2016 2017 2013 2014 2015 2016 2017<br />
* 2014, 2015 & 2016 ASG data, historically adjusted using Jetnet fleet yearly increases.<br />
* GDP Source: Tradingeconomics.com<br />
Sponsored by<br />
YEAR <strong>EN</strong>D 2017<br />
YEAR <strong>EN</strong>D 2017<br />
YEAR <strong>EN</strong>D 2017<br />
Asia Pacific Business Jet and Civil Helicopter Fleet Report<br />
Comprehensive coverage and overview of the business jet and civil helicopter<br />
fleet in the Asia-Pacific region, visit www.asianskymedia.com for more!<br />
ASIA PACIFIC REGION<br />
ASIA CIVIL PACIFIC HELICOPTERS REGION<br />
CIVIL HELICOPTERS<br />
Sponsored by<br />
ASIA PACIFIC REGION CIVIL HELICOPTER FLEET REPORT – YEAR <strong>EN</strong>D 2016 I<br />
FIRST QUARTER 2018 — ASIAN SKY QUARTERLY | 5
MOOD & INT<strong>EN</strong>TIONS:<br />
ASIA-PACIFIC REGION SURVEY <strong>2018Q1</strong><br />
In the first quarter of 2018, over 470 respondents participated in ASG’s<br />
survey regarding the mood and intentions of the current business<br />
aviation market.<br />
Regions with the most respondents include:<br />
1. Southeast and Northeast Asia (165 (35%), including Malaysia,<br />
Indonesia, Singapore, Brunei, Philippines, Thailand, Myanmar,<br />
Vietnam, Japan, and South Korea)<br />
2. Central Asia (122 (25%), including India, Pakistan, UAE, etc.)<br />
3. Greater China (113 (24%), including Mainland China, Taiwan,<br />
Hong Kong and Macau)<br />
4. Oceania (52 (11%), including Australia and New Zealand)<br />
TOP 10 RESPOND<strong>EN</strong>T’S LOCATION<br />
Pakistan (7%)<br />
United Arab Emirates (8%)<br />
Singapore (8%)<br />
Malaysia (9%)<br />
Australia (10%)<br />
16+13+12+11+10+9+8+8+7+6+G<br />
95 %<br />
OF TOTAL<br />
RESPOND<strong>EN</strong>TS<br />
Philippines (6%)<br />
China (16%)<br />
Hong Kong (13%)<br />
India (12%)<br />
Indonesia (11%)<br />
Over 70% of the respondents for this quarter’s survey are from aircraft<br />
operators and aircraft services providers (FBO, MRO, etc.) then from aircraft brokers (12%), aircraft end users (5%) and finally respondents from<br />
other related areas.<br />
RESPOND<strong>EN</strong>T LOCATION<br />
RESPOND<strong>EN</strong>T AIRCRAFT TYPE<br />
RESPOND<strong>EN</strong>T CATEGORY<br />
Southeast & Northeast<br />
Asia (32%)<br />
Rest of the<br />
World (4%)<br />
Oceania (11%)<br />
26+24+11+4+35+G<br />
470+<br />
RESPOND<strong>EN</strong>TS<br />
Central Asia (26%)<br />
Greater China (24%)<br />
Turboprop (24%)<br />
Civil Helicopter<br />
(22%)<br />
54+22+24+G 34+33+16+12+5+G<br />
Business Jet (54%)<br />
Aircraft Sales / Charter<br />
Broker (12%)<br />
Other Related<br />
(16%)<br />
Aircraft Owner / Charter<br />
User (5%)<br />
Aircraft Operators<br />
(34%)<br />
Service Providers<br />
(FBO,MRO,etc) (33%)<br />
WHAT IS OUR CURR<strong>EN</strong>T ECONOMIC STATUS?<br />
(QUARTERLY COMPARISON)<br />
Optimistic<br />
(Will get better)<br />
Past Low Point<br />
25%<br />
22%<br />
At Low Point<br />
30%<br />
30%<br />
24%<br />
30%<br />
26%<br />
27%<br />
36%<br />
38%<br />
45%<br />
52%<br />
56%<br />
52%<br />
100%<br />
90%<br />
80%<br />
70%<br />
60%<br />
30%<br />
50%<br />
Pessimistic<br />
(Will get worse)<br />
45%<br />
Not Reached Low Point<br />
48%<br />
46%<br />
47%<br />
34%<br />
35%<br />
27%<br />
34%<br />
21%<br />
32%<br />
15%<br />
34%<br />
10%<br />
37%<br />
11%<br />
40%<br />
30%<br />
20%<br />
10%<br />
0%<br />
2015<br />
Q4<br />
2016<br />
Q1<br />
2016<br />
Q2<br />
2016<br />
Q3<br />
2016<br />
Q4<br />
2017<br />
Q1<br />
2017<br />
Q2<br />
2017<br />
Q3<br />
2017<br />
Q4<br />
2018<br />
Q1<br />
6 | ASIAN SKY QUARTERLY — FIRST QUARTER 2018
MOOD & INT<strong>EN</strong>TIONS: ASIA-PACIFIC REGION SURVEY <strong>2018Q1</strong><br />
OPTIMISM LEVELS SINCE 2016Q1 - REGIONAL DIFFER<strong>EN</strong>CES<br />
Greater China SE & NE Asia Central Asia Oceania<br />
Overall<br />
100%<br />
90%<br />
80%<br />
70%<br />
60%<br />
50%<br />
56%<br />
52%<br />
51%<br />
54%<br />
52%<br />
80%<br />
57%<br />
54%<br />
53%<br />
83%<br />
69%<br />
66%<br />
61%<br />
54%<br />
84%<br />
79%<br />
73%<br />
62%<br />
91%<br />
81%<br />
79%<br />
70%<br />
68%<br />
95%<br />
86%<br />
85%<br />
79%<br />
100%<br />
92% 94%<br />
91%<br />
92%<br />
90%<br />
89%<br />
87% 88%<br />
78%<br />
40%<br />
43%<br />
37%<br />
30%<br />
2016<br />
Q1<br />
2016<br />
Q2<br />
2016<br />
Q3<br />
2016<br />
Q4<br />
2017<br />
Q1<br />
2017<br />
Q2<br />
2017<br />
Q3<br />
2017<br />
Q4<br />
2018<br />
Q1<br />
Signs of pessimistic feelings for the economy have emerged for the first<br />
time since 2016 Q3. This quarter, 52% of respondents believed that the<br />
economy has passed its low point and will improve, which is 4% less<br />
than the previous quarter. The number of respondents who believe the<br />
current economy is at its low point and will get better is 37%, 3% higher<br />
than the previous quarter. Alternatively, 11% of respondents believed<br />
that the economy has not reached its low point and will continue to get<br />
worse, a 1% increase from 2017Q4.<br />
In general, respondents who believe that the current economic situation<br />
has passed its low point or is at its low point can be described as<br />
optimistic. This quarter, 89% of respondents are optimistic that our<br />
economy will improve in the future – a 1% decrease from 2017 Q4 and<br />
the first decline since 2016 Q3.<br />
Central Asia (made up of mainly respondents from India & Pakistan)<br />
showed the highest optimistic level of 94%, while the average for this<br />
quarter was 89%. However, compared to last quarter, this represented<br />
a 6% decline. Greater China was lower than average again this quarter<br />
but still attained a new high of 88%. The optimistic level for Southeast<br />
and Northeast Asia increased by 1% to 92% compared to last quarter.<br />
Oceania, however, endured a 14% decline from the previous quarter,<br />
making it the least optimistic region in The Asia Pacific.<br />
HOW IS YOUR AIRCRAFT UTILIZATION COMPARED TO 12 MONTHS AGO?<br />
100%<br />
90%<br />
80%<br />
Up by 20% and more (>20%)<br />
Up but less than 20% (0 - 20%)<br />
70%<br />
60%<br />
The same (0%)<br />
Increased<br />
50%<br />
40%<br />
30%<br />
20%<br />
Down but less than 20% (-20 - 0%)<br />
Unchanged<br />
10%<br />
0%<br />
2016<br />
Q1<br />
Down by 20% or more (
MOOD & INT<strong>EN</strong>TIONS: ASIA-PACIFIC REGION SURVEY <strong>2018Q1</strong><br />
GREATER CHINA<br />
Improved Aircraft Utilization<br />
AIRCRAFT UTILIZATION:<br />
REGIONAL DIFFER<strong>EN</strong>CES<br />
OPTIMISTIC<br />
39 27 34 37 32 32 47 19 34 34 28 38 29 24 47 18 31 51 22 23 55 21 19 60 182260<br />
PESSIMISTIC<br />
39%<br />
27%<br />
34%<br />
2016<br />
Q1<br />
OCEANIA<br />
37%<br />
32%<br />
32%<br />
2016<br />
Q2<br />
47%<br />
19%<br />
34%<br />
2016<br />
Q3<br />
34%<br />
28%<br />
38%<br />
2016<br />
Q4<br />
29%<br />
24%<br />
2017<br />
Q1<br />
2017<br />
Q2<br />
2017<br />
Q3<br />
2017<br />
Q4<br />
2018<br />
Q1<br />
PESSIMISTIC<br />
25 37 38 42 30 27 46 32 22 38 31 31 31 44 25 23 33 45 25 17 58 21 38 41 301852<br />
Decreased The Same Increased Signal Line*<br />
2016 2016 2016 2016 2017 2017 2017 2017 2018<br />
Q1 Q2 Q3 Q4 Q1 Q2 Q3 Q4 Q1<br />
47%<br />
18%<br />
31%<br />
51%<br />
22%<br />
23%<br />
55%<br />
21%<br />
19%<br />
50 23 37 27 33 26 22 27 17<br />
60%<br />
18%<br />
22%<br />
60%<br />
This quarter, 18% of respondents (-3% since last<br />
quarter, -15% since 2016 Q3) said their aircraft<br />
utilization had decreased, 63% of respondents<br />
said their aircraft utilization had increased,<br />
which is a 2% increase compared to last quarter<br />
and a 29% increase since 2015 Q4.<br />
* An Optimistic-Pessimistic Signal Line has<br />
been added to forecast aircraft usage trends<br />
for the Greater China, Oceania and South<br />
and East Asia regions. An optimistic mood is<br />
derived from more people indicating a ‘higher’<br />
aircraft utilization than 12 months ago, and a<br />
pessimistic mood is derived from more people<br />
indicating ‘lower’ aircraft utilization than 12<br />
months ago.<br />
Greater China<br />
60% (same at 2017 Q4) of respondents<br />
indicated their aircraft utilization in 2018 Q1<br />
increased, with only 18% (21% at 2017 Q4) of<br />
the respondents stating their aircraft utilization<br />
was lower compared to 12 months ago. The<br />
total expected aircraft utilization continued to<br />
increase in 2018 Q1, thus the total utilization<br />
trend continue its upward slope into the<br />
optimistic zone.<br />
Oceania<br />
52% of respondents have indicated their aircraft<br />
utilization increased, 12% higher than 2017<br />
Q4. 30% of respondents believe their aircraft<br />
utilization decreased, 9% higher than 2017 Q4.<br />
Although the aircraft utilization in this region<br />
has continued to increase in 2018 Q1, the trend<br />
for improved aircraft utilization continues to<br />
decrease.<br />
Southeast and Northeast Asia<br />
In 2018 Q1, 61% of respondents recorded<br />
an increased use of their aircraft, which was<br />
the 4th consecutive quarter of the highest<br />
reading in the Asia Pacific region and 2% higher<br />
compared to 2017 Q4. Aircraft utilization in this<br />
area has been increasing since 2017 Q2.<br />
2016<br />
Q1<br />
32 18 36 41 28 35 36 37 48 19 18 56 13 65 14 59 2261<br />
50%<br />
32%<br />
18%<br />
23%<br />
36%<br />
41%<br />
Decreased The Same Increased Signal Line*<br />
Improved Aircraft Utilization<br />
OPTIMISTIC<br />
25%<br />
37%<br />
38%<br />
42%<br />
30%<br />
27%<br />
46%<br />
32%<br />
SOUTHEAST AND NORTHEAST ASIA<br />
22%<br />
Improved Aircraft Utilization<br />
OPTIMISTIC<br />
PESSIMISTIC<br />
Decreased The Same Increased Signal Line*<br />
37%<br />
28%<br />
35%<br />
38%<br />
31%<br />
31%<br />
27%<br />
36%<br />
37%<br />
31%<br />
33%<br />
44%<br />
48%<br />
25%<br />
19%<br />
23%<br />
33%<br />
26%<br />
18%<br />
45%<br />
56%<br />
25%<br />
27%<br />
26%<br />
13%<br />
58%<br />
65%<br />
21%<br />
27%<br />
38%<br />
41%<br />
14%<br />
59%<br />
30%<br />
18%<br />
17%<br />
22%<br />
52%<br />
61%<br />
2016<br />
Q2<br />
2016<br />
Q3<br />
2016<br />
Q4<br />
2017<br />
Q1<br />
2017<br />
Q2<br />
2017<br />
Q3<br />
2017<br />
Q4<br />
2018<br />
Q1<br />
8 | ASIAN SKY QUARTERLY — FIRST QUARTER 2018
MOOD & INT<strong>EN</strong>TIONS: ASIA-PACIFIC REGION SURVEY <strong>2018Q1</strong><br />
SATISFACTION KEY FACTORS:<br />
CHARTER OPERATOR VS. CHARTER BROKER<br />
(OUTER IS BETTER)<br />
Operational<br />
Safety<br />
Charter<br />
Operator<br />
Customer Service<br />
Charter<br />
Broker<br />
Most Satisfied<br />
Operational<br />
Efficiency<br />
DO YOU OR YOUR CLI<strong>EN</strong>T OWN OR CHARTER<br />
A PRIVATE AIRCRAFT?<br />
Just Own (37%)<br />
46+37+17+G<br />
Just Charter (17%) Both Own and Charter (46%)<br />
120+<br />
OF TOTAL<br />
RESPOND<strong>EN</strong>TS<br />
WH<strong>EN</strong> CHARTERING AN AIRCRAFT, WHAT IS<br />
YOUR PRIMARY SOURCE?<br />
Quality of<br />
Maintenance<br />
Quality of<br />
On-board Service<br />
Value for<br />
Money (Price)<br />
14+86+G<br />
Contact Operator (86%) Contact Broker (14%)<br />
In this quarter’s market survey, ASG had over 120 responses from the<br />
Asia-Pacific region regarding the satisfaction factors of charter operators<br />
versus charter brokers.<br />
When asked “Do you or your client own or charter a private aircraft?”, 17%<br />
(same in 2017 Q4) of respondents only charter an aircraft, while 37% (34%<br />
in Q1) just own a private aircraft. The remaining 46% would both own and<br />
charter an aircraft, implying that to charter an aircraft.<br />
When asked their primary source for a charter aircraft, 86% of respondents<br />
would contact a charter operator first.<br />
WHERE ARE WE IN THE CURR<strong>EN</strong>T<br />
PRE-OWNED MARKET?<br />
PURCHASE INT<strong>EN</strong>TION 2016Q1 - <strong>2018Q1</strong>*<br />
2017Q3<br />
2017Q4<br />
<strong>2018Q1</strong><br />
Yes, a new aircraft<br />
Yes, a pre-owned aircraft<br />
No / I’m not sure<br />
49%<br />
58%<br />
56% 54%<br />
59%<br />
39% 40%<br />
23%<br />
36%<br />
29%<br />
26%<br />
21% 21%<br />
2%<br />
4%<br />
10%<br />
22%<br />
20%<br />
48%<br />
43%<br />
30% 29%<br />
28%<br />
22%<br />
25%<br />
19%<br />
23% 19%<br />
22%<br />
41%<br />
32%<br />
27%<br />
41%<br />
38%<br />
33%<br />
31%<br />
29% 28%<br />
Buyer’s Market in<br />
general - High supply,<br />
low demand<br />
Balanced Market in<br />
general - Demand<br />
and Supply are on<br />
the same level<br />
Seller’s Market in general<br />
- High demand,<br />
low supply<br />
I’m not sure 2016 2016 2016 2016 2017<br />
Q1 Q2 Q3 Q4 Q1<br />
2017<br />
Q2<br />
2017<br />
Q3<br />
2017<br />
Q4<br />
2018<br />
Q1<br />
FIRST QUARTER 2018 — ASIAN SKY QUARTERLY | 9
MOOD & INT<strong>EN</strong>TIONS: ASIA-PACIFIC REGION SURVEY <strong>2018Q1</strong><br />
PURCHASE INT<strong>EN</strong>TION - REGIONAL DIFFER<strong>EN</strong>CES (FIXED WING)<br />
Corporate Airliner Large Jet Medium Jet Small Jet Turboprop / Piston Fixed Wing<br />
Central Asia 26% 12% 16% 18%<br />
13%<br />
SE & NE Asia 23% 32% 22%<br />
7%<br />
4%<br />
Oceania 7% 10% 10% 10% 40%<br />
Greater China 17% 15% 13% 8%<br />
18%<br />
PURCHASE INT<strong>EN</strong>TION<br />
Regarding the current pre-owned market, 40% (39% last quarter) of the<br />
respondents believed that the current market is still in a ‘Buyer’s Market’<br />
with low demand and high supply, 29% (36% last quarter) believed that<br />
we are now in a balanced market with equal demand and supply and the<br />
remaining 21% (same last quarter) believed that we have now moved<br />
into a ‘Seller’s Market’ with higher demand and low supply in the market.<br />
Turboprop/Piston<br />
Fixed Wing<br />
(Such as King Air Series)<br />
PURCHASE INT<strong>EN</strong>TION - FIXED WING<br />
(OUTER IS PREFERRED)<br />
Corporate Airliner<br />
(Such as ACJ, BBJ)<br />
Most Preferred<br />
Large Jet<br />
(Such as G650,<br />
Falcon 8X)<br />
In general, “high supply” is regarded as “more than 10% of an aircraft<br />
fleet for sale, where “low supply” is therefore regarded as less than 10%<br />
of the fleet for sale.<br />
Regarding the Purchase intentions in <strong>2018Q1</strong>, demand for new aircraft<br />
continues to be higher than demand for pre-owned aircraft but more<br />
respondents are also unsure of their needs.<br />
Small Jet<br />
(Such as Citation Series, Hawker Series)<br />
Midsize Jet<br />
(Such as G200 & CL650)<br />
Regional differences regarding purchase intent for fixed-wing aircraft<br />
also exist. Turboprops are preferred in Oceania, corporate airliners in<br />
Central Asia, and large jets in Southeast and Northeast Asia. Greater<br />
China sees purchase demand fairly well spread across all aircraft<br />
categories but weighted towards the two top end categories of<br />
corporate airliners and large jets.<br />
PURCHASE DECISIONS - INFLU<strong>EN</strong>CING FACTORS<br />
(OUTER IS LIMITING)*<br />
Greater China Oceania Central Asia SE & NE Asia<br />
Government / Public Opinion<br />
PURCHASE INT<strong>EN</strong>TION - HELICOPTER<br />
(OUTER IS PREFERRED)<br />
Twin Turbine<br />
(Such as Sikorsky S-76C+)<br />
Most Limiting<br />
Most Preferred<br />
No Need<br />
No Interesting Aircraft<br />
Piston Helicopter<br />
(Such as Robinson R22)<br />
Single Turbine Helicopter<br />
(Such as Bell 206)<br />
Price<br />
10 | ASIAN SKY QUARTERLY — FIRST QUARTER 2018
FIRST QUARTER 2018 — ASIAN SKY QUARTERLY | 11
EXPANDING ASG<br />
INTERVIEW WITH ALAN HUNG,<br />
ASIAN SKY GROUP DIRECTOR, BUSINESS DEVELOPM<strong>EN</strong>T<br />
Interview by Litalia Yoakum<br />
In 2018, <strong>Asian</strong> <strong>Sky</strong> Group expanded its team with the addition of Alan Hung, taking on the role<br />
of Director, Business Development. With over 10 years of experience in the industry, Alan will<br />
leverage his extensive experience, wide network and ambitious attitude in supporting ASG’s work<br />
in aircraft sales and acquisitions and consulting.<br />
Tell me about your aviation experience prior<br />
to joining <strong>Asian</strong> <strong>Sky</strong> Group (ASG)?<br />
My aviation journey began in 2001, when I went to Australia to study<br />
Aviation Management at the University of New South Wales Sydney.<br />
At that time, there was no formal Aviation Management course in<br />
Hong Kong. I knew there would be a lot of future opportunities within<br />
the aviation industry, particularly in China and throughout the Asia-<br />
Pacific region. However, in 2004, after I obtained my Bachelor of<br />
Aviation, there was a SARS epidemic in Hong Kong and a downturn<br />
in the global aviation industry. Considering both, it was a tough time<br />
to look for opportunities.<br />
In 2005, I started my first aviation job in Hong Kong, as an Aircraft<br />
Dispatch and Station Control Officer where I learned flight planning<br />
and other technical skills in commercial aviation. After about a year,<br />
the business aviation industry in Hong Kong began to develop. An<br />
opportunity came along to move into the Operations Department as a<br />
Flight Dispatcher. During my five years in Flight Operations, I worked<br />
on and dispatched aircraft for most of the major OEMs, including<br />
Boeing Business Jets, Gulfstream and Bombardier.<br />
I then decided to further develop my career and pursue a sales role,<br />
taking on the role of Sales and Key Account Manager and, later, moved<br />
to Aircraft Management Sales Manager. In 2015, I saw more demand<br />
for maintenance services. As our customer’s aircraft started to go out<br />
of warranty, I began to promote an independent maintenance program<br />
and to help customers better understand resale value.<br />
I now see great opportunities in helping customers buy and sell<br />
their aircraft. In early 2018, I joined ASG and now have the chance to<br />
assist clients with their business aviation needs, including aircraft<br />
sales and acquisitions.<br />
How has the industry evolved since you<br />
started out?<br />
The business jet fleet in Hong Kong has grown to over 130, while<br />
Mainland China’s has grown to approximately 345 business jets. With<br />
the growth of the fleet and more business jet movements in the region,<br />
several different industry segments have changed.<br />
10 years ago, there was no landing slot and parking limitation in<br />
the Hong Kong International Airport. Now, with the increase in<br />
movements, operators have difficulties obtaining slots and are faced<br />
with restrictions on landing and parking. This is due to the lack of<br />
slots, amid rising passenger traffic, but also the priority of commercial<br />
aviation over business aviation. On the maintenance side, things<br />
are much better than where they were 10 years ago. OEMs and<br />
maintenance providers are now looking at the Asia-Pacific region as a<br />
place to set-up their facilities. Bombardier opened their Tianjin facility<br />
in early 2017 and several other providers have targeted the region as<br />
the place to be.<br />
The industry has also seen many aircraft management companies<br />
pop up. Clients now have multiple choices, along with competitive<br />
pricing. What was considered an added value services before, such<br />
as maintenance services, charter brokerage services and aircraft<br />
brokerage, is now the standard, which reflects the clients changing<br />
and more mature attitude toward the market.<br />
In terms of aircraft sales, the pre-owned market has become more<br />
active. Typically, pre-owned aircraft don’t come with a warranty, which<br />
is now okay for buyers because maintenance providers are moving<br />
into the region making maintaining out of warranty aircraft more<br />
feasible and economical.<br />
12 | ASIAN SKY QUARTERLY — FIRST QUARTER 2018
INDUSTRY INSIDER<br />
You will be taking on the role of Director,<br />
Business Development. What area are you<br />
covering and what services are you offering<br />
to clients?<br />
As the new Director, Business Development, I will be offering a<br />
wide-range of services: assistance in aircraft transactions, aviation<br />
consulting and media and marketing solutions. I’m covering the Asia-<br />
Pacific region and strongly focusing on the Greater China market.<br />
What are some of the latest business jet<br />
trends you’ve seen Greater China?<br />
In the last 10 years, the market has quickly evolved. We are now<br />
seeing successful sales in the super-midsize and large cabin<br />
categories. When I started out, most customers were buying brand<br />
new aircraft, without financing. Owners are now more open to<br />
considering pre-owned business jets and they’re willing to finance<br />
through various means.<br />
Additionally, the industry — in Mainland China — is now supported by<br />
the Chinese Government’s aim to have over 500 general airports in<br />
the country in the next few years. With this, the demand for business<br />
aviation will be higher and the industry will see even more pre-owned<br />
activity and more financing options.<br />
Today, there is a lot of competition. The market will see the introduction<br />
of Gulfsteam’s G500 and G600 and has just witnessed the unveiling of<br />
the Falcon 6X. Offering long range and large cabin space, these aircraft<br />
will be very welcome in the Greater China region.<br />
How can ASG help potential clients looking to<br />
buy/sell an aircraft in this region?<br />
Collectively, the ASG team has a wide-range of professional experience<br />
in all facets of the industry. Our team is very international and can help<br />
clients in multiple languages, in any location, with any requirement.<br />
We also have great support from our shareholder companies Seacor,<br />
and Avion Pacific along with ASG’s strategic partner Avpro, whose own<br />
network and resources we often utilize.<br />
The market will see the<br />
introduction of Gulfsteam’s<br />
G500 and G600 and has just<br />
witnessed the unveiling of the<br />
Falcon 6X. Offering long ranges<br />
and large cabin space, these<br />
aircraft will be very welcome<br />
into Greater China.<br />
<strong>Asian</strong> <strong>Sky</strong> Media, ASG’s new media division focusing on publications<br />
and marketing services, has been resourceful for ASG’s aircraft<br />
sales and acquisition requirements too. Through its marketing<br />
services. we’re able to reach an extensive and precise database.<br />
ASG’s market intelligence, which is visible through the portfolio of<br />
<strong>Asian</strong> <strong>Sky</strong> Media’s reports, is another key factor in helping clients<br />
achieve their needs. When a request for an aircraft comes in, ASG’s<br />
team of analysts are soon hard at work, helping the client to fully<br />
understand the status of the market and the position of their aircraft<br />
in the market.<br />
What are you hoping to achieve in your new<br />
role with ASG?<br />
With the support of the ASG team, I hope we can bring the company’s<br />
service standards to the next level. ASG is already such a recognized<br />
company in the Asia-Pacific region, I hope to attain even more<br />
recognition and now on a global scale.<br />
On a personal level, I hope to successfully complete my first aircraft<br />
sales transaction in 2018. This is something I feel confident in,<br />
particularly after seeing the resources at hand within ASG. It’d also be<br />
great to assist companies looking to expand their presence into the<br />
region through our portfolio of media and marketing services.<br />
www.asianskygroup.com<br />
FIRST QUARTER 2018 — ASIAN SKY QUARTERLY | 13
INDOCHINA<br />
(VIETNAM, CAMBODIA, LAOS, MYANMAR)<br />
BUSINESS AVIATION PROFILE<br />
by Litalia Yoakum<br />
The Southeast <strong>Asian</strong> nations of Vietnam, Cambodia, Laos and<br />
Myanmar make up part of what is often referred to as Indochina,<br />
or the Indochina Peninsula. Each of these countries reflect cultural<br />
influences from their bordering neighbours of India and Mainland China,<br />
through language and cuisine, in addition to reflecting more Western<br />
influences stemming from European colonialism. While Mainland China is<br />
most often noted in the Asia-Pacific business aviation industry for its growth<br />
and potential, Indochina should be seen as a market of the future.<br />
14 | ASIAN SKY QUARTERLY — FIRST QUARTER 2018
COUNTRY PROFILE: INDOCHINA<br />
CAMBODIA<br />
Located in the southern portion of the Indochina Peninsula, Cambodia<br />
has experienced rapid economic growth in the last decade, stimulated<br />
by tourism, construction, textiles and agriculture. While the country still<br />
faces several challenges to reach the economic status of its neighbors<br />
(Thailand and Vietnam), Cambodia’s aviation industry is being driven<br />
by rising tourism activities.<br />
Cambodia’s Ministry of Tourism reported in 2016 that the sector<br />
generated US$3.4B of economic activity, supported by over five<br />
million international visitors. Tourism levels are expected to increase<br />
in coming years. The primary entry points into Cambodia are the<br />
country’s main international airports: Phnom Penh International, Siem<br />
Reap International and Sihanoukville International.<br />
Currently these airports are only dedicated to commercial aviation.<br />
Still, Cambodia is base to two business jets, both of which are operated<br />
by Tag Aviation and both of which are Gulfstreams, a G200 and a<br />
G450. Cambodia was home to a G550 in 2016, which later changed<br />
its based to the US.<br />
Like surrounding countries, the civil turbine helicopter fleet is much<br />
larger in Cambodia than its business jet fleet. At yearend 2017, there<br />
were nine helicopters in the country most of which were used in multimission<br />
roles. The single-engine is the most popular model, which is<br />
often utilized for charter and tourism purposes.<br />
LAOS<br />
As the only landlocked country of Southeast Asia, Laos is often<br />
overshadowed by its neighbors but still attracts a considerable number<br />
of tourists every year who are intrigued by its undeveloped landscape.<br />
While Laos is likely the least mature business aviation market in the<br />
Southeast Asia region with no business jets based in the country, there<br />
are still several outside operators that offer chartered flights in and<br />
Helicopter Fleet Age Distribution - Indochina*<br />
out. Facilities used are those shared with and more often utilized for<br />
commercial aviation.<br />
The lack of infrastructure in all sectors, including aviation and<br />
tourism, is at the root of the country’s underdevelopment. The Laos<br />
Government is now encouraging and attempting to attract FDIs, in<br />
hopes of further development.<br />
Similar to the rest of the region, Laos’ civil turbine helicopter fleet is<br />
more active with 10 helicopters. These are made up of mostly singleengine<br />
helicopters, used for charter and search and rescue.<br />
MYANMAR<br />
Formerly known as Burma, Myanmar is a country rich in natural<br />
resources. While it remains one of the poorest countries in Asia,<br />
Myanmar has initiated a series of economic reforms to attract foreign<br />
investment, which has the potential to trigger a demand for business<br />
aviation and supporting infrastructure.<br />
The country’s business jet fleet stands at zero. Myanmar was previously<br />
base to a Bombardier Challenger 800, operated by China-based aircraft<br />
management company Astro Air. The 800 has since relocated to China.<br />
Although there are currently no business jets based in the country,<br />
there has been an increased interest in travel to the country.<br />
Consequently, several companies offer charter services. Supporting<br />
charter in and out of Myanmar is Thailand-based MJets, which has an<br />
FBO located in Yangon — the country’s capital city. MJets Myanmar<br />
Business Aviation Centre (MMBAC) offers ground handling services<br />
and a private jet terminal, complete with onsite customs, immigration<br />
and quarantine services.<br />
Myanmar is much more active in the civil helicopter market. At yearend<br />
2017, Myanmar’s civil turbine helicopter fleet stood at 17, an increase<br />
of 21.4% from 2016. While the majority are used to support offshore oil<br />
and gas operations, a growing number are used in the multi-mission<br />
segment and for charter use.<br />
Helicopter Fleet Mission Breakdown by Country<br />
9<br />
8<br />
7<br />
6<br />
40<br />
35<br />
30<br />
25<br />
34<br />
5<br />
4<br />
20<br />
15<br />
17<br />
3<br />
10 9<br />
10<br />
2<br />
5<br />
1<br />
0<br />
0<br />
Cambodia<br />
Laos Myanmar Vietnam<br />
1979<br />
1982<br />
1987<br />
1989<br />
1990<br />
1991<br />
1992<br />
1993<br />
1994<br />
2000<br />
2001<br />
2002<br />
2003<br />
2004<br />
2005<br />
2007<br />
2008<br />
2009<br />
2010<br />
2011<br />
2012<br />
2013<br />
2014<br />
2015<br />
2016<br />
*Researched area of Indochina includes: Vietnam, Laos, Cambodia & Myanmar<br />
Training<br />
Private<br />
Multi-Mission<br />
Corporate<br />
Offshore<br />
Charter<br />
FIRST QUARTER 2018 — ASIAN SKY QUARTERLY | 15
VIETNAM<br />
Occupying the eastern portion of the Indochina Peninsula, Vietnam is<br />
the largest — in terms of population — of the four countries. With over<br />
96M inhabitants, the country also boasts the strongest economy, with<br />
much of its growth attributed to agriculture and manufacturing, while<br />
foreign direct investments (FDI) are picking up from multinational<br />
companies, as well as small to medium-sized enterprises.<br />
Helicopter Fleet Breakdown by OEM,<br />
Model and Country<br />
Cambodia<br />
Laos<br />
Myanmar<br />
Vietnam<br />
According to the Wealth Report 2017 — released by global property<br />
consultancy Knight Frank LLP — the number of ultra-high net worth<br />
individuals (UHNWIs), defined as those with wealth of at least<br />
US$30M, in Vietnam has increased by 320 percent since 2006; the<br />
fastest growth in the world. This is expected to increase even more<br />
by 2026, when the number of UHNWIs is forecast to be 540; a 170<br />
percent increase from that of today.<br />
The growing number of enterprises in the country, paired with its rising<br />
wealthy class, are now triggering an increase in travel. Statistics from<br />
the Civil Aviation Administration of Vietnam show air passenger traffic<br />
has risen immensely from 2015 to 2016. In 2016, passenger traffic<br />
reached more than 52 million, up 29% from 2015. Forecasts expect<br />
both international and domestic travel to grow.<br />
“While the number of airliner aircraft [and traffic] in a country doesn’t<br />
equate directly to the opportunities for business jet acquisitions<br />
[and activity], it does demonstrate an increased willingness of the<br />
population to travel and an increased level of disposable income<br />
for them to be able to do so,” says DHT Aviation, a Vietnam-based<br />
ground handler.<br />
“There are zero business jets owned or operated in the Vietnam<br />
currently,” explains DHT Aviation. “The country, however, operates<br />
business turboprops, with the current fleet including two Beechcraft<br />
King Airs.<br />
Airbus<br />
Guimbal<br />
Leonardo<br />
Russian<br />
Helicopters<br />
Sikorsky<br />
AS332L2 4<br />
AS355 1<br />
AS365 2<br />
H120 3<br />
H125 3 6 2 6<br />
H130 2 1<br />
H135 1<br />
H155 2 2<br />
H225 1<br />
Cabri G2<br />
AW139 3<br />
AW189<br />
Mi-17<br />
Mi-171<br />
Mi-8 1 1<br />
S-76C 1<br />
S-76C++ 5<br />
Total 7 10 16 32<br />
16 | ASIAN SKY QUARTERLY — FIRST QUARTER 2018
COUNTRY PROFILE: INDOCHINA<br />
The country’s business aviation industry also faces the challenge of<br />
competing with commercial aviation, when it comes to infrastructure.<br />
DHT Aviation explains that parking slots and ground handling providers<br />
also work with commercial aircraft, with most resources going to<br />
those rather than business and/or general aviation.<br />
Additionally, there are no FBOs in Vietnam so if top government officials,<br />
or others require security and privacy, they need to utilise a VIP lounge<br />
in the terminal which would then be unavailable for other passengers.<br />
Operating a general aviation aircraft in Vietnam is equally as difficult.<br />
DHT Aviation cites licensing fees, ownership registration and<br />
approvals from the Ministry of National Defense, as challenges. As<br />
far as maintenance, operators and owners must seek maintenance<br />
providers in Hong Kong or Singapore for quality maintenance work.<br />
While Vietnam’s business jet fleet sits at zero, it’s civil turbine helicopter<br />
fleet is relatively active. With 31 civil helicopters as of yearend 2017,<br />
most active in Vietnam is for offshore oil and gas operations. The most<br />
popular size category in the country is the heavy-size, often used in<br />
the offshore segment. However, the country’s most popular model in<br />
2017 was Russian Helicopters’ medium-sized twin-turbine — the Mi-8.<br />
In both the helicopter and business jet segments, there is a lot of room<br />
to grow. The question stands as to how quickly this can happen.<br />
“We expect a slow growth from business aviation in Vietnam, as<br />
most Vietnam HNWIs do not eye foreign markets, but only domestic<br />
markets” says DHT Aviation. “This will prevent them from purchasing<br />
their own business jet, due to a limited travel demand.”<br />
DHT Aviation further explained the perception of a business jet within<br />
the country is still skewed, with many preferring not to attract public<br />
attention which a purchase would bring.<br />
Even with the market needing more information on the benefits of<br />
business aviation, the industry is still doing what it can to support<br />
future growth. DHT Aviation for instance is proposing a plan for<br />
a business jet-dedicated terminal and it foresees an increased in<br />
business jet charter to and from surrounding countries.<br />
GDP - Cambodia, Laos & Myanmar<br />
Foreign Direct Investment<br />
Cambodia<br />
Laos<br />
Myanmar<br />
Cambodia<br />
Laos<br />
Myanmar<br />
120<br />
4.5<br />
GDP (Billions, Current USD)<br />
100<br />
80<br />
60<br />
40<br />
20<br />
0<br />
GDP<br />
250 14<br />
200<br />
150<br />
100<br />
50<br />
12<br />
10<br />
8<br />
6<br />
4<br />
2<br />
0<br />
2000<br />
2001<br />
2002<br />
2003<br />
2004<br />
2005<br />
2007<br />
2008<br />
2009<br />
2010<br />
2011<br />
2012<br />
2013<br />
2014<br />
2015<br />
2016<br />
FDI (Billions, USD)<br />
4.0<br />
3.5<br />
3.0<br />
2.5<br />
2.0<br />
1.5<br />
1.0<br />
0.5<br />
0<br />
2000<br />
2001<br />
2002<br />
2003<br />
2004<br />
2005<br />
2007<br />
2008<br />
2009<br />
2010<br />
2011<br />
2012<br />
2013<br />
2014<br />
2015<br />
2016<br />
2000<br />
2001<br />
2002<br />
2003<br />
2004<br />
2005<br />
2007<br />
2008<br />
2009<br />
2010<br />
2011<br />
2012<br />
2013<br />
2014<br />
2015<br />
2016<br />
Vietnam’s GDP & Foreign Direct Investment<br />
FDI<br />
GDP (Billions, Current USD)<br />
FDI (Billions, USD)<br />
Data Source: <strong>Asian</strong> <strong>Sky</strong> Group & the World Bank Group<br />
FIRST QUARTER 2018 — ASIAN SKY QUARTERLY | 17
UPCOMING AIRCRAFT<br />
DASSAULT FALCON 6X<br />
Dassault Falcon is the recognized global brand for Dassault business<br />
jets which are designed, manufactured and supported by Dassault<br />
Aviation and Dassault Falcon Jet Corp. Adding to its family of jets, the<br />
French manufacturer announced the addition of the Falcon 6X — the<br />
most spacious, advanced and versatile twinjet in business aviation —<br />
at the end of February 2018. The new 5,500NM jet will make its first<br />
flight in early 2021 and begin deliveries in 2022.<br />
The latest model replaces the Falcon 5X, a cancelled project due to<br />
delays in its Silvercrest engines. Powering the Falcon 6X is Pratt &<br />
Whitney Canada’s PurePower ® PW812D engines, capable of producing<br />
13,000-14,000 lbs of thrust. Equipped with a low maintenance<br />
single piece fan and emission reducing Talon combustor, the<br />
PurePower PW800 engines offer the highest efficiency, reliability and<br />
maintainability in the 10,000-20,000 lb class. Setting a new “green”<br />
engine standard for emissions, the engine’s low-noise design and<br />
low-vibration levels contribute to reducing cabin noise for a more<br />
comfortable passenger experience.<br />
With a maximum capability of flying directly from Beijing to San<br />
Francisco or Moscow to Singapore, the 6X has a top speed of Mach<br />
0.90 and a maximum range of 5,500NM. At its long-range cruise<br />
speed of Mach 0.85, the 6X can also connect Paris to Beijing or Los<br />
Angeles to London.<br />
SPECS<br />
AT A GLANCE<br />
HIGHLIGHTS<br />
Range<br />
Seating<br />
Cabin Volume (excluding cockpit and baggage)<br />
Engine Thrust<br />
MMO<br />
Maximum Takeoff Weight<br />
Maximum Zero Fuel Weight<br />
5,500 N.M<br />
12 - 16<br />
1,843 cu.ft<br />
0.90 Mach<br />
51,000 ft<br />
77,460 lb<br />
45,920 lb<br />
• The tallest and widest cabin in any purpose-built business jet<br />
• 3,900 feet cabin altitude cruising at 41,000 feet<br />
• Natural light with 31 larger windows<br />
• Easy control of cabin management and entertainment functions<br />
• Advanced EASy III avionics flight deck<br />
• Pratt & Whitney PW812D engine - best-in-class availability<br />
• PurePower Service Plan<br />
THE ULTIMATE CABIN EXPERI<strong>EN</strong>CE. EXPANDED.<br />
The Falcon 6X cabin is simply the tallest and widest in any purpose<br />
built business jet. It gives you more personal space to sit or stand. More<br />
room for areas of privacy and relaxation as well as common areas where<br />
teams can meet and confer. The 6X cabin is the ultimate in flexible living<br />
and working space, providing a level of comfort that will help you go far<br />
and accomplish more.<br />
18 | ASIAN SKY QUARTERLY — FIRST QUARTER 2018
UPCOMING AIRCRAFT<br />
DIM<strong>EN</strong>SIONS<br />
25.94 M / 85.1 ft<br />
WINGSPAN<br />
CROSS SECTION<br />
7.47 M / 24.6 ft<br />
HEIGHT<br />
THE B<strong>EN</strong>EFITS OF NATURAL LIGHT<br />
25.68 M /84.3 ft<br />
L<strong>EN</strong>GTH<br />
2.58 M / 8 ft 5 in<br />
1.98 M / 6 ft 6 in<br />
• Configurable seating designs<br />
2.18 M / 7 ft 2 in<br />
Natural light improves the view, elevates your mood and enlarges your perspective.<br />
The 31 new and larger windows on the Falcon 6X provide unbeatable luminosity.<br />
And their tight spacing provides panoramic views.<br />
The Falcon 6X also has the first ever <strong>Sky</strong>light in an aircraft, providing valuable light<br />
to the entrance and galley areas.<br />
RANGE MAP - FROM HONG KONG<br />
Moscow<br />
New York<br />
Dubai<br />
From Hong Kong<br />
Lagos<br />
Sao Paulo<br />
Sydney<br />
6X unreached range from Hong Kong<br />
• performance may be affected by real aircraft configuration (outfitting options, operating items) and by ATC routing and weather conditions, 8 passengers, Mach .80,<br />
85% Wind reliability, NBAA IFR Reserves<br />
FIRST QUARTER 2018 — ASIAN SKY QUARTERLY | 19
The Falcon 6X can now land with much more fuel than most competing<br />
aircraft, allowing operators to make short stops at interim airports<br />
without having to refuel. Additionally, the twinjet is certified for steep<br />
approaches attributed to its new generation and ultra-efficient wings,<br />
which optimize landing on short runways with difficult approaches.<br />
Dassault Aviation’s own in-house Design Studio. Significantly more<br />
natural light floods into the cabin thanks to 30 extra-large windows<br />
including a unique galley skylight – the first in business aviation –<br />
designed to provide additional brightness in an area usually devoid<br />
of natural light.<br />
With one of the largest cabins of its class, passengers can travel on<br />
the 6X in comfort and style. The aircraft’s cabin is six feet, six inches<br />
(1.98 m) high and 8 feet 6 inches (2.58 m) wide — the highest and<br />
widest cross section in a purpose-built business jet – and is nearly 40<br />
feet 8 inches (12.3 m) long. It can accommodate up to 16 passengers<br />
in three distinct lounge areas, with room for multiple configurations<br />
including a large entry way/crew rest area and a spacious rear lounge.<br />
Every element of the cabin’s design has been meticulously rethought,<br />
the result of an extensive survey of customer tastes and inputs from<br />
While the most attractive highlights of the 6X include its range and<br />
cabin size, 6X owners and operators can also enjoy the extensive global<br />
support network backed by Dassault Aviation. Reduced maintenance<br />
costs, thanks to Dassault’s FalconCare program, not only allows for<br />
budget predictability but provides extended maintenance intervals.<br />
With service centers on six continents, including authorized service<br />
facilities in Beijing, Shanghai, Hong Kong and Singapore, there is now<br />
more support than ever before.<br />
www.dassaultfalcon.com<br />
20 | ASIAN SKY QUARTERLY — FIRST QUARTER 2018
SAVE THE DATE FOR ASIA’S MOST<br />
IMPORTANT BUSINESS AVIATION EV<strong>EN</strong>T<br />
Join thousands of top business aviation leaders, entrepreneurs,<br />
and other aircraft-purchase decision makers for the <strong>Asian</strong><br />
Business Aviation Conference & Exhibition (ABACE2019)<br />
in Shanghai. Save the date and visit the ABACE website<br />
to learn more.<br />
LEARN MORE | www.abace.aero/2019<br />
FIRST QUARTER 2018 — ASIAN SKY QUARTERLY | 21
SINGAPORE AIRSHOW<br />
ASIA’S LARGEST AEROSPACE AND<br />
DEF<strong>EN</strong>CE SHOW<br />
The Singapore Airshow, deemed Asia’s largest aerospace and defence exhibitions, was<br />
held in early February at Singapore’s Changi Exhibition Centre.<br />
Connecting the global aviation industry, 1,062 companies from 50<br />
countries participated in this year’s event, featuring representatives<br />
from Airbus, Bell Helicopter, Boeing, Bombardier, Embraer, Israel<br />
Aerospace Industries (IAI), Pratt & Whitney, Rolls-Royce, ST<br />
Engineering, Thales and UTC Aerospace Systems.<br />
“The biennial Singapore Airshow plays a vital role in supporting the<br />
aviation ecosystem in Singapore and Asia Pacific upon which so many<br />
skilled jobs depend on,” said ICF International Principal, Richard Brown.<br />
“It’s the place for current and potential customers and suppliers to<br />
meet, network, do business and evaluate new opportunities together.<br />
It’s also a great showcase for new technologies and important to<br />
encourage the next generation of aviation talent to seek employment<br />
in aviation. By focusing on next generation technologies, encouraging<br />
start-ups to exhibit for the first time and promoting the capabilities<br />
and offerings around Southeast Asia and beyond, the show provides a<br />
time-efficient way to develop new business.”<br />
2018 saw an increase in trade visitors, as well as 287 VIP delegations,<br />
with over 70 percent of exhibitors committing to a return in 2020.<br />
Making its unwavering commitment to the Asia-Pacific’s aviation<br />
industry, more than 100 companies were featured at the US pavilion,<br />
making it the largest US presence ever at the Singapore Airshow.<br />
The show concluded its trade segment (Feb 6-9) on an optimistic<br />
note, with strong commendations of the wide-range of opportunities<br />
to connect stakeholders, disruptive technologies to drive change and<br />
unique interaction platforms to shape the future.<br />
Strategic partnerships established at the Airshow saw discussions<br />
and showcases around digital data revolution to drive intelligence<br />
across the entire value-chain of the aviation industry. Examples<br />
include Airbus’ <strong>Sky</strong>wise Predictive Maintenance Services enabling<br />
open aviation data platforms for full aircraft data and advanced<br />
predictive analytics and Rolls-Royce’s IntelligenceEngine, an allencompassing<br />
digital strategy which represents a paradigm shift in<br />
the way it designs, produces and supports propulsion systems.<br />
Bringing together ground-breaking aerospace and defence<br />
technologies, the What’s Next? showcase saw an in-depth exchange<br />
between start-ups pitching new technologies and innovations to<br />
potential investors.<br />
22 | ASIAN SKY QUARTERLY — FIRST QUARTER 2018
INDUSTRY EV<strong>EN</strong>T<br />
With the rise of disruptive and innovative technologies, visitor<br />
experience was greatly enhanced at this year’s show. The use of<br />
innovative technologies allowed exhibitors to provide an immersive<br />
experience for visitors of all ages to engage and interact with the<br />
exhibits through 3-D simulations, virtual reality and augmented reality,<br />
in addition to the existing physical mock-ups.<br />
Visitors to the Airshow were treated to the exhilarating aerobatics<br />
of the flying display performances including those of the Republic<br />
of Singapore Air Force (RSAF)’s integrated aerial display team,<br />
comprising of an F-15SG, along with two F-16Cs fighter jets. Other<br />
displays included the Indonesia Air Force (TNI-AU) Jupiter Aerobatic<br />
Team’s KT-1B, the U.S. Air Force (USAF)’s F-16 and B-52 Stratofortress,<br />
the Sukhoi Su-30MKM from the Royal Malaysian Air Force (RMAF),<br />
and Royal Thai Air Force (RTAF)’s JAS-39 C/D Gripen, which made<br />
their first appearances in Singapore.<br />
Over at the Static Aircraft Display Area, visitors were given<br />
opportunities to get up-close and personal with the wide range of<br />
commercial and military aircraft.<br />
Over at the Static Aircraft<br />
Display Area, visitors were given<br />
opportunities to get up-close and<br />
personal with the wide range of<br />
commercial and military aircraft.<br />
The F-35B Lightning II — the world’s first supersonic short takeoff/<br />
vertical landing (STOVL) stealth aircraft, made an appearance at an<br />
Airshow in Asia for the first time. There were also a range of business<br />
and commercial aircraft which appeared for the first time at an<br />
Airshow in Asia. Among them were the Gulfstream G500 and G600<br />
aircraft, Textron Aviation’s Cessna Citation Longitude, and Embraer’s<br />
fourth prototype of a next-generation narrow-body jet – the E-190<br />
E2 prototype. Nicknamed the “profit hunter”, the prototype features a<br />
tiger’s face painted on its nose in a nod to Embraer’s respect for Asia.<br />
Additionally, the HondaJet, the fastest, highest-flying, quietest, and most<br />
fuel-efficient jet in its class, made its debut at the Singapore Airshow.<br />
“We are heartened to see the overwhelming support and interest in<br />
the sixth edition of the Singapore Airshow, as it draws in exhibitors<br />
and visitors alike from all around the world. This goes to show that<br />
Singapore is an aviation hub not only to the industry, but also aviation<br />
fans around the globe,” said Mr Leck Chet Lam, Managing Director of<br />
Experia Events, organisers of Singapore Airshow.<br />
Singapore Airshow 2020 will be held from 11 to 16 February at Changi<br />
Exhibition Centre.<br />
www.singaporeairshow.com<br />
FIRST QUARTER 2018 — ASIAN SKY QUARTERLY | 23
MARKET DYNAMICS<br />
PRE-OWNED BUSINESS JETS FOR SALE<br />
INV<strong>EN</strong>TORY VALUE (USD) 1<br />
$7,910M<br />
WORLDWIDE<br />
$6,101M<br />
DEC 2017<br />
$5,760M<br />
$1,281M<br />
ASIA PACIFIC<br />
$1,164M<br />
DEC 2017<br />
$1,041M<br />
Mar<br />
2016<br />
Apr<br />
May<br />
Jun<br />
Jul<br />
Aug<br />
Sep<br />
Oct<br />
Nov<br />
Dec<br />
Jan<br />
2017<br />
Feb<br />
Mar<br />
Apr<br />
May<br />
Jun<br />
Jul<br />
Aug<br />
Sep<br />
Oct<br />
Nov<br />
Dec<br />
Jan<br />
2018<br />
Feb<br />
Mar<br />
The Inventory Value Line represents the number of aircraft actively being marketed for sale in USD terms. 2<br />
The Trend Line represents the market’s direction in terms of the balance between sellers and buyers (supply and<br />
demand) at today’s price levels. A rising Trend Line indicates that pre-owned activity is stabilizing, with sellers of<br />
aircraft increasingly likely to find buyers.<br />
The Signal Line represents an indication of where the market’s direction may be heading in the future. A Signal<br />
Line consistently falling below the Trend Line indicates that any improvement in the market’s direction may not be<br />
entirely sustainable.<br />
MARKET TR<strong>EN</strong>D 1<br />
WORLDWIDE<br />
TR<strong>EN</strong>D REVERSAL<br />
MOVING TOWARDS SELLER’S MARKET<br />
MOVING TOWARDS BUYER’S MARKET<br />
TR<strong>EN</strong>D<br />
IMPROVEM<strong>EN</strong>T<br />
TR<strong>EN</strong>D<br />
IMPROVEM<strong>EN</strong>T<br />
AIRCRAFT SOLD 1<br />
WORLDWIDE<br />
24<br />
26<br />
20<br />
35<br />
32<br />
23<br />
30<br />
28<br />
32<br />
21<br />
25<br />
25 25<br />
22<br />
36<br />
30<br />
24<br />
37<br />
28<br />
34<br />
30<br />
32<br />
23<br />
21<br />
11<br />
Mar<br />
2016<br />
Apr<br />
May<br />
Jun<br />
Jul<br />
Aug<br />
Sep<br />
Oct<br />
Nov<br />
Dec<br />
Jan<br />
2017<br />
Feb<br />
Mar<br />
Apr<br />
May<br />
Jun<br />
Jul<br />
Aug<br />
Sep<br />
Oct<br />
Nov<br />
Dec<br />
Jan<br />
2018<br />
Feb<br />
Mar<br />
1 The historical inventory value and transactions are subject to change based on latest market information updates.<br />
2 ASG’s Inventory Value line is calculated by taking the total number of aircraft for sale from a selection of 26 different models, multiplied by their average asking prices.<br />
24 | ASIAN SKY QUARTERLY — FIRST QUARTER 2018<br />
Source: JETNET & ASG
MARKET DYNAMICS<br />
AVERAGE ASKING PRICE<br />
MILLION USD<br />
25<br />
24<br />
23<br />
ASIA PACIFIC<br />
22<br />
21<br />
20<br />
WORLDWIDE<br />
19<br />
18<br />
Mar<br />
16<br />
May<br />
16<br />
Jul<br />
16<br />
Sep<br />
16<br />
Nov<br />
16<br />
Jan<br />
17<br />
Mar<br />
17<br />
May<br />
17<br />
Jul<br />
17<br />
Sep<br />
17<br />
Nov<br />
17<br />
Jan<br />
18<br />
Mar<br />
18<br />
% OF FLEET FOR SALE<br />
14%<br />
13%<br />
12%<br />
11%<br />
ASIA PACIFIC<br />
10%<br />
9%<br />
WORLDWIDE<br />
8%<br />
7%<br />
6%<br />
Mar<br />
16<br />
May<br />
16<br />
Jul<br />
16<br />
Sep<br />
16<br />
Nov<br />
16<br />
Jan<br />
17<br />
Mar<br />
17<br />
May<br />
17<br />
Jul<br />
17<br />
Sep<br />
17<br />
Nov<br />
17<br />
Jan<br />
18<br />
Mar<br />
18<br />
AVERAGE DAYS ON MARKET<br />
520<br />
470<br />
420<br />
ASIA PACIFIC<br />
370<br />
320<br />
270<br />
WORLDWIDE<br />
220<br />
Mar<br />
16<br />
May<br />
16<br />
Jul<br />
16<br />
Sep<br />
16<br />
Nov<br />
16<br />
Jan<br />
17<br />
Mar<br />
17<br />
May<br />
17<br />
Jul<br />
17<br />
Sep<br />
17<br />
Nov<br />
17<br />
Jan<br />
18<br />
Mar<br />
18<br />
Source: JETNET & ASG<br />
FIRST QUARTER 2018 — ASIAN SKY QUARTERLY | 25
MARKET DYNAMICS<br />
SUPPLY / DEMAND INDICATORS<br />
BUSINESS JETS<br />
2018 Q1<br />
SUPPLY VS. DEMAND RATIO<br />
AVERAGE DAYS ON MARKET<br />
SUPPLY ><br />
DEMAND<br />
% OF FLEET<br />
FOR SALE<br />
MODEL<br />
DAYS ON MARKET<br />
25.0%<br />
9.9%<br />
AIRBUS<br />
ACJ318<br />
ACJ319<br />
NO TRANSACTIONS<br />
13.4%<br />
17.4%<br />
BOEING<br />
BBJ<br />
BBJ2<br />
AVERAGE<br />
8.8%<br />
5.2%<br />
14.5%<br />
6.4%<br />
BOMBARDIER<br />
CL604<br />
CL605<br />
CL850<br />
GL5000<br />
5.8%<br />
GL6000<br />
7.5%<br />
7.3%<br />
24.1%<br />
EMBRAER<br />
L600<br />
L650<br />
L1000<br />
NO TRANSACTIONS<br />
NO TRANSACTIONS<br />
2.3%<br />
2.9%<br />
13.2%<br />
F2000LX<br />
F2000LXS<br />
F2000S<br />
AVERAGE<br />
8.0%<br />
4.2%<br />
9.3%<br />
8.3%<br />
6.5%<br />
13.0%<br />
1.9%<br />
5.9%<br />
3.5%<br />
3.5%<br />
DASSAULT<br />
GULFSTREAM<br />
F7X<br />
F900DX<br />
F900EX<br />
F900EXe<br />
F900LX<br />
G200<br />
G280<br />
G450<br />
G550<br />
G650<br />
NO TRANSACTIONS<br />
5.8%<br />
G650ER<br />
400% 300% 200% 100%<br />
0<br />
Average AC for sale / Total sold in last 12 months<br />
7.1%<br />
Average<br />
0 200 400 600 800 1000<br />
The above chart reflects where certain aircraft models are positioned<br />
in terms of supply and demand (based on a ratio of completed<br />
transactions compared to the number of sellers and the average<br />
number of days on the market for a transaction to take place).<br />
These indications do not necessarily mean that prices will be higher in<br />
the future, but it does indicate that sellers of these particular models<br />
are more likely to find willing buyers in a shorter period of time than the<br />
overall average.<br />
For some model types, given the market indicators shown on the<br />
previous page, the stabilization in pre-owned asking prices and<br />
decline in inventory level appear to have stimulated increased<br />
demand, leading to an increase in transactions and a more balanced<br />
state of supply and demand.<br />
This can be seen most with certain Gulfstream (G200, G450, G550,<br />
G650) and Bombardier models (Challenger 604/605 & Global 6000)<br />
where more transactions are occurring relative to the number for<br />
sale, and transactions are requiring less time on the market for<br />
sellers to complete.<br />
26 | ASIAN SKY QUARTERLY — FIRST QUARTER 2018<br />
Source: JETNET & ASG
MARKET DYNAMICS<br />
MARKET POSITIONING<br />
BUSINESS JETS<br />
MOVING TOWARDS<br />
BUYER’S MARKET<br />
Balanced<br />
Supply & Demand<br />
MOVING TOWARDS<br />
SELLER’S MARKET<br />
AIRBUS<br />
BOEING<br />
ACJ318<br />
ACJ319<br />
BBJ 1<br />
BBJ 2<br />
CL604<br />
BOMBARDIER<br />
CL605<br />
CL850<br />
GL5000<br />
GL6000<br />
EMBRAER<br />
L600<br />
L650<br />
L1000<br />
F2000LX<br />
F2000LXS<br />
F2000S<br />
DASSAULT<br />
F7X<br />
F900DX<br />
F900EX<br />
F900EXe<br />
F900LX<br />
G200<br />
GULFSTREAM<br />
G280<br />
G450<br />
G550<br />
G650<br />
G650ER<br />
The above chart provides a visual representation of the Supply /<br />
Demand Ratio of each aircraft model relative to the overall market,<br />
and is based on a ‘Marketability’ calculation for each particular model<br />
including the following four market indicators:<br />
1. The percentage of aircraft for sale relative to its fleet size.<br />
2. The number of aircraft sold relative to the average number for sale.<br />
3. The average days for sale relative to the overall market average.<br />
4. The momentum of the marketplace (represented by the trend<br />
towards supply and demand market equilibrium portrayed earlier).<br />
When taking into account these four factors, the Bombardier Challenger<br />
605, the Falcon 2000 class and the various Gulfstream models appear<br />
well positioned to find buyers available.<br />
* ASG chose 26 popular aircraft models as described in this report<br />
Source: JETNET & ASG<br />
FIRST QUARTER 2018 — ASIAN SKY QUARTERLY | 27
MARKET DYNAMICS<br />
PRE-OWNED CIVIL HELICOPTERS FOR SALE<br />
INV<strong>EN</strong>TORY VALUE (USD) 1<br />
$1,410M<br />
WORLDWIDE<br />
$1,477M<br />
DEC 2017<br />
$1,053M<br />
ASIA PACIFIC<br />
$111M<br />
$181M<br />
DEC 2017<br />
$160M<br />
Mar<br />
2016<br />
Apr<br />
May<br />
Jun<br />
Jul<br />
Aug<br />
Sep<br />
Oct<br />
Nov<br />
Dec<br />
Jan<br />
2017<br />
Feb<br />
Mar<br />
Apr<br />
May<br />
Jun<br />
Jul<br />
Aug<br />
Sep<br />
Oct<br />
Nov<br />
Dec<br />
Jan<br />
2018<br />
Feb<br />
Mar<br />
The Inventory Value Line represents the number of aircraft actively being marketed for sale in USD terms. 2<br />
The Trend Line represents the market’s direction in terms of the balance between sellers and buyers (supply and<br />
demand) at today’s price levels. A rising Trend Line indicates that pre-owned activity is stabilizing, with sellers of<br />
aircraft increasingly likely to find buyers.<br />
The Signal Line represents an indication of where the market’s direction may be heading in the future. A Signal<br />
Line consistently falling below the Trend Line indicates that any improvement in the market’s direction may not be<br />
entirely sustainable.<br />
MARKET TR<strong>EN</strong>D 1<br />
WORLDWIDE<br />
TR<strong>EN</strong>D<br />
IMPROVEM<strong>EN</strong>T<br />
MOVING TOWARDS SELLER’S MARKET<br />
MOVING TOWARDS BUYER’S MARKET<br />
TR<strong>EN</strong>D<br />
WORS<strong>EN</strong>ING<br />
TR<strong>EN</strong>D<br />
WORS<strong>EN</strong>ING<br />
TR<strong>EN</strong>D<br />
IMPROVEM<strong>EN</strong>T<br />
AIRCRAFT SOLD 1<br />
WORLDWIDE<br />
7<br />
4<br />
5<br />
7<br />
10<br />
6<br />
10<br />
8<br />
7 7 7<br />
10 10<br />
9 9<br />
7 7<br />
7 7<br />
6<br />
4<br />
2<br />
1<br />
12<br />
7<br />
Mar<br />
2016<br />
Apr<br />
May<br />
Jun<br />
Jul<br />
Aug<br />
Sep<br />
Oct<br />
Nov<br />
Dec<br />
Jan<br />
2017<br />
Feb<br />
Mar<br />
Apr<br />
May<br />
Jun<br />
Jul<br />
Aug<br />
Sep<br />
Oct<br />
Nov<br />
Dec<br />
Jan<br />
2018<br />
Feb<br />
Mar<br />
1 The historical inventory value and transactions are subject to change based on latest market information updates.<br />
2 ASG’s Inventory Value line is calculated by taking the total number of aircraft for sale from a selection of 16 different models, multiplied by their average asking prices.<br />
28 | ASIAN SKY QUARTERLY — FIRST QUARTER 2018<br />
Source: JETNET & ASG
MARKET DYNAMICS<br />
AVERAGE ASKING PRICE<br />
MILLION USD<br />
7<br />
6.5<br />
6<br />
ASIA PACIFIC<br />
5.5<br />
5.0<br />
WORLDWIDE<br />
4.5<br />
4<br />
Mar<br />
16<br />
May<br />
16<br />
Jul<br />
16<br />
Sep<br />
16<br />
Nov<br />
16<br />
Jan<br />
17<br />
Mar<br />
17<br />
May<br />
17<br />
Jul<br />
17<br />
Sep<br />
17<br />
Nov<br />
17<br />
Jan<br />
18<br />
Mar<br />
18<br />
% OF FLEET FOR SALE<br />
7.5%<br />
7.0%<br />
6.5%<br />
6.0%<br />
WORLDWIDE<br />
5.5%<br />
5.0%<br />
4.5%<br />
4.0%<br />
ASIA PACIFIC<br />
3.5%<br />
3.0%<br />
Mar<br />
16<br />
May<br />
16<br />
Jul<br />
16<br />
Sep<br />
16<br />
Nov<br />
16<br />
Jan<br />
17<br />
Mar<br />
17<br />
May<br />
17<br />
Jul<br />
17<br />
Sep<br />
17<br />
Nov<br />
17<br />
Jan<br />
18<br />
Mar<br />
18<br />
AVERAGE DAYS ON MARKET<br />
650<br />
600<br />
550<br />
ASIA PACIFIC<br />
500<br />
450<br />
400<br />
WORLDWIDE<br />
350<br />
Mar<br />
16<br />
May<br />
16<br />
Jul<br />
16<br />
Sep<br />
16<br />
Nov<br />
16<br />
Jan<br />
17<br />
Mar<br />
17<br />
May<br />
17<br />
Jul<br />
17<br />
Sep<br />
17<br />
Nov<br />
17<br />
Jan<br />
18<br />
Mar<br />
18<br />
Source: JETNET & ASG<br />
FIRST QUARTER 2018 — ASIAN SKY QUARTERLY | 29
MARKET DYNAMICS<br />
SUPPLY / DEMAND INDICATORS<br />
CIVIL HELICOPTERS<br />
2018 Q1<br />
SUPPLY VS. DEMAND RATIO<br />
AVERAGE DAYS ON MARKET<br />
SUPPLY ><br />
DEMAND<br />
% OF FLEET<br />
FOR SALE<br />
MODEL<br />
DAYS ON MARKET<br />
18.6%<br />
S76C+<br />
12.4%<br />
SIKORSKY<br />
S76C++<br />
3.2%<br />
S92A<br />
AVERAGE<br />
5.3%<br />
4.9%<br />
5.1%<br />
BELL HELICOPTER<br />
BELL 412EP<br />
BELL 412HP<br />
BELL 429<br />
AVERAGE<br />
14.7%<br />
AW109E PWR<br />
5.2%<br />
LEONARDO<br />
AW109SP GN<br />
3.5%<br />
AW139<br />
NO<br />
TRANSACTIONS<br />
4.5%<br />
AS332L1<br />
9.0%<br />
H225<br />
NO<br />
TRANSACTIONS<br />
7.2%<br />
4.2%<br />
1.0%<br />
AIRBUS HELICOPTERS<br />
EC135P2<br />
EC135T2<br />
EC145<br />
NO<br />
TRANSACTIONS<br />
28.6%<br />
EC155B<br />
8.4%<br />
H155<br />
350% 300% 250% 200% 150% 100% 50% 0<br />
Average AC for sale / Total sold in last 12 months<br />
6.0%<br />
Average<br />
0 100 200 300 400 500 600 700 800<br />
The above chart reflects where certain aircraft models are positioned in terms of supply and demand (based on a ration of completed transactions<br />
compared to the number of sellers, and average number of days on the market for a transaction to take place).<br />
30 | ASIAN SKY QUARTERLY — FIRST QUARTER 2018<br />
Source: JETNET & ASG
MARKET DYNAMICS<br />
MARKET POSITIONING<br />
CIVIL HELICOPTERS<br />
MOVING TOWARDS<br />
BUYER’S MARKET<br />
Balanced<br />
Supply & Demand<br />
MOVING TOWARDS<br />
SELLER’S MARKET<br />
S76C+<br />
SIKORSKY<br />
S76C++<br />
S92A<br />
BELL HELICOPTER<br />
BELL 412EP<br />
BELL 412HP<br />
BELL 429<br />
AW109E PWR<br />
LEONARDO<br />
AW109SP GN<br />
AW139<br />
AS332L1<br />
H225<br />
AIRBUS HELICOPTERS<br />
EC135P2<br />
EC135T2<br />
EC145<br />
EC155B<br />
H155<br />
The above chart provides a visual representation of the Supply / Demand Ratio of each aircraft model relative to the overall market, resulting in a<br />
‘Marketability’ calculation of each particular model based on the following four market indicators:<br />
1. The percentage of aircraft for sale relative to its fleet size.<br />
2. The number of aircraft sold relative to the average number for sale.<br />
3. The average days for sale relative to the overall market average.<br />
4. The momentum of the marketplace (represented by the trend towards supply and demand market equilibrium portrayed earlier).<br />
Source: JETNET & ASG<br />
FIRST QUARTER 2018 — ASIAN SKY QUARTERLY | 31
REVITALIZING CITIES<br />
WITH SEAPLANES<br />
INTERVIEW WITH HIRONORI ABE<br />
VICE PRESID<strong>EN</strong>T OF AVIATION COMPANY,<br />
SETOUCHI HOLDINGS INC.<br />
Interview by Litalia Yoakum<br />
The Japanese prefecture of Hiroshima, located along the Seto Inland Sea, is known<br />
for its natural beauty made up of mountainous landscape, sprawling valleys and<br />
a vast coastline. Hiroshima’s rich history dates back for centuries, and is home<br />
to a fascinating culture. Over the years, however, the prefecture lost many of its local citizens to burgeoning outside regions.<br />
To revitalize Hiroshima, Japanese firm Setouchi Holdings — subsidiary of shipbuilding company Tsuneishi Group, stepped in.<br />
The company, started by Tsuneishi Group’s owner Katsushige Kambara, aimed to revive the prefecture through tourism and,<br />
consequently, through the introduction of Setouchi Seaplanes, bringing convenient transportation and infrastructure to an<br />
overlooked, yet picturesque, region.<br />
Setouchi Holdings is focused on aviation with three business<br />
segments — as owner of the US-based aircraft manufacturer Quest<br />
Aircraft (which builds the Kodiak 100), as a sales dealer for the Kodiak<br />
throughout much of the Asia-Pacific region, and as an operator of the<br />
Kodiak 100 seaplane by means of Setouchi Seaplanes. The Kodiak<br />
100 sits at the forefront of Setouchi Holdings’ plans to invigorate the<br />
Hiroshima prefecture.<br />
The Kodiak 100 is built in Sandpoint, Idaho in the northwestern<br />
region of the United States. Originally designed to be the ultimate<br />
humanitarian workhouse, the unique combination of robust<br />
construction and remarkable payload capability has resulted in many<br />
additional applications for the Kodiak, including float (amphibious<br />
and straight) operations, special missions, medevac, skydiving and<br />
more. The owner-flown segment continues to gain momentum<br />
as well, particularly in the North American marketplace. The<br />
Kodiak’s rugged aluminum construction combines superior STOL<br />
performance and high useful load. It offers proven turbine reliability<br />
with the Pratt & Whitney PT6 turbine engine, has the ability to land<br />
and take off from unimproved surfaces and is capable of working off<br />
floats without structural upgrades. The Kodiak can take off in under<br />
1,000 feet at its full gross takeoff weight of 7,255 lbs and climb at<br />
over 1,300 feet per minute.<br />
Setouchi Seaplanes, based at the Onomichi Floating Port in the city of<br />
Onomichi, has been operating this amphibious Kodiaks since August<br />
2016, making the Kodiak the first seaplane to be in service in Japan<br />
in over 50 years. To date, there are twelve Kodiak 100s in Japan, used<br />
for various missions. Due to the success of the amphibious aircraft,<br />
Setouchi Seaplanes has since targeted the Philippines.<br />
32 | ASIAN SKY QUARTERLY — FIRST QUARTER 2018
INDUSTRY INSIGHTS<br />
“We currently have one seaplane in the Philippines,” says Hironori<br />
Abe, Setouchi Holdings’ Vice President, who is leading the company’s<br />
expansion into the country. “We are working with a local partner who<br />
already has an air operator’s certificate (AOC). The main headquarter<br />
will be based in Manila, with additional operations in Battan, Subic<br />
and Palawan.”<br />
The geographic layout of the Philippines, home to over 7,000 islands,<br />
makes the seaplane an ideal aircraft. Abe expects tourism, cargo<br />
and passenger transport to be the main mission segments across<br />
the islands, which are currently faced with infrastructure difficulties,<br />
making transport challenging.<br />
In 2018, Setouchi Holdings will add maintenance capabilities to their<br />
repertoire. And, by 2019, it will be operating a training center for the<br />
Kodiak, continuing to focus on promoting the Kodiak within the Asia-<br />
Pacific region and Filipino community.<br />
Where we bring transportation,<br />
further infrastructure is also<br />
implemented. There will be the<br />
development of boats, hotels,<br />
and tourism, in general.<br />
“My projection is at least 10 to 15 aircraft in the next year in the<br />
Philippines,” says Abe. “The current single aircraft in country has a lot<br />
of usage and there is already infrastructure in place with numerous<br />
runway strips in the country, making this a feasible goal.”<br />
Outside of the Philippines, Setouchi Holdings Seaplanes has targeted<br />
the Maldives, Sri Lanka and India, as well as the growing Mainland<br />
China market. “In Mainland China, the Kodiak 100 is represented by<br />
a different dealer distributor. Still, there are about 10 to 12 seaplanes<br />
in the country, with growing interest in this aircraft.”<br />
The Kodiak 100’s efficiency and versatility, combined with low<br />
operating costs, has made it appealing to operators across the Asia-<br />
Pacific region.<br />
In each country Setouchi Holdings expands to, Abe hopes to<br />
help revitalize the area, just as it has done for Japan’s Hiroshima<br />
prefecture. “Aviation is not only aviation, but it is also transportation,”<br />
explains Abe. “Where we bring transportation, further infrastructure<br />
is also implemented. There will be the development of boats, hotels,<br />
and tourism, in general.”<br />
Having already accomplished a success story with seaplanes in<br />
Hiroshima, the future for Setouchi Holdings and its seaplanes<br />
looks bright.<br />
www.setouchi-hd.com/about/aviation<br />
FIRST QUARTER 2018 — ASIAN SKY QUARTERLY | 33
KODIAK 100 SPEC<br />
WEIGHTS & LOADINGS<br />
FUSELAGE<br />
Max Ramp Weight<br />
3,313 kg<br />
Max Takeoff Weight<br />
3,290 kg<br />
Base Aircraft Empty Weight<br />
1,710 kg<br />
Base Aircraft Useful Load<br />
1,603 kg<br />
Fuel Capacity<br />
1,211 L<br />
Max Wing Loading<br />
147 kg/sm<br />
Max Power Loading<br />
4.93 kg/hp<br />
PERFORMANCE (WITHOUT CARGO POD)<br />
Stall Speed Vs1 (flaps up)<br />
143 kph<br />
Stall Speed Vs0 (flaps down)<br />
111 kph<br />
Rate of Climb (max cont at SL)<br />
418 m/min<br />
Rate of Climb (10,000 ft)<br />
266 m/min<br />
Takeoff Ground Roll<br />
285 m<br />
Landing Ground Roll<br />
233 m<br />
Certified Ceiling<br />
7,620 m<br />
RANGE & <strong>EN</strong>DURANCE<br />
7,305 lbs<br />
7,255 lbs<br />
3,770 lbs<br />
3,535 lbs<br />
320 gal<br />
30.2 lbs/ft2<br />
9.67 lbs/hp<br />
77 kcas<br />
60 kcas<br />
1,371 ft/min<br />
874 ft/min<br />
934 ft<br />
765 ft<br />
25,000 ft<br />
Cabin Width<br />
Cabin Height<br />
Cabin Length<br />
Cargo Volume<br />
Overall Length<br />
Seats<br />
Doors<br />
Door Sill Height<br />
Cargo Door Height<br />
Cargo Door Width<br />
FLIGHT SURFACES<br />
Wing Area<br />
Span<br />
Dihedral<br />
Flap Type<br />
Horizontal Span<br />
Overall Height<br />
1.37 m 4’6”<br />
1.45 m 4’9”<br />
4.83 m 15’ 10”<br />
7.02 cu m 248 ft2<br />
10.42 m 34’2”<br />
1-10 1-10<br />
3<br />
3<br />
0.97 m 38”<br />
1.25 m 49.25”<br />
1.25 m 49.25”<br />
22.30 sq m<br />
13.72 m<br />
3°<br />
Fowler, single-slotted<br />
6.09 m<br />
4.65 m<br />
Includes 45 min reserve, ISA, without cargo pod Max Cruise<br />
174 ktas, 3,700 m<br />
Fuel Flow<br />
Endurance<br />
Max Range Cruise<br />
135 ktas, 3,700 m<br />
Fuel Flow<br />
Endurance<br />
Max Endurance<br />
95 ktas, 3,700 m<br />
Fuel Flow<br />
Endurance<br />
1,861 km<br />
182 L/hr<br />
5.8 hrs<br />
2,096 km<br />
125 L/hr<br />
8.4 hrs<br />
1,748 km<br />
106 L/hr<br />
9.9 hrs<br />
LANDING GEAR<br />
Main Gear<br />
8.5 x 10 Cleveland, spring steel<br />
Nose Gear<br />
6.5 x 8 Cleveland, air-oleo, steel<br />
POWERPLANT (P&W PT6A-34)<br />
Takeoff Power<br />
750 hp<br />
Max Continuous power<br />
700 hp
PRE-OWNED MARKET SPOTLIGHT<br />
FALCON 2000 SERIES<br />
One of the most popular and successful Falcons to date is the Falcon<br />
2000 series, with more than 600 of the series in service today. Cost<br />
effective and capable, each variation has built on the original model’s<br />
many strengths. After entering the market in 1995, the series has<br />
evolved to include the Falcon 2000EX, DX, LX, S and LXS.<br />
FIRST QUARTER 2018 — ASIAN SKY QUARTERLY | 35
PRE-OWNED SPOTLIGHT<br />
MODEL INTRODUCTION<br />
Theoriginal twin-engine 2000 introduced in 1995 is based on and<br />
slightly smaller than the three-engine Falcon 900, which itself was<br />
introduced in 1986. The 2000 offered a transcontinental range of<br />
3,000NM, powered by CFE738-1-1B turbofans. The 2000’s large cabin<br />
has remained the same throughout its evolution, maintaining a cabin<br />
volume of 1,024 cubic feet (excluding cockpit and baggage), a cabin<br />
length of 26.17ft, along with a height of 74 in and width of 92 in.<br />
In 2004, the 2000EX entered service powered by — what is now<br />
the standard engine in the series — the Pratt & Whitney PW308C<br />
turbofans. The EX’s range was slightly longer with a range of 3,900NM.<br />
Both the 2000 and its EX variant utilized Rockwell Collins Pro Line 4<br />
avionics system. This system was upgraded with the addition of the<br />
2000EX EASy, which used Honeywell’s Enhanced Avionics System<br />
(EASy), allowing for improved navigation and communication.<br />
The 2000LX entered the market in 2007. Able to fly a max range<br />
of 4,000NM, this variant of the series has been highly successful<br />
and features the addition of blended winglets improving the aircraft’s<br />
performance by reducing drag, as well as lower emission engines.<br />
Just a year later, the DX variant entered service. With a reduced range<br />
of 3,425NM, the DX is often seen as a more cost-effective model for<br />
those not requiring the extra range of the LX.<br />
The 2000S and 2000LXS are the latest in the series to enter the<br />
market, as well as the only two still in production. The ‘S’ variant,<br />
MODEL COMPARISON<br />
MODEL<br />
2000 2000EX 2000EX EASY 2000DX 2000LX 2000S 2000LXS<br />
Entry into Service<br />
Total Aircraft In Operation<br />
Engine Model<br />
Winglets<br />
Short Runway Capability<br />
Avionics System<br />
1995<br />
230<br />
CFE738-1-1B<br />
No<br />
No<br />
Rockwell Collins<br />
2004<br />
26<br />
PW308C<br />
No<br />
No<br />
Rockwell Collins<br />
2004<br />
103<br />
PW308C<br />
No<br />
No<br />
EASy (Honeywell)<br />
2008<br />
4<br />
PW308C<br />
No<br />
No<br />
EASy (Honeywell)<br />
2007<br />
131<br />
PW308C<br />
Yes<br />
No<br />
EASy (Honeywell)<br />
2013<br />
38<br />
PW308C<br />
Yes<br />
Yes<br />
EASy II (Honeywell)<br />
2013<br />
70<br />
PW308C<br />
Yes<br />
Yes<br />
EASy II (Honeywell)<br />
Pro Line 4<br />
Pro Line 4<br />
“Maximum Range<br />
3,000 N.M.<br />
3,900 N.M.<br />
3,900 N.M.<br />
3,425 N.M.<br />
4,000 N.M.<br />
3,350 N.M.<br />
4,000 N.M.<br />
(NBAA IFR Reserves)”<br />
Max Cabin Length<br />
Max Cabin Height<br />
Max Cabin Width<br />
Cabin Volume<br />
26.17 ft<br />
74 ft<br />
92 ft<br />
1,024 cu.ft<br />
26.17 ft<br />
74 ft<br />
92 ft<br />
1,024 cu.ft<br />
26.17 ft<br />
74 ft<br />
92 ft<br />
1,024 cu.ft<br />
26.17 ft<br />
74 ft<br />
92 ft<br />
1,024 cu.ft<br />
26.17 ft<br />
74 ft<br />
92 ft<br />
1,024 cu.ft<br />
26.17 ft<br />
74 ft<br />
92 ft<br />
1,024 cu.ft<br />
26.17 ft<br />
74 ft<br />
92 ft<br />
1,024 cu.ft<br />
(Exl. Cockpit and Baggage)<br />
Typ. Passengers<br />
8-10 Pax<br />
8-10 Pax<br />
8-10 Pax<br />
8-10 Pax<br />
8-10 Pax<br />
8-10 Pax<br />
8-10 Pax<br />
Data Sources: Dassault Falcon & Conklin & de Decker<br />
AGE AND MODEL DISTRIBUTION - ALL FALCON 2000 MODELS<br />
2000<br />
2000EX<br />
2000EX EASy 2000DX 2000LX 2000LXS 2000S<br />
45<br />
No. of Aircraft in Operation<br />
40<br />
35<br />
30<br />
25<br />
20<br />
15<br />
10<br />
5<br />
0<br />
1995<br />
1996<br />
1997<br />
1998<br />
1999<br />
2000<br />
2001<br />
2002<br />
2003<br />
2004<br />
2005<br />
2006<br />
2007<br />
2008<br />
2009<br />
2010<br />
2011<br />
2012<br />
2013<br />
2014<br />
2015<br />
2016<br />
2017<br />
* Data Source: JETNET<br />
36 | ASIAN SKY QUARTERLY — FIRST QUARTER 2018
PRE-OWNED SPOTLIGHT<br />
FALCON 2000S / LXS RESIDUAL VALUE BY DELIVERY YEAR<br />
PRE-OWNED MARKET REGION & MODEL BREAKDOWN<br />
TRANSACTIONS INV<strong>EN</strong>TORY VALUE (M USD)<br />
RESIDUAL VALUE (M USD)<br />
35.10<br />
29.95<br />
30.00<br />
27.50<br />
2018 2017 2016 2015 2014<br />
Northern Europe Middle East Asia Latin Amer.<br />
* Source: Vref.<br />
America<br />
& Carib<br />
with a range of 3,350NM, is the first in the series with short-field and<br />
steep approach capability. It also features the EASy II flight deck,<br />
reducing pilot workload and automating or abbreviating tasks that<br />
are repetitive, stressful and distracting. The ‘LXS’ variant combines<br />
the features of the ‘S’ and the ‘LX’, pairing the long range of 4,000NM<br />
with short runway and steep approach capability.<br />
PRE-OWNED MARKET ANALYSIS<br />
27.00<br />
24.50<br />
25.00<br />
21.50<br />
2000S<br />
2000LXS<br />
Worldwide, the Falcon 2000 series fleet stands at just over 600.<br />
The earliest variation of the series (2000) has the largest fleet (230)<br />
and is, consequently, the most active in the pre-owned market. In<br />
March 2018, there were 17 available on the market, most of which<br />
are based in North America. The ‘LX’ has a significantly smaller fleet<br />
INV<strong>EN</strong>TORY VALUE & TRANSACTIONS<br />
552<br />
556<br />
684 694<br />
641<br />
669<br />
564<br />
515<br />
508<br />
467<br />
509<br />
23.00<br />
18.50<br />
540 530<br />
NO. OF AIRCRAFT FOR SALE<br />
NO. OF AIRCRAFT FOR SALE<br />
16<br />
2000<br />
2000<br />
8<br />
2000EX EASy<br />
2000EX<br />
4<br />
2000DX<br />
2000EX EASy<br />
2000LX<br />
AIRCRAFT FOR SALE - MODEL BREAKDOWN<br />
2000LX<br />
2000LXS<br />
2000LXS<br />
2000S<br />
2000S<br />
63 64 65<br />
63<br />
61 61 60<br />
50 52 55 57 59 57<br />
54 54 51 49<br />
45<br />
43 42<br />
40<br />
37 38 38<br />
32<br />
* Data source: JETNET & ASG<br />
9 9<br />
7 7<br />
8<br />
7<br />
8<br />
7<br />
8<br />
5 5<br />
4<br />
4 4 4<br />
3<br />
2<br />
3<br />
2<br />
3 3 3<br />
1 1<br />
572<br />
2016/03<br />
2016/04<br />
529<br />
2016/05<br />
2016/06<br />
485<br />
2016/07<br />
2016/08<br />
437<br />
2016/09<br />
2016/10<br />
421<br />
2016/11<br />
2016/12<br />
2017/01<br />
2017/02<br />
361 364<br />
2017/03<br />
2017/04<br />
310<br />
3<br />
2017/05<br />
302<br />
1 1<br />
347 379<br />
Northern<br />
Africa<br />
345<br />
2<br />
2016/03<br />
2016/04<br />
2016/05<br />
2016/06<br />
2016/07<br />
2016/08<br />
2016/09<br />
2016/10<br />
2016/11<br />
2016/12<br />
2017/01<br />
2017/02<br />
2017/03<br />
2017/04<br />
2017/05<br />
2017/06<br />
2017/07<br />
2017/08<br />
2017/09<br />
2017/10<br />
2017/11<br />
2017/12<br />
2018/01<br />
2018/02<br />
2018/03<br />
2017/06<br />
2017/07<br />
2017/08<br />
2017/09<br />
2017/10<br />
2017/11<br />
2017/12<br />
2018/01<br />
2018/02<br />
2018/03<br />
* Data source: JETNET & ASG, excluding 2000DX<br />
FIRST QUARTER 2018 — ASIAN SKY QUARTERLY | 37
PRE-OWNED SPOTLIGHT<br />
(131), and is not as active on the market, with<br />
only three currently for sale in March 2018.<br />
These numbers are much lower than previous<br />
quarters, when the total Falcon 2000 series<br />
had close to 40 available on the market and<br />
the LX had close to and, at times, over 10<br />
aircraft for sale.<br />
AVERAGE ASKING PRICE TR<strong>EN</strong>D - MAJOR MODELS<br />
Average<br />
Falcon 2000<br />
19.5<br />
Falcon 2000EX EASy<br />
Falcon 2000LX<br />
18.2<br />
17.5<br />
Inventory levels have reduced drastically,<br />
particularly in the last quarter of 2017. The<br />
Falcon 2000, which in 2016 consistently<br />
saw around 12-14% of its worldwide fleet<br />
for sale, has decreased to about 11% of its<br />
fleet for sale at the end of 2017 and below<br />
8% in March 2018. The ‘LX’ fleet for sale<br />
saw the greatest decrease, falling to 2% of<br />
its worldwide fleet for sale. Overall supply of<br />
the ‘LX’, ‘S’ and ‘LXS’ reached a historic low at<br />
the end of 2017, although supply has since<br />
slightly increased.<br />
Average Asking Price (M USD)<br />
12.8<br />
11.3<br />
5.0<br />
14.0<br />
11.8<br />
10.5<br />
5.4<br />
14.1<br />
12.9<br />
11.3<br />
11.0<br />
8.3<br />
5.1<br />
4.6 4.6<br />
12.4<br />
7.6<br />
14.6<br />
12.6<br />
10.2<br />
5.0<br />
As of March 2018, the 2000 had an average<br />
of 184 days on market (DOM), decreasing<br />
from the DOM seen in the last half of 2017.<br />
The DOM of the LX was 127 in March 2018,<br />
a significant decrease from the DOM seen<br />
throughout 2016 and much of 2017.<br />
2016/03<br />
2016/04<br />
2016/05<br />
2016/06<br />
2016/07<br />
2016/08<br />
2016/09<br />
2016/10<br />
2016/11<br />
2016/12<br />
2017/01<br />
2017/02<br />
2017/03<br />
2017/04<br />
2017/05<br />
2017/06<br />
2017/07<br />
2017/08<br />
* The average asking price is based on all F2000 models excluding F2000DX<br />
PERC<strong>EN</strong>TAGE FOR SALE - MAJOR MODELS<br />
In Q1 of 2018, the average asking price of the<br />
2000 model was approximately US$5.0M,<br />
slightly higher than the second half of 2017<br />
when a price decrease stimulated market<br />
activity, particularly in the US. Consequently<br />
the majority of transactions for the 2000<br />
model have taken place between US-based<br />
buyers and US-based sellers. Buyers can<br />
now expect a range of US$2.5M to US$6.5M,<br />
with the EX model trading at US$6.75M to<br />
US$7.5M. Demand for the 2000 and ‘EX’<br />
favors the 1999 and newer models, along<br />
with a 10-passenger interior. The average<br />
asking price of the LX is US$14.6M, which<br />
is also an increase from lower prices in the<br />
second half 2017. Buyers can now expect a<br />
range of US$13.5M to US$19M.<br />
20.0%<br />
18.0%<br />
16.0%<br />
14.0% 13.0%<br />
12.0%<br />
10.3%<br />
10.0%<br />
10.0%<br />
8.0%<br />
7.7%<br />
6.0%<br />
4.0%<br />
2.0%<br />
0.0%<br />
2016/03<br />
2016/05<br />
16.3%<br />
14.8%<br />
2016/07<br />
8.4%<br />
2016/09<br />
Falcon 2000<br />
Falcon 2000 EX EASy<br />
13.7%<br />
DAYS ON MARKET - MAJOR MODELS<br />
2017/01<br />
3.8%<br />
Falcon 2000 LX<br />
Average<br />
7.4%<br />
5.4%<br />
4.9%<br />
2.3%<br />
Today, the Falcon 2000 series is noted for its<br />
technology and wide-body aircraft design.<br />
With seating for 10 passengers, low operating<br />
costs, higher fuel efficiency, the 2000 is a<br />
unique value combining large cabin comfort<br />
with the efficiencies of a mid-size aircraft.<br />
450<br />
400<br />
250<br />
300<br />
250<br />
200<br />
150<br />
224<br />
210<br />
Falcon 2000<br />
Falcon 2000 EX EASy<br />
388<br />
293<br />
Falcon 2000 LX<br />
267<br />
Average<br />
184<br />
127<br />
100<br />
108<br />
117<br />
50<br />
0<br />
51<br />
2016/03<br />
2016/04<br />
2016/05<br />
2016/06<br />
2016/07<br />
2016/08<br />
2016/09<br />
2016/11<br />
2017/01<br />
2017/02<br />
2017/03<br />
2017/09<br />
2017/08<br />
2017/09<br />
2017/10<br />
2017/11<br />
2017/05<br />
2018/01<br />
2018/02<br />
2018/03<br />
2017/05<br />
2018/01<br />
2017/06<br />
2017/03<br />
2017/07<br />
2017/11<br />
2017/07<br />
2018/03<br />
2016/11<br />
2017/02<br />
2017/10<br />
2016/06<br />
2017/06<br />
2016/10<br />
2018/02<br />
2016/10<br />
2016/04<br />
2017/04<br />
2017/04<br />
2017/12<br />
2017/12<br />
2016/08<br />
2016/12<br />
2017/08<br />
2016/12<br />
2017/09<br />
2017/10<br />
2017/11<br />
2017/12<br />
2018/01<br />
2018/02<br />
2018/03<br />
38 | ASIAN SKY QUARTERLY — FIRST QUARTER 2018
PRE-OWNED SPOTLIGHT<br />
FALCON 2000 SERIES<br />
MARKET AVAILABILITY<br />
MODEL<br />
NUMBER<br />
FOR SALE<br />
TOTAL FLEET<br />
%<br />
AVG. DAYS<br />
ON MARKET<br />
AVG. ASKING (USD)<br />
F2000<br />
F2000DX<br />
F2000EX<br />
F2000EX EASy<br />
F2000LX<br />
F2000LXS<br />
F2000S<br />
17<br />
1<br />
0<br />
5<br />
3<br />
2<br />
5<br />
230<br />
4<br />
26<br />
103<br />
131<br />
70<br />
38<br />
7%<br />
25%<br />
-<br />
5%<br />
2%<br />
3%<br />
13%<br />
208<br />
141<br />
-<br />
111<br />
179<br />
89<br />
119<br />
5.2M<br />
Make Offer<br />
-<br />
12.6M<br />
Make Offer<br />
Make Offer<br />
19.35M<br />
AIRCRAFT<br />
MODEL<br />
YEAR BASE AREA ASKING<br />
DAYS<br />
ON MARKET<br />
AFTT PAX<br />
<strong>EN</strong>GINE<br />
PROGRAM<br />
APU<br />
PROGRAM<br />
2000 1995 Asia Make Offer 394 6,610 9 - -<br />
2000 1996 Western Europe $4,000,000 113 7,221 8 MSP Gold MSP Gold<br />
2000 1996 Northern America Make Offer 401 9,352 10 CSP Gold MSP Gold<br />
2000 1997 Western Europe Make Offer 261 7,649 8 MSP Gold MSP Gold<br />
2000 1997 Western Europe $3,950,000 117 4,785 8 CSP Gold MSP<br />
2000 1998 Northern America Make Offer 63 7,265 9 CSP Gold MSP<br />
2000 1999 Northern America $3,995,000 197 6,466 10 CSP MSP Gold<br />
2000 2000 Northern America Make Offer 29 13,604 10 MSP Gold MSP Gold<br />
2000 2000 Northern America $4,500,000 300 8,948 10 CSP Gold -<br />
2000 2001 Middle East Make Offer 743 - TBD - -<br />
2000 2001 Middle East Make Offer 138 5,599 10 JSSI JSSI<br />
2000 2002 Northern Africa Make Offer 15 4,787 10 CSP MSP<br />
2000 2002 Northern America Make Offer 217 3,654 8 CSP MSP<br />
2000 2002 Northern America $7,495,000 118 4,538 10 CMSP MSP<br />
2000 2004 Northern America Make Offer 223 4,736 10 JSSI JSSI<br />
2000 2005 Northern America $7,300,000 127 4,965 10 MSP Gold MSP<br />
2000 2005 Northern America Make Offer 76 4,026 8 ESP Gold -<br />
2000DX 2006 Middle East Make Offer 141 4,182 10 CSP Gold MSP<br />
2000EX EASy 2007 Northern America $11,500,000 42 4,616 10 ESP Gold MSP<br />
2000EX EASy 2007 Northern America Make Offer 162 2,950 10 ESP Gold MSP<br />
2000EX EASy 2007 Western Europe Make Offer 174 2,491 9 ESP Gold MSP Gold<br />
2000EX EASy 2007 Asia Make Offer 166 5,117 9 ESP Gold MSP Gold<br />
2000EX EASy 2008 Middle East $13,750,000 12 2,301 8 ESP Platinum MSP<br />
2000LX 2008 Northern America Make Offer 148 3,077 10 ESP Gold MSP<br />
2000LX 2012 Asia Make Offer 222 984 10 ESP Gold MSP Gold<br />
2000LX 2012 Western Europe Make Offer 168 1,606 7 ESP MSP Gold<br />
2000LXS 2013 Western Europe Make Offer 57 1,397 10 ESP Platinum -<br />
2000LXS 2013 Asia Make Offer 121 1,044 10 ESP Gold MSP<br />
2000S 2013 Northern America $18,950,000 196 590 10 JSSI JSSI<br />
2000S 2014 Western Europe $19,750,000 44 1,315 11 ESP Gold MSP<br />
2000S 2014 Western Europe Make Offer 240 1,330 TBD ESP -<br />
2000S 2015 Middle East Make Offer 41 1,011 10 ESP Gold MSP<br />
2000S 2015 Northern America Make Offer 75 830 12 ESP Gold -<br />
FIRST QUARTER 2018 — ASIAN SKY QUARTERLY | 39
INDUSTRY INSIDER<br />
BRINGING AVIATION AND<br />
FINANCING TOGETHER<br />
INTERVIEW WITH VIOLET KWEK,<br />
SALES DIRECTOR, GREATER CHINA AND NORTH ASIA<br />
GLOBAL JET CAPITAL<br />
Interview by Litalia Yoakum<br />
In February 2017, Violet Kwek joined private aircraft financier Global Jet Capital as Sales Director, Greater China<br />
and North Asia, after years of experience in corporate and ship financing. Just one year in, Violet has led the team<br />
to close its first deals in North Asia, including an operating lease with a Hong Kong-based client. Global Jet Capital<br />
is now seeing an increased demand for financing, as the demand for business jets in the Asia-Pacific region grows.<br />
Tell me about your experience prior to joining<br />
Global Jet Capital?<br />
I started working in corporate finance in 2004 in Singapore. My career<br />
in transportation started in 2007 when I joined DVB Bank Singapore<br />
as an Associate in their Mergers and Acquisitions Shipping team.<br />
Subsequently I moved to the ship leasing team, structuring finance and<br />
operating leases to shipowners based in Southeast Asia and India.<br />
In January 2010, I joined Standard Chartered Bank’s Structured Finance<br />
team in Shipping as an Associate Director in Hong Kong where I built<br />
up the shipping debt and lease portfolio in China and Taiwan across a<br />
diverse range of clients spanning private enterprises, conglomerates to<br />
state-owned enterprises and Chinese leasing companies. I became an<br />
Executive Director in Shipping Finance in 2014<br />
My last role prior to joining Global Jet Capital was the Deputy Head of<br />
Shipping Finance and thereafter the Deputy Head of Corporate Banking<br />
in the Hong Kong branch of China Minsheng Banking Corporation.<br />
What are buyer’s options, in terms of financing?<br />
There are 3 main types of financing:<br />
• Loans;<br />
• Finance leases; and<br />
• Operating leases.<br />
When considering financing products and being able to obtain the<br />
financing, some of the key elements buyers should consider include:<br />
• Initial budget: The combination of 1) the down payment<br />
required from the buyer; 2) The upfront expenses in relation to<br />
the aircraft and its financing; and 3) asset under management<br />
requirements and/or any related cash security deposit.<br />
• Ongoing costs: The annual total cost of the loan/lease<br />
payments and the fixed and variable aircraft operating costs.<br />
• Maintenance programs: Many financiers will require the<br />
aircraft to be on at least engines and APU programs. Buyers<br />
should check whether a pre-owned aircraft is enrolled in these<br />
programs. Some aircraft owners who paid cash for their aircraft<br />
and subsequently wish to refinance their aircraft, may have to<br />
pay a significant buy-in fee to enrol in these programs as their<br />
aircraft gets older.<br />
• Residual risk on the aircraft: Buyers take the residual risk on<br />
an aircraft with a loan or a finance lease. So buyers need to<br />
consider if they want to take this residual risk on the aircraft or<br />
pass it on to a lessors like Global Jet Capital with an operating<br />
lease solution. In this way should the then market value of the<br />
aircraft be lower than its expected value at time of the sale<br />
when the owner wants to upgrade his/her aircraft, the risk of<br />
this price differential is passed on to the operating lessor.<br />
40 | ASIAN SKY QUARTERLY — FIRST QUARTER 2018
INDUSTRY INSIDER<br />
What are some of the benefits of financing?<br />
In general financing allows a buyer to utilise their funds more efficiently<br />
to maximise their returns, as typically the return on equity is much<br />
higher than the cost of financing.<br />
When a buyer is in a situation where he/she has a substantial amount<br />
of cash and have no better projects or products to invest in, then it may<br />
be more beneficial for such clients to go for a lower cost of financing<br />
such as a loan/finance lease or pay cash for their aircraft. Of course if<br />
such cash rich buyers want to manage the aircraft’s residual risk with<br />
no exposure to market fluctuations, they can always look for Global Jet<br />
Capital to provide operating lease solutions to transfer that residual risk<br />
to us.<br />
Other benefits of an operating lease solution for a business jet include:<br />
• Lower cash outlay: Given financing of up to 100% of the fair<br />
market value can be provided, the lessee typically only needs to<br />
fund the security deposit vs the 20-30% down payment required<br />
for a loan or finance lease typically.<br />
• Ease and flexibility on exit: Full flexibility to upgrade or exit with<br />
no aircraft to remarket at end of lease as there is no need for the<br />
owner to wait to sell the aircraft;<br />
• Predictable costs: Predictable lease and maintenance costs for<br />
precise budgeting as there are no bumpy cash outlays on the<br />
aircraft purchase and/or a loss on sale in book value on disposal<br />
of the aircraft.<br />
Why is it beneficial to use Global Jet Capital<br />
over a traditional bank?<br />
Different clients have different needs hence each client will require<br />
financing solutions that meets their needs and requirements.<br />
Some of the advantages of financing with Global Jet Capital include:<br />
• We may offer a higher financing loan-to-value ratio in respect to<br />
the aircraft’s fair market value.<br />
• As we are not a private bank, we do not require a minimum asset<br />
under management that a new client will need to deposit and/<br />
or invest in wealth management products, though we will require<br />
a cash security deposit. As such the client has the flexibility<br />
to invest in any type of assets they want and/or invest in their<br />
businesses or family office which may generate higher returns.<br />
• We typically work with clients to understand their requirements<br />
and tailor a solution specific for them based on their requirements<br />
and their financial metrics.<br />
• We are one of the few if not the only financier in the Asia-Pacific<br />
region that offers operating leases on business jets, the benefits<br />
of which have had been mentioned earlier.<br />
For some Chinese clients, the advantages of financing with Global Jet<br />
Capital may be more pronounced as our financing products allow them<br />
utilise their precious offshore cash more effectively and efficiently for<br />
other investments and needs.<br />
The main disadvantage of an operating lease is that the lease is not<br />
easily terminated as the lessor has taken a view on the expected<br />
residual value at the end of the lease and, as such, priced the lease<br />
rate accordingly for the full lease term. A shorter lease term will entail<br />
a higher lease rate and therefore an early termination payment if this<br />
is the case.<br />
What are some common misconceptions<br />
surrounding aircraft financing?<br />
The most common one is the misconception that operating leases<br />
do not require guarantees. Even though aircraft financing is an asset<br />
based financing, all forms of financing require a counterparty who has<br />
adequate financial strength to maintain their financial obligations. The<br />
key difference between an operating lease and a finance lease or a loan<br />
is that the residual risk is borne by the lessor rather than the lessee/<br />
borrower. A bank providing a property loan will also analyse whether a<br />
borrower has the adequate financial means to make his or her monthly<br />
repayments despite having the property mortgaged to them.<br />
As most aircraft are owned by special purpose vehicles with no assets<br />
or operations other than the aircraft, the aircraft lessor will require a<br />
guarantor to ensure the lease payments will be made, no different than<br />
a home loan. Just like banks providing home loans, they are in the<br />
business of providing financing, not leasing out residential apartments.<br />
Global Jet Capital is in the business of providing business jet financing,<br />
not leasing out business jets.<br />
Different clients have<br />
different needs hence each<br />
client will require financing<br />
solutions that meets their<br />
needs and requirements .<br />
What can be expected from Global Jet Capital<br />
over the next couple of years?<br />
For the North Asia region, we will continue to expand our presence in<br />
China and will look to develop our presence on other parts of North Asia<br />
such as Japan, Korea and Taiwan where we expect that our operating<br />
lease product may allow us to compete with the competitively priced<br />
traditional bank financings.<br />
We will also endeavour to provide a more diverse range of financing<br />
structures that is tailored and reflects the needs of the different<br />
geographical markets in line with our aim to deliver innovative solutions<br />
to our clients.<br />
www.globaljetcapital.com<br />
Another misconception is that as a non-bank financier, some clients<br />
may have the impression we do not require or have loose KYC (Know<br />
Your Customer), anti-money laundering and anti-terrorism checks. In<br />
this respect, we are no different and have such similar requirements as<br />
with any bank.<br />
FIRST QUARTER 2018 — ASIAN SKY QUARTERLY | 41
Be among the biggest names in rotorcraft as we land again in<br />
Singapore. Dedicated to the thriving Asia Pacific market,<br />
Rotorcraft Asia 2019 covers the entire rotorcraft supply chain<br />
from airframes, components and parts, to avionics, safety<br />
systems, MROs and more.<br />
Stay ahead of the competition and seize the<br />
unparalleled business opportunities in this flourishing<br />
region. Book now!<br />
• Meet with potential buyers<br />
via our VIP Buyers Programme<br />
Land right here for the full view<br />
www.rotorcraft-asia.com<br />
To exhibit, please contact Lim Mei Ling / Theresa Gan at:<br />
+65 65956113 / 6595 6122 sales@rotorcraft-asia.com<br />
42 | ASIAN SKY QUARTERLY — FIRST QUARTER 2018
AIRCRAFT POSITIONING<br />
BUSINESS JETS<br />
CORP. AIRLINER<br />
LONG RANGE<br />
LARGE<br />
MEDIUM<br />
LIGHT<br />
VERY LIGHT<br />
ACJ321 BBJ3<br />
ACJ320<br />
BBJ2<br />
ACJ319 BBJ<br />
24<br />
23<br />
22<br />
21<br />
20<br />
19<br />
18<br />
17<br />
16<br />
15<br />
14<br />
13<br />
ACJ318<br />
GLOBAL 6000<br />
LINEAGE 1000E<br />
GLOBAL 5000<br />
G650ER<br />
G650<br />
G550<br />
F8X<br />
F7X<br />
12<br />
11<br />
10<br />
9<br />
G450<br />
8<br />
F900LX<br />
7<br />
LEGACY 650<br />
F2000LXS<br />
CL850<br />
CL650<br />
LEGACY 600<br />
F2000S<br />
CL350<br />
GLOBAL EXPRESS<br />
CIT. X+ G280<br />
F2000LX<br />
G350<br />
LEGACY 500<br />
CL605<br />
F900EX EASY<br />
CIT. SOVEREIGN+<br />
CL300<br />
F2000<br />
LRGACY 450<br />
CIT. LATITUDE<br />
CIT. X<br />
G300<br />
L75<br />
L70<br />
CIT. XLS+<br />
G150<br />
F2000DX<br />
F50EX<br />
GLOBAL EXPRESS XRS<br />
G200<br />
H4000<br />
CIT. SOVEREIGN<br />
G-IVSP<br />
F900EX<br />
G-IV<br />
F2000EX<br />
CL604<br />
G-V<br />
6<br />
4<br />
3<br />
TOTAL ANNUAL COST (MILLION USD/YEAR)<br />
CIT. CJ1+<br />
CIT. CJ1<br />
PREMIER 1A<br />
DIAMOND 1A<br />
H400XP CIT. BRAVO<br />
CIT. M2<br />
BEECHJET 400<br />
CIT. CJ2<br />
PH<strong>EN</strong>OM 100E<br />
HONDAJET<br />
CIT. MUSTANG<br />
ECLIPSE 550<br />
CIT. ULTRA<br />
CIT. <strong>EN</strong>CORE<br />
H900XP<br />
CIT. CJ4<br />
H850XP<br />
PH<strong>EN</strong>OM 300<br />
H800<br />
CIT. XLS<br />
CIT. VII<br />
L60XR<br />
L45XR<br />
CIT. CJ3+<br />
G100<br />
CIT. CJ3<br />
L40XR<br />
CIT. EXCEL ASTRA SP<br />
CIT. <strong>EN</strong>CORE+<br />
CIT. CJ2+<br />
H800XP<br />
NEXTANT 400XTI<br />
2<br />
500<br />
1,000<br />
1,500<br />
2,000<br />
2,500<br />
3,000<br />
3,500<br />
4,000<br />
4,500<br />
5,000<br />
5,500<br />
6,000<br />
6,500<br />
7,000<br />
7,500<br />
8,000<br />
1<br />
MAX RANGE (N.M.)<br />
* The estimated total yearly cost is based on aircraft ownership cost for 10 years including financing, plus annual operating costs and regional adjustments.<br />
Source: Conklin & de Decker 2017<br />
FIRST QUARTER 2018 — ASIAN SKY QUARTERLY | 43
AIRBUS<br />
0+4+0 0+0+0 4+0+<br />
4+0 0+0+0 4+0 0+0+0 4+0 0+4+0 0+0+0 4+0 0+0+0 4+0 0+0+0 0+4+0 0+0+0 5+0 0+0+0 5+0<br />
0+0+0 1+0+0+00+0+00+0<br />
MARKET SUMMARY -- JETS<br />
INV<strong>EN</strong>TORY LEVEL, PRICE TR<strong>EN</strong>D & TRANSACTIONS<br />
ACJ318<br />
• There was one transaction completed in Q1 2018.<br />
Average Asking Price<br />
$31.2<br />
SPECS<br />
Max Range<br />
4,253 N.M. / 7,877 km (with ACTs)<br />
Max Speed<br />
Mach 0.82<br />
$29.3 Typ. Passengers 19<br />
$29.3<br />
FOR SALE<br />
2018 Q1 2017 Q4<br />
For Sale vs. Sold<br />
No. for Sale<br />
5 (25.0%) 4 (20.0%)<br />
Avg Asking Price 29.3M USD 29.3M USD<br />
5 5<br />
Avg Days on Market 1,072 1,242<br />
4 4 4 4 4 4 4 4 4 4 4<br />
1<br />
2018 Q1 2017 Q4<br />
SOLD<br />
Past 12 Months 1<br />
0<br />
Mar Jun Sep Dec Mar<br />
2017 2018 Past 3 Months 1<br />
0<br />
For Sale Sold<br />
MARKET SUMMARY PER MODEL — BUSINESS JETS<br />
• There were five Airbus ACJ318s available for sale in Q1 2018. The inventory<br />
level increased in Q1 2018 from four in Q4 2017. This represents 25% of the<br />
total 20 aircraft in service.<br />
• Asking prices ranged from US$30M for a 2008 model with 2,627 hours to<br />
US$27.95M for a 2009 model with 1,547 total hours. Average asking price in<br />
Q1 2018 remained stable at US$29.3M.<br />
• The average days on market for sale reduced from 1,257 days in Q4 2017 to<br />
1,072 days.<br />
ACJ319<br />
0+14+0 0+0+0 14+0+<br />
14+0 0+0+0 14+0 0+0+0 14+0 0+14+0 0+0+0 10+0 12+0 0+0+0 14+0 4+0+0 0+14+0 0+0+0 14+0 2+0+0 14+0<br />
0+0+0 0+0+0 2+0+00+0+00+0<br />
$37.6<br />
Average Asking Price<br />
For Sale vs. Sold<br />
$35.7<br />
7 7 7 7 7 7 7 7 7<br />
6<br />
5<br />
2<br />
1<br />
$39.3<br />
7<br />
1<br />
$39.3<br />
Mar Jun Sep Dec Mar<br />
2017 2018<br />
Sold<br />
For Sale<br />
7<br />
• There were seven Airbus ACJ319s available for sale in 2018 Q1, including four<br />
on-market and three off-market. This represents 10% of the total 71 aircraft<br />
in service. The inventory level remained stable in Q1 2018.<br />
• Current asking prices range from US$70M for a 2012 model with only ferry<br />
hours to US$18M for a 1999 model with 8,678 total hours. Average asking<br />
price in Q1 2018 remained stable at US$39.3M.<br />
• In Q1 2018, the average days on market for sale increased to 508 days from<br />
418 days in Q4 2017.<br />
• There was one transaction completed in 2018 Q1.<br />
SPECS<br />
Max Range<br />
Max Speed<br />
Typ. Passengers<br />
FOR SALE<br />
No. for Sale<br />
Avg Asking Price<br />
Avg Days on Market<br />
SOLD<br />
Past 12 Months<br />
Past 3 Months<br />
6,000 N.M. /11,112 km<br />
Mach 0.82<br />
19<br />
2018 Q1<br />
7 (9.9%)<br />
39.3M USD<br />
508<br />
2018 Q1<br />
4<br />
1<br />
2017 Q4<br />
7 (9.7%)<br />
39.3M USD<br />
418<br />
2017 Q4<br />
4<br />
1<br />
44 | ASIAN SKY QUARTERLY — FIRST QUARTER 2018<br />
Source: JETNET & ASG
MARKET SUMMARY -- JETS<br />
BBJ<br />
• There were 18 BBJs available for sale in 2018 Q1. This represents approximately<br />
13% of the total 134 aircraft in service. The inventory levels remained<br />
steady in Q1 2018, with two new aircraft entering the market, replacing two<br />
aircraft sold from the market in March.<br />
• The BBJ pre-owned market is segmented into two main categories: 2008<br />
YOM & up, typically asking US$49M and above; and 2002 YOM & down, typically<br />
asking for lower US$20M and below. Asking prices further range from<br />
US$92.5M for a 2011 model with only ferry hours to US$19.5M for a 1999<br />
model with a total of 10,115 hours.<br />
• The average days on market in Q1 2018 has decreased to 712 days from 743<br />
days in Q4 2017.<br />
SPECS<br />
Max Range<br />
Max Speed<br />
Typ. Passengers<br />
FOR SALE<br />
No. for Sale<br />
Avg Asking Price<br />
Avg Days on Market<br />
SOLD<br />
Past 12 Months<br />
Past 3 Months<br />
6,235 N.M. / 11,547 km (with 9 ACTs)<br />
Mach 0.82<br />
19<br />
2018 Q1 2017 Q4<br />
19 (14.2%)<br />
37.3M USD<br />
712<br />
9<br />
2<br />
18 (13.5%)<br />
2018 Q1 2017 Q4<br />
For Sale vs. Sold<br />
37.3M USD<br />
743 16 17 17 16 16 16 16<br />
7<br />
2<br />
$43.8<br />
Average Asking Price<br />
14<br />
17<br />
$37.3<br />
$33.8<br />
18 18 18 19<br />
$37.3<br />
1 2 1 1<br />
2 2<br />
Mar Jun Sep Dec Mar<br />
2017 2018<br />
Sold<br />
For Sale<br />
0+0+0 0+0+0 2+0+00+0+00+0+01+0+00+0+01+0+02+0+00+0+01+0+00+0+0<br />
0+19+00+18+0 0+18+00+17+00+14+00+16+00+16+00+16+00+16+00+17+00+17+00+16+0<br />
2+0+0<br />
BOEING<br />
BBJ2<br />
• The BBJ2 market is a very limited one with only 22 aircraft in service worldwide<br />
and it is very much concentrated in the Middle East, where more than<br />
50% of the aircraft are in service. In Q1 2018, Asia represented 20% of the<br />
market - a mere four aircraft.<br />
• In Q1 2018, there were only four BBJ2s on market. This represents approximately<br />
18% of the total 22 aircraft in service.<br />
• There was no transaction completed over the last 12 months, although there<br />
is a “deal pending”. The most recent BBJ2 transaction occurred in July 2016,<br />
which was a 2003 model with an estimated US$33M price tag.<br />
SPECS<br />
Max Range<br />
Max Speed<br />
Typ. Passengers<br />
FOR SALE<br />
No. for Sale<br />
Avg Asking Price<br />
Avg Days on Market<br />
SOLD<br />
Past 12 Months<br />
Past 3 Months<br />
Source: JETNET & ASG<br />
5,620 N.M. / 10,408 km (with 7 ACTs)<br />
Mach 0.82<br />
19<br />
2018 Q1<br />
4 (18.2%)<br />
69.0M USD<br />
592<br />
2018 Q1<br />
0<br />
0<br />
2017 Q4<br />
4 (18.2%)<br />
69.0M USD<br />
532<br />
0+8+0<br />
2017 Q4<br />
0<br />
0<br />
0+8+0 0+8+0 0+8+0 0+8+0 0+16+00+8+0 0+16+0 0+12+0<br />
0+16+0 0+16+0<br />
Average Asking Price<br />
$69.6 $69.0 $69.0<br />
$62.0<br />
For Sale vs. Sold<br />
4 4 4 4 4 4<br />
3<br />
2 2 2 2 2 2<br />
Mar Jun Sep Dec Mar<br />
2017 2018<br />
For Sale Sold<br />
FIRST QUARTER 2018 — ASIAN SKY QUARTERLY | 45
MARKET SUMMARY -- JETS<br />
CHALL<strong>EN</strong>GER 604/605<br />
• There were 32 CL604s and 15 CL605s on the market in Q1 2018, representing<br />
8.8% and 5.2% of the total fleet, respectively.<br />
• The average asking price of a CL604 in Q1 2018 was US$5M, a 2% decrease<br />
from Q4 2017; A CL605 was US$12M, decreased 6% from Q4 2017.<br />
• The average days on market of a CL604 and CL605 were, respectively, 300<br />
and 269 days.<br />
• In Q1 2018, there were 10 CL604 transactions, which was the same as in Q4<br />
2017. In addition, eight CL605 transactions were completed, a decrease from<br />
nine transactions in Q4 2017.<br />
BOMBARDIER<br />
$11.1<br />
Average Asking Price<br />
$10.1<br />
CL605<br />
$5.1 CL604<br />
$12.6<br />
$11.7<br />
$5.1 $5.0<br />
SPECS<br />
Max Range<br />
Max Speed<br />
Typ. Passengers<br />
CL604<br />
4,027 N.M. / 7,458 km<br />
Mach 0.82<br />
9<br />
CL605<br />
4,000 N.M. / 7,408 km<br />
Mach 0.82<br />
9<br />
65<br />
For Sale vs. Sold<br />
69<br />
66<br />
62<br />
53 52 52 52<br />
51 50 49 49 47<br />
5 7 5<br />
8 8 7 6 6 7 8 7<br />
3 3<br />
Mar Jun Sep Dec Mar<br />
2017 2018<br />
For Sale Sold<br />
7+0+08+0+0<br />
7+0+06+0+06+0+07+0+03+0+08+0+08+0+05+0<br />
0+47+00+49+00+52+0<br />
0+50+00+49+00+51+00+52+00+52+00+53+00+62+00+66<br />
3+0+0<br />
FOR SALE<br />
No. for Sale<br />
Avg Asking Price<br />
Avg Days on Market<br />
SOLD<br />
Past 12 Months<br />
Past 3 Months<br />
2018 Q1 2017 Q4<br />
32 (8.8%) 33 (9.1%)<br />
5.0M USD 5.1M USD<br />
300 300<br />
2018 Q1 2017 Q4<br />
42<br />
10<br />
39<br />
10<br />
2018 Q1<br />
15 (5.2%)<br />
11.7M USD<br />
269<br />
2018 Q1<br />
33<br />
8<br />
2017 Q4<br />
17 (5.9%)<br />
12.6M USD<br />
194<br />
2017 Q4<br />
35<br />
9<br />
CHALL<strong>EN</strong>GER 850<br />
$9.0<br />
Average Asking Price<br />
For Sale vs. Sold<br />
$7.2 $7.2<br />
9 10 10 10<br />
7 7 7 7 7 7 7 6 6<br />
1 1 1<br />
2<br />
Mar Jun Sep Dec Mar<br />
2017 2018<br />
Sold<br />
For Sale<br />
0+0+0 0+0+0 2+0+00+0+00+0+01+0+00+0+00+0+00+0+00+0<br />
0+10+0 0+10+0 0+10+0 0+9+00+6+00+6+00+7+00+7+0 0+0+0<br />
7+0 0+7+0 0+7+0 0+7+0<br />
• There were 10 CL850s on the market, with 69 operating worldwide, representing<br />
14.5% of the total active fleet.<br />
• The average asking price in Q1 2018 was US$7.2M.<br />
• The average days on market of a CL850 in Q1 2018 was 667 days, decreased<br />
from 664 days in Q4 2017.<br />
• In Q1 2018, there were no transactions, down from two transactions in the<br />
previous quarter.<br />
SPECS<br />
Max Range<br />
Max Speed<br />
Typ. Passengers<br />
FOR SALE<br />
No. for Sale<br />
Avg Asking Price<br />
Avg Days on Market<br />
SOLD<br />
Past 12 Months<br />
Past 3 Months<br />
2,811 N.M. / 5,206 km<br />
Mach 0.80<br />
14<br />
2018 Q1<br />
10 (14.5%)<br />
7.2M USD<br />
677<br />
2018 Q1<br />
4<br />
0<br />
2017 Q4<br />
9 (12.9%)<br />
7.2M USD<br />
664<br />
2017 Q4<br />
5<br />
2<br />
Source: JETNET & ASG<br />
46 | ASIAN SKY QUARTERLY — FIRST QUARTER 2018
MARKET SUMMARY -- JETS<br />
GLOBAL 5000<br />
• There were 14 Global 5000s for sale in Q1 2018, with 218 operating worldwide,<br />
representing 6.4% of the total active fleet; an increase from 16 in Q4 2017.<br />
• The average asking price in Q1 2018 was US$17.8M, remained stable compare<br />
to Q4 2017.<br />
• The asking prices ranged from US$8.5M to US$29.5M.<br />
• The average days on market was 274 days, decreased from 497 days in Q4<br />
2017.<br />
• Similar to Q4 2017, there were five Global 5000 transactions in Q1 2018.<br />
SPECS<br />
Max Range<br />
Max Speed<br />
Typ. Passengers<br />
FOR SALE<br />
No. for Sale<br />
Avg Asking Price<br />
Avg Days on Market<br />
SOLD<br />
Past 12 Months<br />
Past 3 Months<br />
5,200 N.M. / 9,630 km<br />
Mach 0.89<br />
13<br />
2018 Q1<br />
14 (6.4%)<br />
17.8M USD<br />
274<br />
2018 Q1<br />
16<br />
5<br />
2017 Q4<br />
16 (7.3%)<br />
17.8M USD<br />
497<br />
2017 Q4<br />
14<br />
5<br />
$20.5<br />
17<br />
25<br />
Average Asking Price<br />
For Sale vs. Sold<br />
17<br />
18<br />
20 19<br />
18<br />
17 16 16<br />
3<br />
3<br />
1 1 1<br />
1 1<br />
1+0+03+0+01+0+00+0+03+0+01+0+00+0+01+0+01+0+0<br />
0+16+0 0+16+00+17+00+18+00+19+00+20+00+18+00+17+00+25+00+17+0<br />
1+0+0<br />
$17.8<br />
18<br />
$17.2<br />
15<br />
$17.8<br />
14<br />
1 2 1 2<br />
1+0+02+0+0<br />
0+14+00+15+00+18+0<br />
2+0+0<br />
BOMBARDIER<br />
Mar Jun Sep Dec Mar<br />
2017 2018<br />
Sold<br />
For Sale<br />
GLOBAL 6000<br />
• There were 15 Global 6000s on the market in Q1 2018, with 257 operating<br />
worldwide, representing 5.8% of the total active fleet.<br />
• The average asking price of a Global 6000 in Q1 2018 was US$34.7M,<br />
increased 1% from US$34.4M in Q4 2017.<br />
• The asking prices ranged from US$28.5M to US$48M.<br />
• The average days on market for sale of a Global 6000 was 208 days, increased<br />
from 198 days in Q4 2017.<br />
• In Q1 2018, there were no transactions, down from two transactions in Q4<br />
2017.<br />
SPECS<br />
Max Range<br />
Max Speed<br />
Typ. Passengers<br />
FOR SALE<br />
No. for Sale<br />
Avg Asking Price<br />
Avg Days on Market<br />
SOLD<br />
Past 12 Months<br />
Past 3 Months<br />
6,000 N.M. / 11,112 km<br />
Mach 0.88<br />
13<br />
2018 Q1<br />
15 (5.8%)<br />
36.3M USD<br />
208<br />
2018 Q1<br />
13<br />
0<br />
2017 Q4<br />
10 (4.0%)<br />
38.0M USD<br />
198<br />
2017 Q4<br />
15<br />
2<br />
$36.6<br />
Average Asking Price<br />
For Sale vs. Sold<br />
$41.8<br />
$28.5<br />
$38.0<br />
12 13 14 15 15<br />
12<br />
10 10 9 9 10 10 10<br />
2 3<br />
4<br />
1 1 1 1<br />
$36.3<br />
Mar Jun Sep Dec Mar<br />
2017 2018<br />
Sold<br />
For Sale<br />
0+0+0 0+0+01+0+01+0+04+0+01+0+03+0+01+0+02+0+00+0+00+0+0<br />
0+15+0 0+15+0 0+10+0 0+10+00+9+00+9+00+10+00+10+00+14+00+12+00+13+00+12+0<br />
0+0+0<br />
Source: JETNET & ASG<br />
FIRST QUARTER 2018 — ASIAN SKY QUARTERLY | 47
MARKET SUMMARY -- JETS<br />
DASSAULT<br />
FALCON 900DX/EX/EX EASy/LX<br />
$25.0<br />
$16.0<br />
$11.5<br />
$8.0<br />
34<br />
32<br />
Average Asking Price<br />
F900LX<br />
F900DX<br />
$8.8<br />
35<br />
$14.7<br />
For Sale vs. Sold<br />
30<br />
F900EX EASy<br />
$13.0<br />
29 28<br />
$21.0<br />
$18.3<br />
F900EX $6.3 $6.4<br />
26 25 26 26<br />
23 24 25<br />
3 4 4<br />
1 2 2 1 2 2 1<br />
$20.8<br />
$17.4<br />
$11.5<br />
Mar Jun Sep Dec Mar<br />
2017 2018<br />
Sold<br />
For Sale<br />
1+0+0 2+0+04+0+01+0+04+0+02+0+00+0+02+0+03+0<br />
0+26+0 0+26+00+25+0<br />
0+24+00+25+00+23+00+26+00+28+00+29+00+30+00+35<br />
0+0+0<br />
• There were 26 Falcon 900 series aircraft available on market for sale, including one<br />
Falcon 900DX, 21 Falcon 900EX/EASy and four Falcon 900LX aircraft. The inventory<br />
level remains stable, compared to that of Q4 2017.<br />
• The average asking prices for a Falcon 900EX and 900EX EASy were US$6.4M and<br />
US$18.1M; the average asking price for a Falcon 900LX was US$ 20.8M, remaining<br />
steady from Q4 2017 which had an asking price of US$ 21M.<br />
• The average days on market for the Falcon 900 series was 266 days, decreasing<br />
from 284 days in Q4 2017. This is attributed to various factors, including the number<br />
of new aircraft entering the market, as well as several aircraft are being sold while<br />
“off” market.<br />
• In Q1 2018, there were three Falcon 900 series aircraft transactions, which is less<br />
than that of Q4 2017.<br />
SPECS<br />
Max Range<br />
Max Speed<br />
Typ. Passengers<br />
FOR SALE<br />
No. for Sale<br />
Avg Asking Price<br />
Avg Days on Market<br />
SOLD<br />
Past 12 Months<br />
Past 3 Months<br />
F900DX<br />
4,100 N.M. / 4,500 N.M. / 4,500 N.M. / 4,750 N.M. /<br />
7,593 km 8,334 km 8,334 km 8,800 km<br />
Mach 0.83<br />
12<br />
Reporting quarter vs. Previous quarter<br />
Q1 | Q4<br />
1 | 2<br />
11.5M USD |<br />
11.5M USD<br />
877 | 443<br />
Q1 | Q4<br />
1 | 0<br />
1 | 0<br />
F900EX<br />
Mach 0.83<br />
12<br />
Q1 | Q4<br />
11 | 9<br />
6.4M USD |<br />
6.3M USD<br />
272 | 256<br />
Q1 | Q4<br />
Q1 | Q4<br />
10 | 7<br />
Reporting quarter vs. Previous quarter<br />
12 | 11<br />
1 | 5<br />
F900EX EASy<br />
Mach 0.83<br />
12<br />
17.4M USD |<br />
18.3M USD<br />
191 | 173<br />
Q1 | Q4<br />
2 | 4<br />
0 | 0<br />
F900LX<br />
Mach 0.83<br />
12<br />
Q1 | Q4<br />
4 | 6<br />
20.8M USD |<br />
21.0M USD<br />
432 | 350<br />
Q1 | Q4<br />
6 | 5<br />
1 | 2<br />
FALCON 2000LX/LXS/S<br />
$27.9<br />
$16.2<br />
16<br />
FALCON 2000LXS<br />
MAKE<br />
OFFER<br />
19<br />
Average Asking Price<br />
19<br />
$19.0<br />
For Sale vs. Sold<br />
FALCON 2000S<br />
$17.5<br />
FALCON 2000LX<br />
$12.4<br />
$27.9<br />
$19.0<br />
$13.4<br />
$27.9<br />
$19.4<br />
$14.6<br />
16<br />
14 13<br />
11 10 10 11 10<br />
8 8<br />
4<br />
2 3<br />
1 2<br />
2 1 1 1 2<br />
Mar Jun Sep Dec Mar<br />
2017 2018<br />
Sold<br />
For Sale<br />
1+0+0 1+0+02+0+03+0+04+0+02+0+01+0+02+0+00+0<br />
0+10+00+11+00+10+0<br />
0+8+0 0+8+00+10+00+11+00+13+00+14+00+16+00+19<br />
2+0+0<br />
• There were 10 Falcon 2000 series aircraft on the market for sale, including three<br />
Falcon 2000LX, two Falcon 2000LXS and five Falcon 2000S aircraft, which is similar<br />
to inventory levels in Q4 2017.<br />
• The average asking price for a Falcon 2000LX was US$14.6M; the average asking<br />
prices for a Falcon 2000LXS was US$ 27.9M; and the average asking prices for a<br />
Falcon 2000S was US$19.4M.<br />
• The average days on market for a Falcon 2000 series aircraft mentioned here was<br />
88 days in Q1 2018, decreasing from 95 days in Q4 2017.<br />
• In Q1 2018, there were four transactions of the Falcon 2000 series aircraft, considerably<br />
less than the number in Q4 2017 (six transactions).<br />
SPECS<br />
Max Range<br />
Max Speed<br />
Typ. Passengers<br />
FOR SALE<br />
No. for sale<br />
Avg Asking Price<br />
Avg Days on Market<br />
SOLD<br />
Past 12 Months<br />
Past 3 Months<br />
2000LX<br />
4,000 N.M. /<br />
Mach 0.83<br />
10<br />
Reporting quarter vs. Previous quarter<br />
Q1 | Q4<br />
3 | 4<br />
14.6M USD |<br />
13.4M USD<br />
127 | 104<br />
Reporting quarter vs. Previous quarter<br />
Q1 | Q4<br />
Q1 | Q4<br />
18 | 17<br />
3 | 6<br />
2000LXS<br />
4,000 N.M. /<br />
Mach 0.83<br />
10<br />
Q1 | Q4<br />
2 | 1<br />
27.9M USD |<br />
27.9M USD<br />
51 | 68<br />
1 | 0<br />
1 | 0<br />
2000S<br />
3,350 N.M. /<br />
7,408 km 7,408 km 6,208 km<br />
Mach 0.83<br />
10<br />
Q1 | Q4<br />
5 | 3<br />
19.4M USD |<br />
19.0M USD<br />
79 | 92<br />
Q1 | Q4<br />
0 | 15<br />
0 | 0<br />
Source: JETNET & ASG<br />
48 | ASIAN SKY QUARTERLY — FIRST QUARTER 2018
MARKET SUMMARY -- JETS<br />
FALCON 7X<br />
• There were 22 Falcon 7X aircraft on the market for sale in Q1 2018. The<br />
inventory level has been decreasing over the past year. Most 7Xs available for<br />
sale were manufactured in 2013 and 2012, which account for 41% and 23%,<br />
respectively, of the for-sale fleet.<br />
• The average asking price for a 7X in Q1 2018 was around US$25.8M,<br />
increased by 1.5% from Q4 2017.<br />
• The average days on market for sale in Q1 2018 was around 257 days, which<br />
decreased from 300 days in Q3 2017.<br />
• In Q1 2018, there were eight Falcon 7X transactions, indicating an active preowned<br />
market at the beginning of the year.<br />
SPECS<br />
Max Range<br />
Max Speed<br />
Typ. Passengers<br />
FOR SALE<br />
No. for Sale<br />
Avg Asking Price<br />
Avg Days on Market<br />
5,950 N.M. / 11,018 km<br />
Mach 0.90<br />
12<br />
2018 Q1<br />
22 (8.0%)<br />
25.8M USD<br />
257<br />
2017 Q4<br />
25 (9.2%)<br />
26.6M USD<br />
300<br />
$27.3<br />
31 30 31 31<br />
28<br />
26<br />
3<br />
1 2 2<br />
$24.9<br />
$26.6<br />
24 24 25 25 24 25<br />
$25.8<br />
22<br />
DASSAULT<br />
SOLD<br />
Past 12 Months<br />
Past 3 Months<br />
2018 Q1<br />
22<br />
8<br />
2017 Q4<br />
17<br />
7<br />
Average Asking Price<br />
For Sale vs. Sold<br />
4 4<br />
2 2 2<br />
1<br />
Mar Jun Sep Dec Mar<br />
2+0+04+0+0<br />
1+0+04+0+02+0+00+0+02+0+02+0+03+0+00+0+00+0+01+0+0<br />
0+22+00+25+00+24+0<br />
0+25+0 0+25+00+24+00+24+00+26+00+28+00+31+00+31+00+30+00+31+0<br />
2+0+0<br />
2017 2018<br />
Sold<br />
For Sale<br />
OUR INV<strong>EN</strong>TORY<br />
2010 FALCON 7X<br />
OFF MARKET FOR SALE<br />
AIRCRAFT HIGHLIGHT<br />
• Engine Enrolled on Honeywell ESP Gold<br />
• APU Enrolled on Honeywell MSP Gold<br />
• 12 Passengers Configuration, Fwd / Aft Lavatory<br />
• Part 135, CPDLC, FANS 1A Compliance<br />
• ADSB-Out<br />
• EASy II Avionic Suite<br />
• HUD & EVS<br />
• Honeywell LSS-860 Lightning Sensor System<br />
AVIONICS<br />
• Standard FLY-BY-WIRE (FBW) 2.3.1<br />
• HUD, CVR ,EVS & EVAS<br />
• Honeywell LSS-860 Lightning Sensor System<br />
• PWC Monitoring Data Collection Transmission Unit<br />
• Three (3) Honeywell VHF COMM<br />
• Two (2) Honeywell VHF NAV<br />
• Two (2) Honeywell DF-855 ADF<br />
• Two (2) Honeywell DM-855 DME<br />
• Two (2) Honeywell KHF-1050 HF COMM<br />
• Two (2) Honeywell GPS-90X GPS<br />
• Two (2) Honeywell XS-857A Transponder<br />
• Honeywell WU-880 Weather Radar<br />
• Two (2) Honeywell KRA-405B Radio Altimeter<br />
• Single (1) ACSS TCAS 3000<br />
• Single (1) Honeywell RESCU 406AF ELT<br />
• Single (1) Honeywell MK V EGPW<br />
Source: JETNET & ASG<br />
INTERIOR<br />
• 12 Passenger Configuration<br />
• 17 inches Fwd LCD Monitor<br />
• 17 inches Aft Bulkhead LCD Monitor<br />
• Galley Pocket / Sliding Door<br />
• Aft Cabin Tracking CurtainTwo (2)<br />
• 30 inches Fwd RH Lavatory<br />
• LH 43 inches & 71 inches RH Galley / Bar Area<br />
• Four (4) 20 inches Individual Seats w/ Electrical<br />
Lumbar<br />
• Retractable Dining / Conference Table<br />
ASKING PRICE:<br />
CALL FOR PRICING<br />
sales@asianskygroup.com +852 2235 9222<br />
File Photo<br />
FIRST QUARTER 2018 — ASIAN SKY QUARTERLY | 49
MARKET SUMMARY -- JETS<br />
LINEAGE 1000/E<br />
EMBRAER<br />
$30.0<br />
Average Asking Price<br />
For Sale vs. Sold<br />
$25.1<br />
$28.0<br />
• There were seven Lineage 1000s on market in 2018 Q1, with 29 delivered<br />
aircraft in the fleet, representing 24.1% of the total active fleet. The inventory<br />
level remained the same as Q4 2017.<br />
• The average asking price of the Lineage 1000 in Q1 2018 was US$27.4M; the<br />
same as Q4 2017.<br />
• The asking price range in 2018 Q1 was US$18.5M to US$37.9M.<br />
• The average days on market of the Lineage 1000 was 808 days, increased 9%<br />
from 744 days in Q4 2017.<br />
• In Q1 2018, there was one transaction, up from zero in Q4 2017.<br />
$27.4<br />
$27.4<br />
SPECS<br />
Max Range<br />
Max Speed<br />
Typ. Passengers<br />
FOR SALE<br />
No. for Sale<br />
Avg Asking Price<br />
Avg Days on Market<br />
Lineage 1000<br />
4,400 N.M. / 8,149 km<br />
Mach 0.82<br />
19<br />
2018 Q1<br />
7 (24.1%)<br />
27.4M USD<br />
808<br />
2017 Q4<br />
7 (24.1%)<br />
27.4M USD<br />
744<br />
Lineage 1000E<br />
4,600 N.M. / 8,520 km<br />
Mach 0.82<br />
19<br />
6 6 7 7 7 7 7 7 7 7 7<br />
8<br />
7<br />
Mar Jun Sep Dec Mar<br />
2017 2018<br />
Sold<br />
For Sale<br />
1<br />
SOLD<br />
Past 12 Months<br />
Past 3 Months<br />
2018 Q1<br />
1<br />
1<br />
2017 Q4<br />
0<br />
0<br />
0+0+0 0+0+0 1+0+0 0+0+0 0+0+0 0+0+0 0+0+0 0+0+0 0+0+0 0<br />
0+0+0 0+0+0 0+0+0<br />
0+8+0 0+7+00+<br />
7+00+7+00+7+00+7+00+7+00+7+00+6<br />
0+7+0<br />
50 | ASIAN SKY QUARTERLY — FIRST QUARTER 2018<br />
Source: JETNET & ASG
MARKET SUMMARY -- JETS<br />
LEGACY 600/650<br />
• There were seven Legacy 650s and 13 Legacy 600s on the market for sale, with 96 and<br />
174 operating worldwide. This number represents 7.3% and 7.5%, respectively, of the<br />
total active fleet. The inventory level of the Legacy 650 and 600s remained relatively<br />
stable compared to that of Q4 2017.<br />
• The average asking prices of the Legacy 650 in Q1 2018 was US$11.5M, decreased 4%<br />
from US$12.0M in Q4 2017; the average asking prices of the Legacy 600 in Q1 2018<br />
was US$6.8M, similar to that of Q4 2017.<br />
• The asking price of the Legacy 650 ranged from US$9.95M to US$15M, while the<br />
asking price of a Legacy 600 ranged from US$5.2M to US$9.5M.<br />
• The average days on market for sale of the Legacy 650 and Legacy 600 were 551 days<br />
and 312 days, respectively. The Legacy 650 increased by 12% from 279 in Q4 2017 to<br />
312 in Q1 2018; the Legacy 600 increased by 4% from 529 in Q4 2017 to 551 days in Q1<br />
2018.<br />
• In Q1 2018, there were two transactions of the Legacy 650, increased from one transaction<br />
in Q4 2017; there were three transactions of the Legacy 600, decreased from<br />
eight transactions in Q4 2017.<br />
SPECS<br />
Max Range<br />
Max Speed<br />
Typ. Passengers<br />
FOR SALE<br />
No. for Sale<br />
Avg Asking Price<br />
Avg Days on Market<br />
SOLD<br />
Past 12 Months<br />
Past 3 Months<br />
Legacy 600<br />
3,400 N.M. / 6,297 km<br />
Mach 0.80<br />
13<br />
2018 Q1 2017 Q4<br />
13 (7.5%)<br />
6.8M USD<br />
551<br />
17<br />
3<br />
14 (8.0%)<br />
7.1M USD<br />
529<br />
2018 Q1 2017 Q4<br />
18<br />
8<br />
Legacy 650<br />
3,640 N.M. / 7,112 km<br />
Mach 0.80<br />
13<br />
2018 Q1<br />
7 (7.3%)<br />
11.5M USD 12.0M USD<br />
312<br />
2018 Q1<br />
5<br />
2<br />
2017 Q4<br />
8 (8.4%)<br />
279<br />
2017 Q4<br />
7<br />
1<br />
$14.6<br />
$8.0<br />
42<br />
40<br />
Average Asking Price<br />
For Sale vs. Sold<br />
41<br />
36<br />
Legacy 650<br />
Legacy 600<br />
33<br />
29 30<br />
$12.0<br />
$7.2<br />
24 23 22 22<br />
24<br />
$11.5<br />
$6.8<br />
4 3 5<br />
1 1 1 1 3<br />
5 3<br />
1 1<br />
Mar Jun Sep Dec Mar<br />
2017 2018<br />
For Sale Sold<br />
20<br />
5+0+03+0+01+0+01+0+01+0+01+0+03+0+00+0+04+0+01+0+0<br />
0+20+00+24+0<br />
1+0+0<br />
0+22+0+22+0 0+23+0 0+24+0 0+30+0 0+29+0 0+33+0 0+36+0 0+41+0 0+40+0 0+42+0<br />
EMBRAER<br />
AIRCRAFT SALES<br />
& ACQUISITIONS<br />
AIRCRAFT ACQUISITION & MARKETING<br />
ASIAN SKY GROUP will manage the process of acquiring<br />
an aircraft on your behalf. ASG will research, compare,<br />
recommend and locate the most suitable aircraft<br />
available, assisting in every detail throughout the<br />
purchasing process of such aircraft and in the<br />
negotiation of any contractual matter.<br />
WE CAN ASSIST WITH SELECTION OF:<br />
Aircraft<br />
Asset Financing<br />
Ownership Structure<br />
Registration<br />
Operator<br />
AIRCRAFT INSPECTION & APPRAISALS<br />
ASIAN SKY GROUP will conduct aircraft pre-purchase<br />
inspections and market value appraisals by<br />
coordinating the scheduling work and professionally<br />
reviewing opinions regarding inspections or fair market<br />
value assessments.<br />
For more information contact our sales team<br />
Email: sales@asianskygroup.com<br />
Tel: +852 2235 9222<br />
YOUR BUSINESS AVIATION PARTNER IN ASIA<br />
Source: JETNET & ASG<br />
FIRST QUARTER 2018 — ASIAN SKY QUARTERLY | 51
MARKET SUMMARY -- JETS<br />
G200 & G280<br />
$16.2<br />
$5.2<br />
37<br />
34<br />
Average Asking Price<br />
For Sale vs. Sold<br />
G280<br />
G200<br />
$16.0<br />
$4.9<br />
37<br />
38<br />
34 33 34 33<br />
40<br />
34 34<br />
29 30<br />
$14.0<br />
$4.6<br />
6 5 6<br />
3 4 5<br />
6<br />
3 4<br />
2<br />
3<br />
1 1<br />
Mar Jun Sep Dec Mar<br />
2017 2018<br />
Sold<br />
For Sale<br />
1+0+06+0+0<br />
1+0+02+0+04+0+03+0+05+0+04+0+06+0+03+0<br />
0+34+00+40+00+33+0<br />
0+34+00+38+00+30+00+29+00+34+00+33+00+37+00+34<br />
3+0+0<br />
• There were 32 G200 on market in Q1 2018, accounting for 13.0% of the total<br />
fleet. The inventory level is 1% higher than Q4 2017.<br />
• The average asking price for a G200 in Q1 2018 was US$4.6M, a minor<br />
decrease compare to US$4.9M in Q4 2017.<br />
• The average days on market of the G200 in Q4 2017 was 253 days.<br />
• There were two G280s on market, accounting for 1.9% of the total fleet. The<br />
inventory level has remained the same compared to Q4 2017.<br />
SPECS<br />
Max Range<br />
Max Speed<br />
Typ. Passengers<br />
FOR SALE<br />
No. for Sale<br />
Avg Asking Price<br />
Avg Days on Market<br />
SOLD<br />
Past 12 Months<br />
Past 3 Months<br />
G200<br />
3,050 N.M. / 5,651km<br />
Mach 0.81<br />
8<br />
2018 Q1 2017 Q4<br />
32 (13.0%)<br />
4.6M USD<br />
253<br />
2018 Q1 2017 Q4<br />
40 43<br />
9<br />
32 (13.0%)<br />
4.9M USD<br />
274<br />
7<br />
G280<br />
3,600 N.M. / 6,667 km<br />
Mach 0.84<br />
8<br />
2018 Q1<br />
2 (1.9%)<br />
14.0M USD 16.0M USD<br />
301<br />
2018 Q1<br />
3<br />
1<br />
2017 Q4<br />
2 (1.7%)<br />
371<br />
2017 Q4<br />
2<br />
0<br />
GULFSTREAM<br />
G450<br />
$16.7<br />
27<br />
5<br />
25<br />
Average Asking Price<br />
For Sale vs. Sold<br />
2<br />
34<br />
7<br />
33<br />
1<br />
36<br />
4<br />
34<br />
2<br />
32<br />
6<br />
29<br />
27<br />
$13.8<br />
24<br />
27<br />
21 21<br />
2 3<br />
1 2 2 2<br />
Mar Jun Sep Dec Mar<br />
2017 2018<br />
Sold<br />
For Sale<br />
2+0+0 3+0+01+0+02+0+06+0+02+0+04+0+01+0+07+0<br />
0+21+0 0+21+00+28+0<br />
0+24+00+27+00+29+00+32+00+34+00+36+00+33+00+34<br />
2+0+0<br />
$15.2 SPECS<br />
Max Range<br />
• There were 21 G450s on market for sale in Q1 2018, representing 5.9% of the<br />
total fleet. The inventory level has decreased since Q4 2017.<br />
• The average asking price of a G450 in Q4 2017 was US$14.7M, 5.8% higher<br />
than that of Q4 2017.<br />
• The average days on market in Q4 2017 was 355 days.<br />
• In Q1 2018 there were six G450s sold, with transaction levels lower than that<br />
of Q4, showing signs of stabilization after a period of high transaction activity.<br />
Max Speed<br />
Typ. Passengers<br />
FOR SALE<br />
No. for Sale<br />
Avg Asking Price<br />
Avg Days on Market<br />
SOLD<br />
Past 12 Months<br />
Past 3 Months<br />
34<br />
6<br />
4,350 N.M. / 8,056 km<br />
Mach 0.85<br />
13<br />
2018 Q1 2017 Q4<br />
21 (5.9%)<br />
15.2M USD 13.8M USD<br />
355<br />
24 (6.8%)<br />
330<br />
2018 Q1 2017 Q4<br />
38<br />
6<br />
Source: JETNET & ASG<br />
52 | ASIAN SKY QUARTERLY — FIRST QUARTER 2018
MARKET SUMMARY -- JETS<br />
G550<br />
• There were 19 G550s on market in Q1 2018. The inventory level has been<br />
decreasing in the past year, with a 21% decrease compared to Q4 2017.<br />
• The average asking price for a G550 in Q1 2018 was around US$23.3M,<br />
decreasing 3.1% from Q4 2017.<br />
• In Q1 2018, the average days on market for sale was around 257 days, which<br />
is on the same level compare to Q4 2017.<br />
• In Q1 2018, there were six G550 transactions, reflecting a slower pre-owned<br />
market at the beginning of the year. Transaction activity decreased by 57%<br />
compared to Q4 2017.<br />
SPECS<br />
Max Range<br />
Max Speed<br />
Typ. Passengers<br />
FOR SALE<br />
No. for Sale<br />
Avg Asking Price<br />
Avg Days on Market<br />
SOLD<br />
Past 12 Months<br />
Past 3 Months<br />
6,750 N.M. / 12,501 km<br />
Mach 0.87<br />
18<br />
2018 Q1 2017 Q4<br />
19 (3.5%)<br />
23.3M USD 23.9M USD<br />
257<br />
41<br />
6<br />
24 (4.4%)<br />
258<br />
2018 Q1 2017 Q4<br />
44<br />
14<br />
$24.8<br />
37 37<br />
Average Asking Price<br />
For Sale vs. Sold<br />
38<br />
35<br />
$22.8<br />
35 34<br />
31<br />
$23.9<br />
1+0+03+0+0<br />
0+19+00+17+00+22+0<br />
2+0+0<br />
$23.3<br />
7<br />
5 5 5<br />
3 4<br />
2 2 2 3 3<br />
1 2<br />
Mar Jun Sep Dec Mar<br />
28<br />
24<br />
24<br />
22<br />
17<br />
19<br />
2017 2018<br />
Sold<br />
For Sale<br />
G650 & G650 ER<br />
• There were 12 G650/650ER series aircraft available on market in 2018 Q1.<br />
Reduced from 17 aircraft in 2017 Q4. The major driver of this reduction was<br />
the six aircraft sold in Q1 2018.<br />
• The average asking prices for the G650/650ER models were US$56.9M and<br />
US$62.8M.<br />
• The average days on market for the G650/650ER series was 315 days and 369<br />
days each, decreasing from 388 and 372 days in Q4 2017.<br />
• In Q1 2018, there were five G650 series aircraft transactions. There was one<br />
G650ER transaction in Q1 2018, with none in the previous quarter.<br />
5+0+0 5+0+0 5+0+03+0+02+0+07+0+02+0+02+0+03+0+0<br />
0+24+0 0+24+00+28+00+31+00+34+00+35+00+35+00+38+00+37+00+37+0<br />
4+0+0<br />
GULFSTREAM<br />
SPECS<br />
Max Range<br />
Max Speed<br />
Typ. Passengers<br />
FOR SALE<br />
No. for Sale<br />
Avg Asking Price<br />
Avg Days on Market<br />
G650<br />
7,000 N.M. / 12,964 km<br />
Mach 0.90<br />
18<br />
2018 Q1 2017 Q4<br />
7 (3.5%)<br />
56.9M USD 56.6M USD<br />
315<br />
9 (4.8%)<br />
388<br />
G650ER<br />
7,500 N.M. / 13,890 km<br />
Mach 0.90<br />
18<br />
2018 Q1<br />
5 (5.8%)<br />
62.8M USD<br />
369<br />
2017 Q4<br />
8 (10.0%)<br />
65.2M USD<br />
372<br />
$61.8<br />
$54.9<br />
$57.2<br />
$65.2<br />
$56.6<br />
19<br />
17 18<br />
18<br />
15 16<br />
16 16 17<br />
15<br />
13 12 12<br />
2+0+0 1+0+04+0+00+0+00+0+01+0+01+0+00+0+00+0+02+0+01+0+0<br />
0+12+0 0+12+00+15+0<br />
0+17+00+18+00+16+00+16+00+18+00+19+00+17+00+16+00+15+00+13+0<br />
2+0+0<br />
$62.8<br />
$56.9<br />
SOLD<br />
Past 12 Months<br />
Past 3 Months<br />
2018 Q1 2017 Q4<br />
14<br />
5<br />
12<br />
5<br />
2018 Q1<br />
1<br />
1<br />
2017 Q4<br />
0<br />
0<br />
Average Asking Price<br />
For Sale vs. Sold<br />
1<br />
2 4<br />
1 1 1 2 2 2<br />
Mar Jun Sep Dec Mar<br />
2017 2018<br />
Sold<br />
For Sale<br />
Source: JETNET & ASG<br />
FIRST QUARTER 2018 — ASIAN SKY QUARTERLY | 53
YEAR <strong>EN</strong>D 2017<br />
BUSINESS JETS<br />
• APAC Market Overview<br />
• Market Trends<br />
• Operator Profiles<br />
• Aircraft Spotlight:<br />
Gulfstream G500<br />
SPECIAL FEATURES<br />
• Operator Overview<br />
• OEM Overview<br />
• Greater China Market<br />
CIVIL HELICOPTERS<br />
• APAC Market Overview<br />
• Market Trends<br />
• Operator Profiles<br />
• Aircraft Spotlight:<br />
Airbus H225<br />
SPECIAL FEATURES<br />
• Greater China Market<br />
• APAC Offshore &<br />
Leasing Market<br />
• EMS Helicopter Market<br />
<strong>Asian</strong> <strong>Sky</strong> Media has released its most anticipated reports of the year:<br />
the Asia-Pacific Region Civil Helicopter Fleet Report, and Business<br />
Jet Fleet Report, featuring all new content from aircraft spotlights to<br />
interviews.<br />
Read More on<br />
www.asianskymedia.com<br />
<strong>Asian</strong> <strong>Sky</strong> Media<br />
YEAR <strong>EN</strong>D 2017<br />
ASIAN SKY FLEET REPORT – ASIA PACIFIC REGION CIVIL HELICOPTERS<br />
YEAR <strong>EN</strong>D 2017<br />
ASIA PACIFIC REGION<br />
CIVIL HELICOPTERS<br />
Sponsored by<br />
NOW AVAILABLE
AIRCRAFT POSITIONING<br />
CIVIL HELICOPTERS<br />
Aircraft Acquisition Price vs Maximum Range<br />
8.00<br />
HEAVY<br />
(SUPER) MEDIUM<br />
LIGHT TWIN<br />
SINGLE TURBINE<br />
PISTON<br />
AC313*<br />
S-92<br />
H225<br />
AS332 L1E<br />
4.00<br />
AW189<br />
H175<br />
BELL 412EPI<br />
AW139<br />
S-76C++<br />
S-76D<br />
H155<br />
AC312*<br />
MD 520N<br />
MD 530F<br />
H145<br />
MD 902<br />
H135(T3)<br />
H130<br />
BELL 407<br />
BELL 206L4<br />
MD 500E<br />
BELL 430<br />
AW169<br />
BELL 429<br />
H135(P3)<br />
BELL 407GXP<br />
H125<br />
AC311*<br />
H120<br />
MD 600N<br />
EC145<br />
AW 109 GN<br />
AW109 POWER<br />
AW119KX<br />
2.00<br />
1.00<br />
0.50<br />
0.25<br />
200<br />
250<br />
300<br />
350<br />
400<br />
450<br />
500<br />
550<br />
600<br />
650<br />
700<br />
750<br />
AIRCRAFT ACQUISTION PRICE (MILLION USD)<br />
S-333<br />
<strong>EN</strong>480B<br />
R66<br />
R44 RAV<strong>EN</strong> II<br />
R22 BETA II<br />
MAX RANGE (N.M.)<br />
* The estimated total yearly cost is based on aircraft ownership cost for 10 years including financing, plus yearly operating cost and regional adjustments.<br />
Source: Conklin & de Decker 2017<br />
56 | ASIAN SKY QUARTERLY — FIRST QUARTER 2018
MARKET SUMMARY PER MODEL — CIVIL HELICOPTERS<br />
INV<strong>EN</strong>TORY LEVEL, PRICE TR<strong>EN</strong>D & TRANSACTIONS<br />
EC135T2 & P2<br />
• For the EC135 T2 model, the overall inventory level of the market increased<br />
from three in Q4 2017 to six in Q1 2018, accounting for 4.2% of the overall<br />
fleet in operation.<br />
• For the EC135 P2 model, inventory level of the market remained at 11 in Q1<br />
2018, accounting for 7.2% of the overall fleet in operation.<br />
• Average asking price increased from US$2.3M in Q4 2017 to US$2.4M in Q1<br />
2018 for T2, awhile the SP model’s asking price decreased from US$2.7M in<br />
Q4 2017 to US$2.6M in Q1 2018.<br />
• There was one EC135 T2 transaction and no EC135 P2 transactions in Q1<br />
2018.<br />
SPECS<br />
Max Range<br />
Max Speed<br />
Typ. Passengers<br />
FOR SALE<br />
No. for Sale<br />
Avg Asking Price<br />
Avg Days on Market<br />
SOLD<br />
Past 12 Months<br />
Past 3 Months<br />
EC135T2<br />
332 N.M. / 614 km<br />
127 Knots<br />
6<br />
2018 Q1 2017 Q4<br />
6 (4.2%)<br />
2.4M USD<br />
533<br />
1<br />
1<br />
3 (2.1%)<br />
2.3M USD<br />
939<br />
2018 Q1 2017 Q4<br />
1<br />
0<br />
EC135P2<br />
332 N.M. / 614 km<br />
127 Knots<br />
6<br />
2018 Q1<br />
11 (7.2%)<br />
2.6M USD<br />
899<br />
2018 Q1<br />
0<br />
0<br />
2017 Q4<br />
11 (7.2%)<br />
2.7M USD<br />
827<br />
2017 Q4<br />
2<br />
0<br />
$2.6<br />
$1.8<br />
16<br />
14<br />
Average Asking Price<br />
EC135P2<br />
EC135T2<br />
For Sale vs. Sold<br />
14<br />
11 12<br />
MARKET SUMMARY -- HELICOPTERS<br />
11 11<br />
$2.7<br />
$2.6<br />
$2.3 $2.4<br />
14 14 14 15 15<br />
Mar Jun Sep Dec Mar<br />
2017 2018<br />
Sold<br />
For Sale<br />
17<br />
1<br />
0+0+0 0+0+0 0+0+0 0+0+0 0+0+0 0+0+0 0+0+0 0+0+0 0+0+00+0<br />
0+0+0 0+0+0<br />
0+17+00+15+00+15+0<br />
0+14+0 0+14+0 0+14+00+11+00+11+00+12+00+11+00+14+00+14+00+16+0<br />
1+0+0<br />
OUR INV<strong>EN</strong>TORY<br />
2006 EC135P2 SN0437<br />
875 HOURS SINCE NEW<br />
2,483 LANDINGS SINCE NEW<br />
AIRCRAFT HIGHLIGHT<br />
• VIP Configuration<br />
• Air Conditioning<br />
• Pop-Out Floats<br />
• Emergency Locator Transmitter<br />
• Auto Pilot (SAS)<br />
• Dual Pilot Controls<br />
• SP/DP IFR<br />
• No Damage History<br />
AIRBUS<br />
AVIONICS<br />
Dual Pilot IFR Solution 7, comprising:<br />
• One (1) MEGHAS Flight Control Display<br />
System(FCDS) Dual<br />
• One (1) Honeywell HF KTR 993 Tranceiver<br />
• Two (2) Honeywell KTR 908 VHF AM Transceiver<br />
• One (1) Honeywell KFS 594 HF Control Unit<br />
• Two (2) Honeywell KFS 598AVHF AM Control<br />
• Two (2) Thales ADU 3000 Air Data<br />
• One (1) Becker Avionic IC 3100 Flight Control Display<br />
(FCD) Intercom<br />
• Two (2) Thales Module<br />
• Two (2) Honeywell KNR 634A NAV Receiver<br />
• One (1) Honeywell ADF DF 431B Receiver<br />
• One (1) Honeywell DM44AB DME Transceiver<br />
Source: JETNET & ASG<br />
INTERIOR<br />
• Covers for Sliding Door Fairing LH & RH<br />
• Map Case in Sliding Doors LH & RH<br />
• Variable Tie-down Web for Luggage Securing<br />
• Cabin/Cargo Compartment Separation Wall with<br />
Smoke Detector in Cargo Compartment<br />
• Enhanced Soundproofing Kit<br />
• VIP Pilot and Co-pilot Seats instead of Stantard<br />
Crew Seats<br />
• 4 VIP Passenger Seats (2 front, 2 rear)<br />
ASKING PRICE:<br />
CALL FOR PRICING<br />
sales@asianskygroup.com +852 2235 9222<br />
FIRST QUARTER 2018 — ASIAN SKY QUARTERLY | 57
MARKET SUMMARY -- HELICOPTERS<br />
EC145<br />
$4.4<br />
11 11<br />
Average Asking Price<br />
For Sale vs. Sold<br />
10<br />
9<br />
1 1 1 2<br />
$5.0<br />
8 9 9 9 9 9 8 9 8<br />
$3.8<br />
Mar Jun Sep Dec Mar<br />
2017 2018<br />
Sold<br />
For Sale<br />
0+0+0 0+0+0 0+0+02+0+01+0+00+0+01+0<br />
0+9+0 0+9+0 0+9+0 0+9+0 0+9+00+8+00+9+00+10<br />
0+0+0<br />
0+0+0 0+0+0 0+8+00+9+00+8+0<br />
0+0+0<br />
• The overall inventory level of the market decreased from nine in Q4 2017 to<br />
eight in Q1 2018, accounting for 1.0% of the overall fleet in operation.<br />
• Average days on market decreased from 430 in Q4 2017 to 399 in Q1 2018,<br />
due to new aircraft entering the market.<br />
• Average asking price decreased from US$5.0M in Q4 2017 to US$3.8M in Q1<br />
2018.<br />
• There were no transactions in Q1 2018.<br />
SPECS<br />
Max Range<br />
Max Speed<br />
Typ. Passengers<br />
FOR SALE<br />
No. for Sale<br />
Avg Asking Price<br />
Avg Days on Market<br />
SOLD<br />
Past 12 Months<br />
Past 3 Months<br />
461 N.M. / 855 km<br />
131 Knots<br />
9<br />
2018 Q1<br />
8 (1.0%)<br />
3.8M USD<br />
430<br />
2018 Q1<br />
5<br />
0<br />
2017 Q4<br />
9 (1.2%)<br />
5.0M USD<br />
399<br />
2017 Q4<br />
6<br />
0<br />
EC155B & H155<br />
AIRBUS<br />
$3.5<br />
$3.3<br />
24 24<br />
24<br />
+0 0+0+0 0+0+0<br />
Average Asking Price<br />
For Sale vs. Sold<br />
22<br />
H155<br />
EC155B<br />
21 22 23<br />
0+0+0 0+0+0 0+0+01+0+00+0+00+0+00+0+00+0+00<br />
0+24+00+19+00+20+00+22+00+22+00+21+00+22+00+24<br />
0+0+0<br />
24<br />
22 22<br />
20 20<br />
0+20+0 0+22+0 0+23+0<br />
EC155B<br />
• The overall inventory level of the market remained at 8 in Q1 2018, accounting<br />
for 28.6% of the overall fleet in operation. Average days on market<br />
increased from 878 in Q4 2017 to 992 in Q1 2018. Average asking price<br />
dropped from US$3.3M in Q4 2017 to US$2.0M in Q1 of 2018. There were no<br />
transactions in Q1 2018.<br />
H155<br />
• The overall inventory level of the market remained at 12 in Q1 2018,<br />
accounting for 8.4% of the overall fleet in operation. Average days on market<br />
increased from 647 in Q4 2017 to 730 in Q1 2018. Average asking price<br />
increased from US$4.8M in Q4 2017 to US$5.6M in Q1 2018. There were no<br />
transaction in Q1 2018.<br />
Mar Jun Sep Dec Mar<br />
2017 2018<br />
Sold<br />
For Sale<br />
19<br />
$4.8<br />
$3.3<br />
$5.6<br />
$2.0<br />
SPECS<br />
Max Range<br />
Max Speed<br />
Typ. Passengers<br />
FOR SALE<br />
No. for Sale<br />
Avg Asking Price<br />
Avg Days on Market<br />
EC155B<br />
516 N.M. / 955 km<br />
135 Knots<br />
13<br />
2018 Q1 2017 Q4<br />
8 (28.6%)<br />
2.0M USD<br />
992<br />
11 (36.7%)<br />
3.3M USD<br />
878<br />
H155<br />
516 N.M. / 955 km<br />
150 Knots<br />
13<br />
2018 Q1<br />
12 (8.4%)<br />
5.6M USD<br />
730<br />
2017 Q4<br />
13 (9.1%)<br />
4.8M USD<br />
647<br />
1<br />
SOLD<br />
Past 12 Months<br />
Past 3 Months<br />
2018 Q1 2017 Q4<br />
0<br />
0<br />
0<br />
0<br />
2018 Q1<br />
1<br />
0<br />
2017 Q4<br />
3<br />
1<br />
58 | ASIAN SKY QUARTERLY — FIRST QUARTER 2018<br />
Source: JETNET & ASG
MARKET SUMMARY -- HELICOPTERS<br />
AS332L1 & H225<br />
AS332L1<br />
• The overall inventory level of the market was three, accounting for 4.5% of the<br />
overall fleet in operation. Average days on market increased from 849 in Q4<br />
2017 to 1020 in Q1 2018. Average asking price dropped from US$8.5M in Q4<br />
2017 to US$4.0M in Q1 2018. There were no transactions in Q1 2018.<br />
H225<br />
• The overall inventory level of the market remained at 15, accounting for 9.0%<br />
of the overall fleet in operation. Average days on market increased from 394<br />
in Q4 2017 to 436 in Q1 2018. Average asking price decreased from US$25.8M<br />
in Q4 2017 to US$19M in Q1 2018. There was one transaction in Q1 2018.<br />
SPECS<br />
Max Range<br />
Max Speed<br />
Typ. Passengers<br />
AS332L1<br />
452 N.M. / 837 km<br />
142 Knots<br />
19<br />
H225<br />
452 N.M. / 837 km<br />
142 Knots<br />
19<br />
$25.8<br />
H225<br />
$8.5 $8.5<br />
12 12<br />
12<br />
15<br />
AS332L1<br />
14<br />
16 16<br />
$22.4<br />
$19.0<br />
$4.0<br />
FOR SALE<br />
No. for Sale<br />
Avg Asking Price<br />
Avg Days on Market<br />
2018 Q1 2017 Q4<br />
3 (4.5%)<br />
4.0M USD<br />
1020<br />
4 (6.0%)<br />
8.5M USD<br />
849<br />
2018 Q1<br />
15 (9.0%)<br />
19.0M USD<br />
436<br />
SOLD<br />
Past 12 Months<br />
Past 3 Months<br />
2018 Q1 2017 Q4<br />
0 0<br />
0<br />
0<br />
2018 Q1<br />
1<br />
1<br />
2017 Q4<br />
14 (8.4%)<br />
25.8M USD<br />
394<br />
2017 Q4<br />
0<br />
0<br />
Average Asking Price<br />
For Sale vs. Sold<br />
18 18 18 18 19 18<br />
Mar Jun Sep Dec Mar<br />
2017 2018<br />
For Sale Sold<br />
1<br />
1+0+00+0+00+0+00+0+00+0+00+0+00+0+00+0+00+0+00+0<br />
0+0+0 0+0+0<br />
0+18+00+19+0 0+18+0 0+18+0 0+18+00+16+00+16+00+14+00+15+00+12+00+12+00+12+0<br />
0+0+0<br />
AIRBUS<br />
Source: JETNET & ASG<br />
FIRST QUARTER 2018 — ASIAN SKY QUARTERLY | 59
MARKET SUMMARY -- HELICOPTERS<br />
BELL 412EP/412HP<br />
Bell 412EP<br />
• Inventory level decreased from 30 in Q4 2017 to 29 in Q1 2018, accounting for<br />
5.3% of the overall fleet in operation. Average days on market increased from<br />
453 in Q4 2017 to 547 in Q1 2018. Average asking price decreased slightly<br />
from US$5.2M in Q4 2017 to US$4.9M in Q1 2018. There were four transactions<br />
during Q1 2018.<br />
SPECS<br />
Max Range<br />
Max Speed<br />
Typ. Passengers<br />
FOR SALE<br />
No. for Sale<br />
Avg Asking Price<br />
Avg Days on Market<br />
Bell 412EP<br />
356 N.M. / 659 km<br />
140 Knots<br />
9<br />
Bell 412HP<br />
349 N.M. / 646 km<br />
133 Knots<br />
14<br />
6<br />
1 2 1<br />
SOLD<br />
Past 12 Months<br />
Past 3 Months<br />
4+0+01+0+0<br />
2+0+06+0+01+0+03+0+01+0+00+0+01+0+01+0<br />
0+32+00+33+0 0+33+00+35+00+37+00+36+00+36+00+29+00+33+00+28<br />
0+0+0<br />
FEATURED AIRCRAFT<br />
BELL 429<br />
2008 EC155B1 SN6825<br />
• The overall inventory level of the market decreased from 17 in Q4 2017 to 16<br />
in Q1 2018, accounting for 5.1% of the overall fleet in operation.<br />
• Average days on market increased from 314 in Q4 2017 to 343 in Q1 2018.<br />
• Average asking price remained at US$5.4M in Q1 2018.<br />
• There were four transactions in Q1 2018.<br />
BELL<br />
$5.5<br />
$3.5<br />
23<br />
$5.4<br />
Bell 412HP<br />
• The overall inventory level of the market remained at three in Q1 2018,<br />
accounting for 4.9% of the overall fleet in operation. Average days on market<br />
decreased from 187 in Q4 2017 to 282 in Q1 2018. Average asking price<br />
remained at US$3.0M in Q1 2018. There was one transaction in Q1 2018.<br />
25<br />
12 12<br />
Average Asking Price<br />
$5.8<br />
BELL 412EP<br />
BELL 412HP<br />
For Sale vs. Sold<br />
33<br />
28 29<br />
2018 Q1 2017 Q4<br />
29 (5.3%)<br />
4.9M USD<br />
547<br />
30 (5.4%)<br />
5.2M USD<br />
453<br />
2018 Q1<br />
3 (4.9%)<br />
3.0M USD<br />
282<br />
2017 Q4<br />
3 (4.9%)<br />
3.0M USD<br />
187<br />
3<br />
1<br />
1<br />
36 36 37<br />
1<br />
3<br />
35<br />
$5.2<br />
33 33 33 32<br />
4<br />
$4.9<br />
$3.0 $3.0<br />
Mar Jun Sep Dec Mar<br />
2017 2018<br />
Sold<br />
For Sale<br />
2018 Q1 2017 Q4<br />
18 16<br />
4<br />
8<br />
2018 Q1<br />
5<br />
1<br />
2017 Q4<br />
4<br />
1<br />
Average Asking Price<br />
$5.5<br />
For Sale vs. Sold<br />
$5.3<br />
$5.4<br />
15 16 16 17 17 17<br />
15 15<br />
16 15 16<br />
3+0+01+0+0<br />
0+0+0 0+0+0 0+0+01+0+00+0+01+0+00+0+00+0<br />
0+16+00+15+00+16+0<br />
0+17+0 0+17+0 0+17+00+15+00+15+00+16+00+16+00+15<br />
0+0+0<br />
SPECS<br />
Max Range<br />
Max Speed<br />
Typ. Passengers<br />
FOR SALE<br />
No. for Sale<br />
Avg Asking Price<br />
Avg Days on Market<br />
368 N.M. / 681 km<br />
130 Knots<br />
7<br />
2018 Q1<br />
16 (5.1%)<br />
5.4M USD<br />
343<br />
2017 Q4<br />
17 (5.6%)<br />
5.3M USD<br />
314<br />
1 1 1 1<br />
Mar Jun Sep Dec Mar<br />
2017 2018<br />
Sold<br />
For Sale<br />
3<br />
SOLD<br />
Past 12 Months<br />
Past 3 Months<br />
2018 Q1<br />
7<br />
4<br />
2017 Q4<br />
3<br />
0<br />
60 | ASIAN SKY QUARTERLY — FIRST QUARTER 2018<br />
Source: JETNET & ASG
MARKET SUMMARY -- HELICOPTERS<br />
A109E POWER/A109SP GRANDNEW<br />
• For the AW109E POWER model, the overall inventory level of the market<br />
decreased from 60 in Q4 2017 to 55 in Q1 2018, accounting for 14.7% of the<br />
overall fleet in operation.<br />
• For the AW109E SP model, inventory level of the market decreased from<br />
nine in Q4 2017 to eight in Q1 2018, accounting for 5.2% of the overall fleet in<br />
operation.<br />
• For the POWER Model, the average asking price decreased from US$1.9M in<br />
Q4 2017 to US$1.7M in Q1 2018. For the SP model, the average asking price<br />
decreased from US$4.4M USD in Q4 2017 to US$4.3M in Q1 2018.<br />
• There were nine AW109E POWER transactions and no AW109E SP transactions<br />
in Q1 2018.<br />
Average Asking Price<br />
$4.8<br />
A109SP GRANDNEW<br />
$4.3 $4.3<br />
SPECS<br />
Max Range<br />
Max Speed<br />
Typ. Passengers<br />
A109E Power<br />
353 N.M. / 654 km<br />
139 Knots<br />
7<br />
A109SP Grandnew<br />
480 N.M. / 889 km<br />
130 Knots<br />
7<br />
$2.1 $1.9 $1.7<br />
A109E Power<br />
FOR SALE<br />
No. for Sale<br />
Avg Asking Price<br />
Avg Days on Market<br />
SOLD<br />
Past 12 Months<br />
Past 3 Months<br />
2018 Q1 2017 Q4<br />
55 (14.7%) 60 (16.1%)<br />
1.7M USD 1.9M USD<br />
600 585<br />
2018 Q1 2017 Q4<br />
2<br />
0<br />
3<br />
1<br />
2018 Q1<br />
8 (5.2%)<br />
4.3M USD<br />
562<br />
2018 Q1<br />
21<br />
9<br />
2017 Q4<br />
9 (5.9%)<br />
4.3M USD<br />
435<br />
2017 Q4<br />
21<br />
3<br />
58<br />
For Sale vs. Sold<br />
62<br />
61<br />
66<br />
66 67 67<br />
70 71 69 69<br />
65<br />
1 2 2 1 3 1 3 5<br />
1 3 2<br />
Mar Jun Sep Dec Mar<br />
2017 2018<br />
For Sale Sold<br />
63<br />
3+0+01+0+00+0+02+0+03+0+02+0+00+0+02+0+01+0+01+0+0<br />
0+63+00+65+00+69+00+69+00+71+00+70+00+67+00+67+00+66+00+66+00+61<br />
0+62+00+58+0<br />
5+0+0<br />
AW139<br />
• The overall inventory level of the market increased from 24 in Q4 2017 to 29 in<br />
Q1 2018, accounting for 3.5% of the overall fleet in operation.<br />
• Average days on market decreased slightly from 442 in Q4 2017 to 436 in Q1<br />
2018.<br />
• Average asking price decreased from US$7.8M in Q4 2017 to US$7.3M in Q1<br />
2018.<br />
• There was one transaction in Q1 2018.<br />
SPECS<br />
Max Range<br />
Max Speed<br />
Typ. Passengers<br />
FOR SALE<br />
No. for Sale<br />
Avg Asking Price<br />
Avg Days on Market<br />
568 N.M. / 1,052 km<br />
140 Knots<br />
15<br />
2018 Q1<br />
29 (3.5%)<br />
7.3M USD<br />
436<br />
2017 Q4<br />
24 (2.9%)<br />
7.8M USD<br />
442<br />
$8.3<br />
Average Asking Price<br />
$8.6<br />
For Sale vs. Sold<br />
$7.8<br />
28 28<br />
26 26<br />
23 23 24 24 25 24 23 24<br />
0+0+0 1+0+00+0+00+0+00+0+00+0+00+0+00+0+01+0+00+0+01+0+0<br />
0+29+00+24+00+23+0<br />
0+24+00+25+00+24+00+26+00+26+00+28+00+28+00+24+00+23+00+23+0<br />
0+0+0<br />
$7.3<br />
29<br />
LEONARDO<br />
SOLD<br />
Past 12 Months<br />
Past 3 Months<br />
2018 Q1<br />
3<br />
1<br />
2017 Q4<br />
3<br />
1<br />
1 1<br />
1 1<br />
Mar Jun Sep Dec Mar<br />
2017 2018<br />
Sold<br />
For Sale<br />
Source: JETNET & ASG<br />
FRIST FIRST QUARTER 2018 — ASIAN SKY QUARTERLY | 61
MARKET SUMMARY -- HELICOPTERS<br />
S-76C+ / S-76C++<br />
S76C+<br />
• The overall inventory level of the market dropped from 30 in Q4 2017 to 27 in<br />
Q1 2018, with the for sale fleet representing 18.6% of the overall fleet. The<br />
average days on market increased from 732 in Q4 2017 to 802 in Q1 2018.The<br />
average asking price decreased from US$3.1M in Q4 2017 to US$2.3M in Q1<br />
2018. There were five transactions during Q1 2018.<br />
$7.3<br />
$3.8<br />
47<br />
Average Asking Price<br />
S-76C++<br />
S-76C+<br />
$4.9<br />
$3.1<br />
$6.4<br />
For Sale vs. Sold<br />
56 56<br />
52<br />
49 49<br />
51<br />
53 53<br />
55<br />
52 54 53<br />
5 5<br />
2 2 1 1 2<br />
2<br />
$2.3<br />
Mar Jun Sep Dec Mar<br />
2017 2018<br />
For Sale Sold<br />
2+0+05+0+0<br />
0+0+02+0+00+0+01+0+01+0+00+0+00+0+02+0<br />
0+53+00+54+00+52+0<br />
0+56+00+55+00+56+00+53+00+53+00+51+00+52+00+49<br />
0+0+0<br />
S76C++<br />
• The overall inventory level of the market remained at 26, accounting for 12.4%<br />
of the overall fleet in operation. Average days on market increased from 453<br />
days in Q4 2017 to 537 days in Q1 2018. Average asking price increased from<br />
US$4.9M in Q4 2017 to US$6.4M in Q1 2018. There were two transactions<br />
during the Q1 2018.<br />
SPECS<br />
Max Range<br />
Max Speed<br />
Typ. Passengers<br />
FOR SALE<br />
2017 Q4<br />
No. for Sale<br />
Avg Asking Price<br />
Avg Days on Market<br />
SOLD<br />
Past 12 Months<br />
Past 3 Months<br />
S-76C+<br />
335 N.M. / 620 km<br />
155 Knots<br />
12<br />
2018 Q1 2017 Q4<br />
27 (18.6%)<br />
2.3M USD<br />
802<br />
2018 Q1 2017 Q4<br />
8<br />
1<br />
30 (20.7%)<br />
3.1M USD<br />
732<br />
8<br />
1<br />
S-76C++<br />
335 N.M. / 620 km<br />
155 Knots<br />
12<br />
2018 Q1<br />
26 (12.4%)<br />
6.4M USD<br />
537<br />
2018 Q1<br />
6<br />
2<br />
2017 Q4<br />
26 (12.4%)<br />
4.9M USD<br />
453<br />
2017 Q4<br />
5<br />
1<br />
OUR INV<strong>EN</strong>TORY<br />
2001 S76C+ SN760521<br />
10,357 HOURS SINCE NEW<br />
AIRCRAFT HIGHLIGHT<br />
• Freon Air Conditioning<br />
• Utility Configured<br />
• Emergency Pop-Out Floats & Windows<br />
SIKORSKY<br />
AVIONICS<br />
• Honeywell SPZ-7600 DAFCS / Proline II<br />
• Collins ADF-462<br />
• Dual Collins VHF-22A Communication Radios<br />
• Collins DME-42<br />
• Dual Collins VIR-32 Navigation Radios<br />
• Dual AHRS<br />
• GPS Trimble2101 VHF Navigation Radio System<br />
• Honeywell Primus WL-440 Weather Radar<br />
• Penny & Giles 2000 CVR/FDR<br />
• Honeywell EDZ-756 5x6-inch<br />
• TSO-C113 Integrated Instrument Display System<br />
• Collins ALT-55B Radio Altimeter<br />
• LCR-92 Altitude Heading Reference System<br />
62 | ASIAN SKY QUARTERLY — FIRST QUARTER 2018<br />
INTERIOR<br />
• Twelve (12) passenger utility interior with soundproofing.<br />
Featuring upholstered seating and cabin<br />
protection flooring.<br />
ASKING PRICE:<br />
CALL FOR PRICING<br />
sales@asianskygroup.com +852 2235 9222<br />
Source: JETNET & ASG
MARKET SUMMARY -- HELICOPTERS<br />
OUR INV<strong>EN</strong>TORY<br />
2005 S76C+ SN760592<br />
10,357 HOURS SINCE NEW<br />
AIRCRAFT HIGHLIGHT<br />
• OGP Compliant<br />
• Enrolled on SBH & PAP<br />
AVIONICS<br />
• Primus 440 Weather Radar<br />
• Penny & Giles Flight Data Recorder (FDR)<br />
• Penny & Giles Cockpit Voice Recorder (CVR)<br />
• Penny & Giles Air Data<br />
• Collins TDR 90 Trasponder Mode A/C<br />
• BC Goodrich AD1355D w/ JET Standby Power Supply<br />
• Collins Radio Altimeter<br />
• Caledonian Airborne Systems CPT-900 Emergency<br />
Locator Transmitter (ADELT)<br />
• Dual Life LCR92S AHRS<br />
• Dukane Underwater Locator Beacon<br />
• Trimble Free Flight 2101 GPS<br />
INTERIOR<br />
• Twelve (12) passenger interior with tan leather seating<br />
complete with space for two (2) stretchers.<br />
• Additional accessories include passenger ear<br />
protectors & HEEL system.<br />
ASKING PRICE:<br />
CALL FOR PRICING<br />
sales@asianskygroup.com +852 2235 9222<br />
S-92<br />
• The overall inventory level of the market increased from eight in Q4 2017 to<br />
nine in Q1 2018, accounting for 3.2% of the overall fleet in operation.<br />
• Average days on market increased from 524 in Q4 2017 to 557 in Q1 2018.<br />
• Average asking price decreased from US$16.9M in Q4 2017 to US$16.7M in<br />
Q1 2018.<br />
• There was no transaction during Q1 2018.<br />
SPECS<br />
Max Range<br />
Max Speed<br />
Typ. Passengers<br />
FOR SALE<br />
No. for Sale<br />
Avg Asking Price<br />
Avg Days on Market<br />
474 N.M. / 877 km<br />
155 Knots<br />
19<br />
2018 Q1<br />
9 (3.2%)<br />
16.7M USD<br />
557<br />
2017 Q4<br />
8 (2.8%)<br />
16.9M USD<br />
524<br />
$16.7<br />
0+0+0 0+0+0 0+0+0 0+0+0 0+0+0 0+0+0 0+0+0 0+0+0 1+0+0 0+0<br />
1+0+00+0+0<br />
0+9+0 0+9+0 0+8+0 0+8+0+7+00+7+00+7+00+7+00+6+00+5+00+5+0<br />
+0<br />
SOLD<br />
Past 12 Months<br />
Past 3 Months<br />
2018 Q1<br />
2<br />
0<br />
2017 Q4<br />
2<br />
0<br />
SIKORSKY<br />
Source: JETNET & ASG<br />
$23.3<br />
5 5<br />
1<br />
Average Asking Price<br />
For Sale vs. Sold<br />
$16.9<br />
6 7 7 7 7 8 8 8 8 9 9<br />
1<br />
Mar Jun Sep Dec Mar<br />
2017 2018<br />
Sold<br />
For Sale<br />
FIRST QUARTER 2018 — ASIAN SKY QUARTERLY | 630+0+0
OTHER FEATURED AIRCRAFT<br />
FIXED WING<br />
MODEL<br />
Bombardier - Challenger 300<br />
Bombardier - Challenger 300<br />
Bombardier - Learjet 60XR<br />
Bombardier - Learjet 60XR<br />
Cessna - Citation CJ2<br />
Cessna - Excel<br />
Cessna - Citation Sovereign<br />
Cessna - Citation Sovereign<br />
Cessna - Citation XLS+<br />
Dassault Falcon - 900DX<br />
Dassault Falcon - 900EX<br />
Dassault Falcon - 900EX EASy<br />
Embraer - Phenom 100<br />
Gulfstream - G200<br />
Gulfstream - G200<br />
Gulfstream - G200<br />
Gulfstream - G450<br />
Gulfstream - G450<br />
Gulfstream - G500<br />
YEAR<br />
2005<br />
2007<br />
2010<br />
2011<br />
2004<br />
2001<br />
2005<br />
2005<br />
2011<br />
2006<br />
2007<br />
2008<br />
2014<br />
2005<br />
2007<br />
2008<br />
2013<br />
2013<br />
2006<br />
HOURS<br />
4,759<br />
4,464<br />
2,502<br />
1,163<br />
3,641<br />
4,712<br />
4,823<br />
2,792<br />
2,011<br />
3,460<br />
3,560<br />
3,277<br />
1,354<br />
3,929<br />
2,229<br />
3,309<br />
1,750<br />
1,750<br />
3,120<br />
PASS<strong>EN</strong>GERS<br />
8<br />
8<br />
6<br />
8<br />
6<br />
8<br />
8<br />
10<br />
8<br />
16<br />
11<br />
14<br />
4<br />
9<br />
9<br />
9<br />
14<br />
14<br />
18<br />
ASKING (USD)<br />
Make Offer<br />
Make Offer<br />
3 495 000<br />
Make Offer<br />
Make Offer<br />
Make Offer<br />
Make Offer<br />
Make Offer<br />
Make Offer<br />
Make Offer<br />
19 950 000<br />
19 950 000<br />
Make Offer<br />
Call for Pricing<br />
6 900 000<br />
Make Offer<br />
Make Offer<br />
Make Offer<br />
Make Offer<br />
ROTARY<br />
MODEL<br />
AgustaWestland - A109E Power<br />
AgustaWestland - A109E Power<br />
AgustaWestland - A109E Power<br />
Airbus Helicopters - EC135 P2+<br />
Airbus Helicopters - EC135 P2+<br />
Airbus Helicopters - EC135 T2<br />
Airbus Helicopters - EC135 T2+<br />
Airbus Helicopters - EC145<br />
Sikorsky - S92A<br />
YEAR<br />
2002<br />
2006<br />
2011<br />
2015<br />
2013<br />
2002<br />
2009<br />
2006<br />
2011<br />
HOURS<br />
2,171<br />
2,915<br />
1,179<br />
403<br />
1,308<br />
1,950<br />
1,163<br />
3,225<br />
4,128<br />
CONFIG/PASS<strong>EN</strong>GER<br />
Utility: 6<br />
EMS: 6<br />
EMS: 6<br />
VIP: 4<br />
EMS: 5<br />
VIP: 5<br />
Utility: 7<br />
VIP: 8<br />
Utility: 19<br />
ASKING (USD)<br />
Make Offer<br />
1 595 000<br />
2 950 000<br />
Make Offer<br />
Make Offer<br />
Make Offer<br />
Make Offer<br />
1 950 000<br />
Make Offer<br />
For inquiries, please contact sales@asianskygroup.com<br />
ASIAN SKY CONSULTING<br />
INDEP<strong>EN</strong>D<strong>EN</strong>T BUSINESS AVIATION CONSULTING SERVICES<br />
TRANSACTION ADVISORY<br />
Handle the negotiation, drafting, review and translation of<br />
any aviation contractual documents to ensure the<br />
best terms are achieved.<br />
OPERATION ADVISORY<br />
Perform invoice analysis, recommend operator structure<br />
and provide self-management services.<br />
MARKET RESEARCH & STUDIES<br />
Perform aviation market research, feasibility studies<br />
and business planning.<br />
COMPLETION MANAGEM<strong>EN</strong>T<br />
Generate the cabin definition, select the facility, handle green<br />
aircraft delivery, carry out completion oversight and conduct<br />
aircraft final delivery & compliance<br />
Please contact our sales team for more information<br />
E-mail: sales@asianskygroup.com<br />
Tel: +852 2235 9222<br />
64 | ASIAN SKY QUARTERLY — FIRST QUARTER 2018<br />
Source: JETNET & ASG
THE HOME OF PRIVATE AVIATION<br />
AT THE SPEED OF BUSINESS<br />
Passion for excellence is our trademark. In everything we do, our goal<br />
is to meet and surpass your expectations. Our highly trained staff are<br />
always on hand to ensure your complete satisfaction, both on the ground<br />
and in the air. Our unrivalled facilities located at Dubai World Central<br />
guarantee your utmost discretion, comfort and convenience<br />
every time you fly.<br />
T: +971 (0)4 870 1800 | www.dc-aviation.ae | An Al-Futtaim Joint Venture<br />
Al Maktoum International Airport | DWC | Aviation District | Dubai, UAE<br />
Source: JETNET & ASG
IT RAISES<br />
THE BAR<br />
WIDER.<br />
Get ready to experience the largest, tallest and widest cabin in business aviation. The Falcon 6X has a 5,500 nm (10,186 km) range and a top speed of<br />
Mach .90. In setting a higher, wider standard, it truly stands alone. Falcon 6X.The roomiest, most productive 5,500 nm you’ll ever experience.<br />
WWW.DASSAULTFALCON.COM<br />
BEIJING: +86 10 5696 5200 I HONG KONG: +852 3621 0522 I SHANGHAI: +86 189 1157 7115