Transpiration and the Ascent
Transpiration and the Ascent
Transpiration and the Ascent

Create successful ePaper yourself
Turn your PDF publications into a flip-book with our unique Google optimized e-Paper software.
232 7. <strong>Transpiration</strong><br />
per day. However, <strong>the</strong> actual evaporation usually is only about 80% of <strong>the</strong> <strong>the</strong>oretical<br />
maximum because evaporation also is affected by <strong>the</strong> vapor pressure gradient<br />
<strong>and</strong> by resistances in <strong>the</strong> vapor pathway. If evaporation exceeds <strong>the</strong> calculated<br />
potential rate, it often is because incident energy is supplemented by<br />
advection, <strong>the</strong> oasis effect shown in Fig. 7.2. Although <strong>the</strong> leaf area of plant<br />
st<strong>and</strong>s (leaf area index) usually is several times that of <strong>the</strong> soil on which <strong>the</strong>y<br />
grow, water loss cannot exceed that from an equal area of moist soil or a water<br />
surface receiving <strong>the</strong> same amount of energy. As <strong>the</strong> soil dries, stomatal closure<br />
reduces transpiration <strong>and</strong> drying of <strong>the</strong> soil surface reduces evaporation from<br />
<strong>the</strong> soil, hence actual ET often is considerably lower than <strong>the</strong> potential rate calculated<br />
from pan evaporation.<br />
Evaporation <strong>and</strong> transpiration losses from a field of corn <strong>and</strong> a forest are<br />
given in Tables 7.1 <strong>and</strong> 7.2, <strong>and</strong> <strong>the</strong> effect of removing plant cover in increasing<br />
runoff <strong>and</strong> evaporation is shown in Table 7.2. One might expect water losses to<br />
be similar from various types of plant cover receiving similar amounts of radiation,<br />
but variations in reflectance (albedo), roughness of <strong>the</strong> canopy, depth of<br />
rooting, <strong>and</strong> stomatal behavior result in significant differences (Rider, 1957).<br />
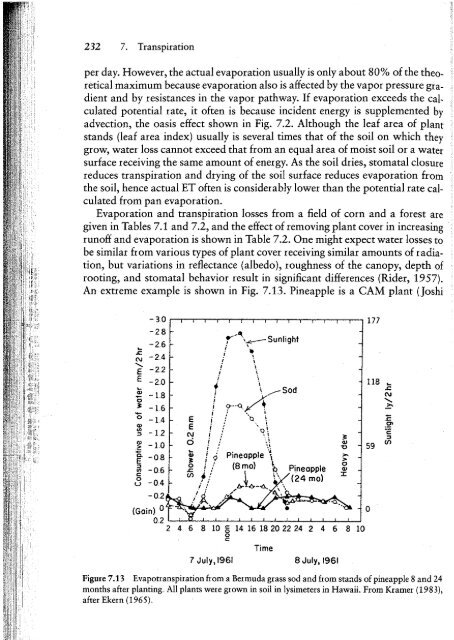
An extreme example is shown in Fig. 7.13. Pineapple is a CAM plant (Joshi<br />
- 3.0<br />
-28<br />
•.. -2 ..6<br />
~ -2.4<br />
E' -22<br />
E -2.0<br />
•...<br />
-E - 1..8<br />
!. -1.6<br />
o -1.4<br />
Ql<br />
~ -1.2<br />
,~ -1..0<br />
~ -08<br />
~ -06<br />
<br />
59 V'l<br />
o