2004 Annual Report - Benetton Group
2004 Annual Report - Benetton Group
2004 Annual Report - Benetton Group

You also want an ePaper? Increase the reach of your titles
YUMPU automatically turns print PDFs into web optimized ePapers that Google loves.
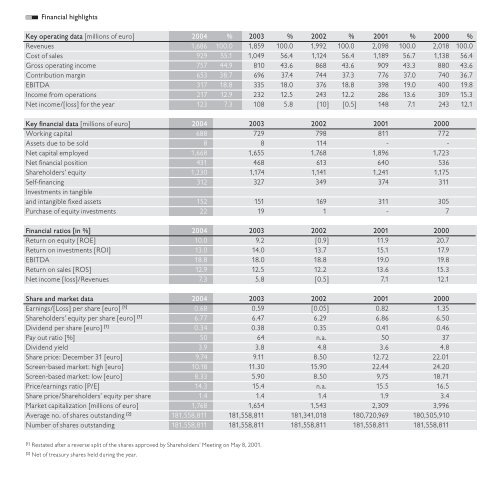
Financial highlights<br />
Key operating data [millions of euro] <strong>2004</strong> % 2003 % 2002 % 2001 % 2000 %<br />
Revenues 1,686 100.0 1,859 100.0 1,992 100.0 2,098 100.0 2,018 100.0<br />
Cost of sales 929 55.1 1,049 56.4 1,124 56.4 1,189 56.7 1,138 56.4<br />
Gross operating income 757 44.9 810 43.6 868 43.6 909 43.3 880 43.6<br />
Contribution margin 653 38.7 696 37.4 744 37.3 776 37.0 740 36.7<br />
EBITDA 317 18.8 335 18.0 376 18.8 398 19.0 400 19.8<br />
Income from operations 217 12.9 232 12.5 243 12.2 286 13.6 309 15.3<br />
Net income/[loss] for the year 123 7.3 108 5.8 [10] [0.5] 148 7.1 243 12.1<br />
Key financial data [millions of euro] <strong>2004</strong> 2003 2002 2001 2000<br />
Working capital 688 729 798 811 772<br />
Assets due to be sold 8 8 114 - -<br />
Net capital employed 1,668 1,655 1,768 1,896 1,723<br />
Net financial position 431 468 613 640 536<br />
Shareholders’ equity 1,230 1,174 1,141 1,241 1,175<br />
Self-financing 312 327 349 374 311<br />
Investments in tangible<br />
and intangible fixed assets 152 151 169 311 305<br />
Purchase of equity investments 22 19 1 - 7<br />
Financial ratios [in %] <strong>2004</strong> 2003 2002 2001 2000<br />
Return on equity [ROE] 10.0 9.2 [0.9] 11.9 20.7<br />
Return on investments [ROI] 13.0 14.0 13.7 15.1 17.9<br />
EBITDA 18.8 18.0 18.8 19.0 19.8<br />
Return on sales [ROS] 12.9 12.5 12.2 13.6 15.3<br />
Net income [loss]/Revenues 7.3 5.8 [0.5] 7.1 12.1<br />
Share and market data <strong>2004</strong> 2003 2002 2001 2000<br />
Earnings/[Loss] per share [euro] [1] 0.68 0.59 [0.05] 0.82 1.35<br />
Shareholders’ equity per share [euro] [1] 6.77 6.47 6.29 6.86 6.50<br />
Dividend per share [euro] [1] 0.34 0.38 0.35 0.41 0.46<br />
Pay out ratio [%] 50 64 n.a. 50 37<br />
Dividend yield 3.9 3.8 4.8 3.6 4.8<br />
Share price: December 31 [euro] 9.74 9.11 8.50 12.72 22.01<br />
Screen-based market: high [euro] 10.18 11.30 15.90 22.44 24.20<br />
Screen-based market: low [euro] 8.33 5.90 8.50 9.75 18.71<br />
Price/earnings ratio [P/E] 14.3 15.4 n.a. 15.5 16.5<br />
Share price/Shareholders’ equity per share 1.4 1.4 1.4 1.9 3.4<br />
Market capitalization [millions of euro] 1,768 1,654 1,543 2,309 3,996<br />
Average no. of shares outstanding [2] 181,558,811 181,558,811 181,341,018 180,720,969 180,505,910<br />
Number of shares outstanding 181,558,811 181,558,811 181,558,811 181,558,811 181,558,811<br />
[1] Restated after a reverse split of the shares approved by Shareholders’ Meeting on May 8, 2001.<br />
[2] Net of treasury shares held during the year.