ISSUE 2007 VOLUME 2 - The World of Mathematical Equations
ISSUE 2007 VOLUME 2 - The World of Mathematical Equations
ISSUE 2007 VOLUME 2 - The World of Mathematical Equations

Create successful ePaper yourself
Turn your PDF publications into a flip-book with our unique Google optimized e-Paper software.
April, <strong>2007</strong> PROGRESS IN PHYSICS Volume 2<br />
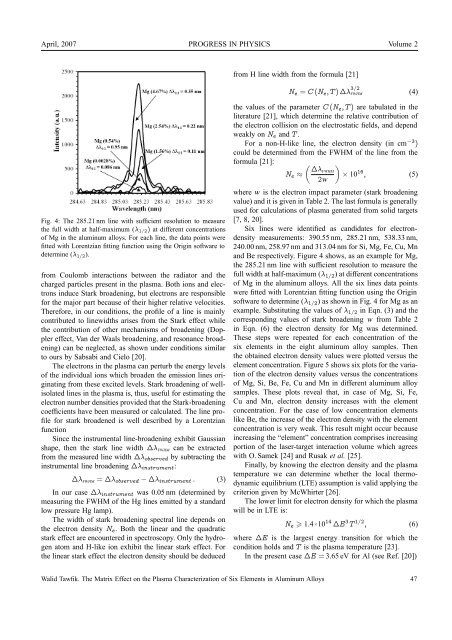
Fig. 4: <strong>The</strong> 285.21 nm line with sufficient resolution to measure<br />
the full width at half-maximum (λ1/2) at different concentrations<br />
<strong>of</strong> Mg in the aluminum alloys. For each line, the data points were<br />
fitted with Lorentzian fitting function using the Origin s<strong>of</strong>tware to<br />
determine (λ1/2).<br />
from Coulomb interactions between the radiator and the<br />
charged particles present in the plasma. Both ions and electrons<br />
induce Stark broadening, but electrons are responsible<br />
for the major part because <strong>of</strong> their higher relative velocities.<br />
<strong>The</strong>refore, in our conditions, the pr<strong>of</strong>ile <strong>of</strong> a line is mainly<br />
contributed to linewidths arises from the Stark effect while<br />
the contribution <strong>of</strong> other mechanisms <strong>of</strong> broadening (Doppler<br />
effect, Van der Waals broadening, and resonance broadening)<br />
can be neglected, as shown under conditions similar<br />
to ours by Sabsabi and Cielo [20].<br />
<strong>The</strong> electrons in the plasma can perturb the energy levels<br />
<strong>of</strong> the individual ions which broaden the emission lines originating<br />
from these excited levels. Stark broadening <strong>of</strong> wellisolated<br />
lines in the plasma is, thus, useful for estimating the<br />
electron number densities provided that the Stark-broadening<br />
coefficients have been measured or calculated. <strong>The</strong> line pr<strong>of</strong>ile<br />
for stark broadened is well described by a Lorentzian<br />
function<br />
Since the instrumental line-broadening exhibit Gaussian<br />
shape, then the stark line width Δλ FWHM can be extracted<br />
from the measured line width Δλobserved by subtracting the<br />
instrumental line broadening Δλinstrument:<br />
Δλ FWHM = Δλobserved − Δλinstrument . (3)<br />
In our case Δλinstrument was 0.05 nm (determined by<br />
measuring the FWHM <strong>of</strong> the Hg lines emitted by a standard<br />
low pressure Hg lamp).<br />
<strong>The</strong> width <strong>of</strong> stark broadening spectral line depends on<br />
the electron density Ne. Both the linear and the quadratic<br />
stark effect are encountered in spectroscopy. Only the hydrogen<br />
atom and H-like ion exhibit the linear stark effect. For<br />
the linear stark effect the electron density should be deduced<br />
from H line width from the formula [21]<br />
Ne = C (Ne, T ) Δλ 3/2<br />
FWHM<br />
the values <strong>of</strong> the parameter C (Ne, T ) are tabulated in the<br />
literature [21], which determine the relative contribution <strong>of</strong><br />
the electron collision on the electrostatic fields, and depend<br />
weakly on Ne and T .<br />
For a non-H-like line, the electron density (in cm −3 )<br />
could be determined from the FWHM <strong>of</strong> the line from the<br />
formula [21]:<br />
�<br />
ΔλFWHM<br />
Ne ≈<br />
2w<br />
(4)<br />
�<br />
× 10 16 , (5)<br />
where w is the electron impact parameter (stark broadening<br />
value) and it is given in Table 2. <strong>The</strong> last formula is generally<br />
used for calculations <strong>of</strong> plasma generated from solid targets<br />
[7, 8, 20].<br />
Six lines were identified as candidates for electrondensity<br />
measurements: 390.55 nm, 285.21 nm, 538.33 nm,<br />
240.00 nm, 258.97 nm and 313.04 nm for Si, Mg, Fe, Cu, Mn<br />
and Be respectively. Figure 4 shows, as an example for Mg,<br />
the 285.21 nm line with sufficient resolution to measure the<br />
full width at half-maximum (λ1/2) at different concentrations<br />
<strong>of</strong> Mg in the aluminum alloys. All the six lines data points<br />
were fitted with Lorentzian fitting function using the Origin<br />
s<strong>of</strong>tware to determine (λ1/2) as shown in Fig. 4 for Mg as an<br />
example. Substituting the values <strong>of</strong> λ1/2 in Eqn. (3) and the<br />
corresponding values <strong>of</strong> stark broadening w from Table 2<br />
in Eqn. (6) the electron density for Mg was determined.<br />
<strong>The</strong>se steps were repeated for each concentration <strong>of</strong> the<br />
six elements in the eight aluminum alloy samples. <strong>The</strong>n<br />
the obtained electron density values were plotted versus the<br />
element concentration. Figure 5 shows six plots for the variation<br />
<strong>of</strong> the electron density values versus the concentrations<br />
<strong>of</strong> Mg, Si, Be, Fe, Cu and Mn in different aluminum alloy<br />
samples. <strong>The</strong>se plots reveal that, in case <strong>of</strong> Mg, Si, Fe,<br />
Cu and Mn, electron density increases with the element<br />
concentration. For the case <strong>of</strong> low concentration elements<br />
like Be, the increase <strong>of</strong> the electron density with the element<br />
concentration is very weak. This result might occur because<br />
increasing the “element” concentration comprises increasing<br />
portion <strong>of</strong> the laser-target interaction volume which agrees<br />
with O. Samek [24] and Rusak et al. [25].<br />
Finally, by knowing the electron density and the plasma<br />
temperature we can determine whether the local thermodynamic<br />
equilibrium (LTE) assumption is valid applying the<br />
criterion given by McWhirter [26].<br />
<strong>The</strong> lower limit for electron density for which the plasma<br />
will be in LTE is:<br />
Ne � 1.4 ×10 14 ΔE 3 T 1/2 , (6)<br />
where ΔE is the largest energy transition for which the<br />
condition holds and T is the plasma temperature [23].<br />
In the present case ΔE = 3.65 eV for Al (see Ref. [20])<br />
Walid Tawfik. <strong>The</strong> Matrix Effect on the Plasma Characterization <strong>of</strong> Six Elements in Aluminum Alloys 47