
You also want an ePaper? Increase the reach of your titles
YUMPU automatically turns print PDFs into web optimized ePapers that Google loves.
Proven Futures Trading Methods<br />
Based on Science and Reality<br />
Call for your free copy of our catalog today.<br />
We feature books, systems and Easy Language<br />
software available nowhere else.<br />
Reality Based Trading Company<br />
1731 Howe Avenue PMB-149<br />
Sacramento CA 95825-2209<br />
1-800-999-2827 or 1-530-677-7562<br />
Website: www.rb-trading.com<br />
E-mail: info@rb-trading.com<br />
Continuing The Bruce Babcock Legacy<br />
For more information circle No. 19<br />
time trend targets.<br />
The practical trading strategy will fi rst recognize the signal<br />
on the larger time frame and the trade will be executed on the<br />
smaller time frame to reduce capital exposure for the trade.<br />
In our next example, the initial trade set-up will be a go-short<br />
signal on the 60-minute data and the trade will then be executed<br />
on the next signal on the 15-minute data.<br />
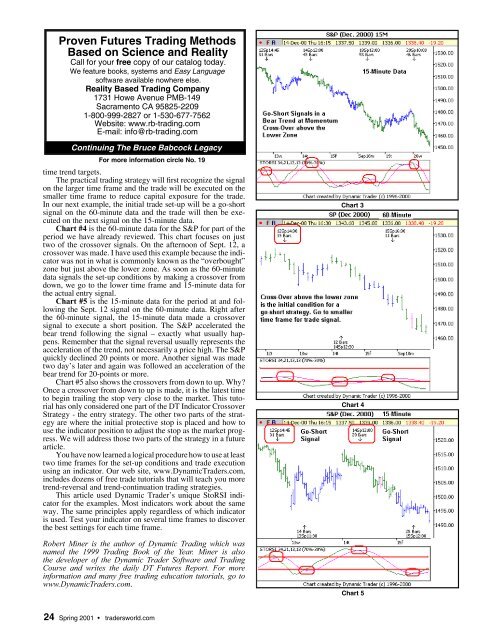
Chart #4 is the 60-minute data for the S&P for part of the<br />
period we have already reviewed. This chart focuses on just<br />
two of the crossover signals. On the afternoon of Sept. 12, a<br />
crossover was made. I have used this example because the indicator<br />
was not in what is commonly known as the “overbought”<br />
zone but just above the lower zone. As soon as the 60-minute<br />
data signals the set-up conditions by making a crossover from<br />
down, we go to the lower time frame and 15-minute data for<br />
the actual entry signal.<br />
Chart #5 is the 15-minute data for the period at and following<br />
the Sept. 12 signal on the 60-minute data. Right after<br />
the 60-minute signal, the 15-minute data made a crossover<br />
signal to execute a short position. The S&P accelerated the<br />
bear trend following the signal – exactly what usually happens.<br />
Remember that the signal reversal usually represents the<br />
acceleration of the trend, not necessarily a price high. The S&P<br />
quickly declined 20 points or more. Another signal was made<br />
two day’s later and again was followed an acceleration of the<br />
bear trend for 20-points or more.<br />
Chart #5 also shows the crossovers from down to up. Why?<br />
Once a crossover from down to up is made, it is the latest time<br />
to begin trailing the stop very close to the market. This tutorial<br />
has only considered one part of the DT Indicator Crossover<br />
Strategy - the entry strategy. The other two parts of the strategy<br />
are where the initial protective stop is placed and how to<br />
use the indicator position to adjust the stop as the market progress.<br />
We will address those two parts of the strategy in a future<br />
article.<br />
You have now learned a logical procedure how to use at least<br />
two time frames for the set-up conditions and trade execution<br />
using an indicator. Our web site, www.DynamicTraders.com,<br />
includes dozens of free trade tutorials that will teach you more<br />
trend-reversal and trend-continuation trading strategies.<br />
This article used Dynamic Trader’s unique StoRSI indicator<br />
for the examples. Most indicators work about the same<br />
way. The same principles apply regardless of which indicator<br />
is used. Test your indicator on several time frames to discover<br />
the best settings for each time frame.<br />
Robert Miner is the author of Dynamic Trading which was<br />
named the 1999 Trading Book of the Year. Miner is also<br />
the developer of the Dynamic Trader Software and Trading<br />
Course and writes the daily DT Futures Report. For more<br />
information and many free trading education tutorials, go to<br />
www.DynamicTraders.com.<br />
24 Spring 2001 tradersworld.com<br />
Chart 3<br />
Chart 4<br />
Chart 5