
You also want an ePaper? Increase the reach of your titles
YUMPU automatically turns print PDFs into web optimized ePapers that Google loves.
Counting on the<br />
10 Year Cycle<br />
By Ken Turkin<br />
The importance of cycles are<br />
talked about all through W.D.<br />
Gann’s courses. Great emphasis<br />
is placed on time as the<br />
constant foundation. Therefore,<br />
to be accurate in forecasting the<br />
future, we must know the major cycles,<br />
the larger trends. How cycles can be<br />
constructed shows that the most money<br />
could be made when fast moves occur<br />
at the end of major cycles. Much effort<br />
is put in describing the different ways<br />
that the 10 year cycle appears physically.<br />
This makes it the most interesting and<br />
crucial to our understanding.<br />
In the unpublished “Forecasting”<br />
course of 1935, Gann identifi es the Great<br />
Cycle, the Master Time period, the most<br />
important, to be the 60 year cycle. There<br />
is also the discussion of the 10 year cycle,<br />
the Bull and Bear Calendar<br />
Years of the Decades. These revealing<br />
parts were later edited out in future<br />
courses. From the 1931 unpublished<br />
“Method for Forecasting the Stock<br />
Market”, the most important time cycle<br />
is the 20 year cycle. Gann states that this<br />
is broken down into two cycles approximately<br />
ten years in length which will<br />
produce fl uctuations of a similar nature<br />
and extreme highs and lows. The 10 year<br />
is also hinted to be tied to the 20 year<br />
cycle, by the comment of “stocks come<br />
out remarkably close on each even 10<br />
year cycle.”<br />
Here are some of the rules describing<br />
the 10 year cycle and it’s components<br />
from various written sections:<br />
1. It is 1/2 of the 20 year cycle and<br />
1/6th of the 60 year cycle.<br />
2. It is 1/3 of the 30 year cycle and<br />
120 months is 1/3 of a circle.<br />
3. The stock market moves in 10 year<br />
cycles, which is worked out in a 5 year<br />
cycle up and a 5 year cycle down.<br />
4. The smallest complete cycle or<br />
38 Spring 2001 tradersworld.com<br />
workout is 5 years.<br />
5. A Bull campaign runs 5 years: 2<br />
years up, 1 down then 2 years up.<br />
6. A Bear campaign runs 5 years: 2<br />
years down, 1 up then 2 years down.<br />
7. Adding 5 years to a bottom will<br />
give you a top.<br />
8. Adding 5 years to a top will give<br />
you a bottom.<br />
7. From a completed bottom (or top)<br />
add 3 years to get the next one, then add<br />
4 years to get the fi nal one of the 7<br />
year cycle.<br />
Gann’s concepts were simply profound,<br />
but this becomes very confusing.<br />
How can the same thing be counted in so<br />
many different ways and perspectives ?<br />
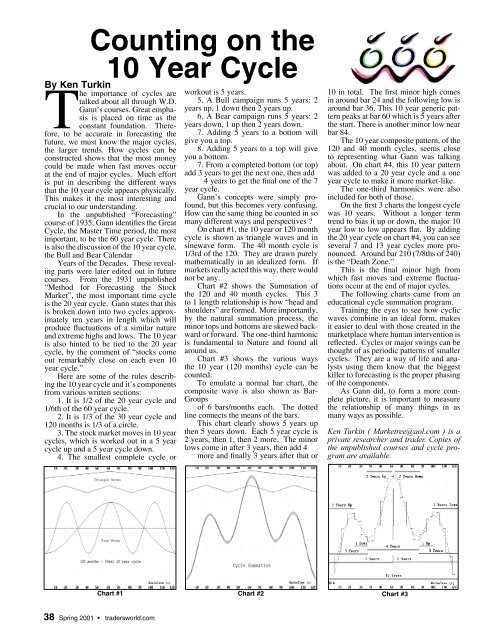
On chart #1, the 10 year or 120 month<br />
cycle is shown as triangle waves and in<br />
sinewave form. The 40 month cycle is<br />
1/3rd of the 120. They are drawn purely<br />
mathematically in an idealized form. If<br />
markets really acted this way, there would<br />
not be any.<br />
Chart #2 shows the Summation of<br />
the 120 and 40 month cycles. This 3<br />
to 1 length relationship is how “head and<br />
shoulders” are formed. More importantly,<br />
by the natural summation process, the<br />
minor tops and bottoms are skewed backward<br />
or forward. The one-third harmonic<br />
is fundamental to Nature and found all<br />
around us.<br />
Chart #3 shows the various ways<br />
the 10 year (120 months) cycle can be<br />
counted.<br />
To emulate a normal bar chart, the<br />
composite wave is also shown as Bar-<br />
Groups<br />
of 6 bars/months each. The dotted<br />
line connects the means of the bars.<br />
This chart clearly shows 5 years up<br />
then 5 years down. Each 5 year cycle is<br />
2 years, then 1, then 2 more. The minor<br />
lows come in after 3 years, then add 4<br />
more and fi nally 3 years after that or<br />
10 in total. The fi rst minor high comes<br />
in around bar 24 and the following low is<br />
around bar 36. This 10 year generic pattern<br />
peaks at bar 60 which is 5 years after<br />
the start. There is another minor low near<br />
bar 84.<br />
The 10 year composite pattern, of the<br />
120 and 40 month cycles, seems close<br />
to representing what Gann was talking<br />
about. On chart #4, this 10 year pattern<br />
was added to a 20 year cycle and a one<br />
year cycle to make it more market-like.<br />
The one-third harmonics were also<br />
included for both of those.<br />
On the fi rst 3 charts the longest cycle<br />
was 10 years. Without a longer term<br />
trend to bias it up or down, the major 10<br />
year low to low appears fl at. By adding<br />
the 20 year cycle on chart #4, you can see<br />
several 7 and 13 year cycles more pronounced.<br />
Around bar 210 (7/8ths of 240)<br />
is the “Death Zone.”<br />
This is the fi nal minor high from<br />
which fast moves and extreme fl uctuations<br />
occur at the end of major cycles.<br />
The following charts came from an<br />
educational cycle summation program.<br />
Training the eyes to see how cyclic<br />
waves combine in an ideal form, makes<br />
it easier to deal with those created in the<br />
marketplace where human intervention is<br />
refl ected. Cycles or major swings can be<br />
thought of as periodic patterns of smaller<br />
cycles. They are a way of life and analysts<br />
using them know that the biggest<br />
killer to forecasting is the proper phasing<br />
of the components.<br />
As Gann did, to form a more complete<br />
picture, it is important to measure<br />
the relationship of many things in as<br />
many ways as possible.<br />
Ken Turkin ( Marketree@aol.com ) is a<br />
private researcher and trader. Copies of<br />
the unpublished courses and cycle program<br />
are available.<br />
Chart #1 Chart #2 Chart #3