
You also want an ePaper? Increase the reach of your titles
YUMPU automatically turns print PDFs into web optimized ePapers that Google loves.
digits, then all prices will fall in the range<br />
of [100 ... 1000]. By substituting the<br />
price boundaries into the slope formula,<br />
we can get a range of slopes as follows.<br />
For a P1 of 100, the slope of the up<br />
trend line to 100 = 2 - 1 / 10 = 1.9<br />
For a P1 of 1000, the slope of the up<br />
trend line to 1000 = 2 - 1 / 100 = 1.99<br />
The slope of the up trend line at the<br />
midpoint of this price range is 2 - 1 /<br />
sqrt(500) = 1.96<br />
Let’s call this trend line a 45 degree<br />
line because we developed the slope using<br />
one unit of price change from P to P1<br />
with one unit of time t. For this 45<br />
degree line, the slope is basically 2. I<br />
think this is strong justifi cation as to why<br />
Gann used 2 cents as the price grid interval<br />
of his daily grain charts. Such a<br />
scale layout would naturally give Gann<br />
45 degree angles with a slope of 2 cents<br />
per daily bar. I have shown that 2 is<br />
the slope of the upward 45 degree trend<br />
line that develops from the price and time<br />
relationship given by the formula: P = t<br />
^ 2. One can solve for the slope of the<br />
downward trend line from P1 to P to<br />
obtain this result:<br />
Slope of P1 to P = (-2 t - 1) / (t-1) = (-2<br />
[t - 1] - 3 ) / (t-1) = -2 - 3 / (t-1) = -2 - 3<br />
/ (sqrt( P ) - 1)<br />
For a P of 100, the slope of the down<br />
trend line to 100 = -2 - 3/9 = -2.33<br />
For a P of 1000, the slope of the down<br />
trend line to 1000 = -2 - 3/99 = -2.03<br />
Again, the slope of the down trend<br />
line approaches a value of -2. Therefore,<br />
-2 is a good approximation for the slope<br />
of a downward 45 degree trend line.<br />
Now I would not bother to give you<br />
Figure 3<br />
Jack Winkleman Newsletters<br />
S&P 500 & Soybeans<br />
Mr. Winkelman is an experienced trader with over 30 years of experience.<br />
He has successfully managed money for both himself and for others.<br />
Mr. Winkleman uses a unique Gann harmonic number along with astro<br />
techniques an other indicators to produce near perfect timing newsletters.<br />
If you are looking to enhance your trading of either the S&P500 or<br />
Soybeans these weekly newsletters are a must.<br />
Price: $249.00 per year each<br />
( produced weekly)<br />
FREE SAMPLES AVAILABLE ONSITE:<br />
www.tradersworld.com/winkleman<br />
www.tradersworld.com<br />
Call 1-800-288-4266.<br />
There is a substantial risk of loss in trading futures and options.<br />
For more information circle No. 30<br />
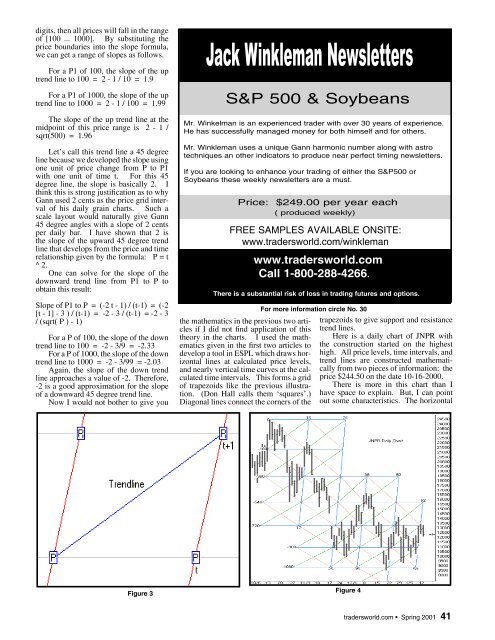
the mathematics in the previous two arti- trapezoids to give support and resistance<br />
cles if I did not fi nd application of this trend lines.<br />
theory in the charts. I used the math- Here is a daily chart of JNPR with<br />
ematics given in the fi rst two articles to the construction started on the highest<br />
develop a tool in ESPL which draws hor- high. All price levels, time intervals, and<br />
izontal lines at calculated price levels, trend lines are constructed mathemati-<br />
and nearly vertical time curves at the calcally from two pieces of information: the<br />
culated time intervals. This forms a grid price $244.50 on the date 10-16-2000.<br />
of trapezoids like the previous illustra- There is more in this chart than I<br />
tion. (Don Hall calls them ‘squares’.) have space to explain. But, I can point<br />
Diagonal lines connect the corners of the out some characteristics. The horizontal<br />
Figure 4<br />
tradersworld.com Spring 2001 41