Create successful ePaper yourself
Turn your PDF publications into a flip-book with our unique Google optimized e-Paper software.
Commonsense Investing<br />
Technical Analysis for<br />
the Long-Term Investor<br />
By<br />
I<br />
Gilbert Steele<br />
would like to speak to you as if you<br />
were looking to invest in the next<br />
four months in the stock market.<br />
Are you are looking for a low to<br />
buy to hold three or four years in<br />
the future? What do you think constitutes<br />
a good buy? Using logic, if stocks fall<br />
then they should go up. If you tell me<br />
you don’t know why they fall, then by<br />
that very logic you cannot tell me why<br />
they are going to go up. It is easier said,<br />
the smart people knew there was a top<br />
and sold the top of the stock market, the<br />
way it should have been done. Accept the<br />
fact, they did a good job. So the very<br />
essence of this article is what makes a<br />
good buy.<br />
The equipment you will need is a<br />
Gann pinwheel and a daily chart of stock<br />
Q. com, ticker [ QCOM ].<br />
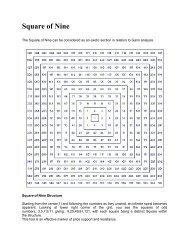
By looking at the Gann pinwheel<br />
you’ll see $200 in the upper right hand<br />
corner.<br />
This is where Q. com made its top.<br />
Draw a line from $200 or the number<br />
200 to the middle of the chart (which is<br />
No. 1) and through the center. We are<br />
looking for the number on the other side<br />
of the center No 1.<br />
The number 2 equals 360 degrees.<br />
The No. 1 equals 180 degrees. The<br />
number point .5 equals 90 degrees. For<br />
example, take the square root of 200<br />
equals 14.14 and subtract 1 and that<br />
equals 13.14. Now, square 13.14 and you<br />
get 172.7. This number is on the lower<br />
left hand corner of the Gann pinwheel.<br />
The very fi rst observation one should<br />
make is, that the top of the chart of<br />
Q. com at 200 matches the Gann pinwheel.<br />
But the bottom of the chart at<br />
50 is in alignment at 180 degrees across<br />
the middle of the Gann pinwheel. This<br />
would be the very fi rst thing done on all<br />
32 Spring 2001 tradersworld.com<br />
your charts if they align.<br />
At this point we realize that top<br />
was at 200. The next inside number is<br />
148, that is 360 degrees down. The next<br />
number on the inside is 103, then another<br />
360 degrees down at 67. Now at 67 that<br />
is another 180 degrees down to 50 dollars.<br />
That’s a long way down, that is a<br />
low on the chart now. So when the stock<br />
went up you can see $50 going up 180<br />
degrees to the top of about $103. Now at<br />
about $103 top the stock is falling. Now<br />
the question is, will it bottom at $50, or<br />
continue down to $38? It can also keep<br />
going up. You could invest in this area if<br />
you are a long term investor. If you are<br />
a day-to-day trader you would be trading<br />
$50 low up to the $102 then shorting<br />
coming back down to the $50 area.<br />
Then you would have to look and see if it<br />
is going lower. You can make a lot more<br />
money trading the stock. If you are an<br />
intra-day trader working at $.25 to $.5<br />
at 45 to 90 degrees you might take even<br />
more money out of the market with more<br />
trades. Of course, you have to be a<br />
very fast and a good day-trader. But just<br />
remember, long term trading is safer than<br />
short term.<br />
SUMMARY<br />
1. A way to look at the overall market is:<br />
markup, top, distribution, bottoming, and<br />
re-accumulation.<br />
2. At the bottom is like watching water<br />
come to boil - this is simmering just before<br />
the boil we’re building latent energy.<br />
3. Going back to the chart of Q. com.<br />
Before the top you must think in a threedimensional<br />
Helix. It is a round cylinder<br />
like a Barber pole (where you get your<br />
haircut). The barber pole is lying on its<br />
side. The stock going up, moving away<br />
from you, coming up over the top and<br />
falling 360 degrees, up over the top falling<br />
360 degrees, up over the top at 180<br />
degrees, to the $50 area, then going up<br />
away from you to the $102 area, and<br />
coming down 90 degrees and maybe<br />
90 more degrees back at $50 or lower.<br />
4. Another way of looking at this is, if<br />
you were sitting in the bathtub and let the<br />
water out, you would see the water as<br />
it went down, start to make a whole in<br />
the middle of the water. In your mind,<br />
think of the Gann pin on top of that hole.<br />
Now think of the numbers on the Gann<br />
pinwheel at 200 going lower, lower,<br />
and faster and lower, lower all the<br />
way down to 50. Do not think of the<br />
money now, it could be bad on your<br />
heart. Your fi rst loss is your best loss.<br />
Learn to walk away and forgive yourself.<br />
5. If a system has truth you are polarized<br />
by two, that is male and female, up<br />
and down, truth and false, to buy or sell.<br />
6. International Paper chart to look at. I<br />
hope I have helped a number of people to<br />
have a better grip on their stock market<br />
trading.<br />
In no way, is this meant to be a buy recommendation<br />
on Q. com ticker [ QCOM] or any<br />
other stock in particular, etc. To contact the<br />
author you can call him at 330-395-8129 or<br />
e-mail him at gsteele@gilbertsteele.com<br />
Chart #1 Chart #2 Chart #3