
You also want an ePaper? Increase the reach of your titles
YUMPU automatically turns print PDFs into web optimized ePapers that Google loves.
Gann Masters TM<br />
As you know, W.D. Gann<br />
was a legendary trader who<br />
amassed a fortune of $50<br />
million trading the markets.<br />
He died in 1955. He wrote<br />
several important books on<br />
trading as well as a commodity<br />
trading course and a<br />
stock market trading course.<br />
He charged $3000 to $5000 for the trading<br />
courses which included 6 months of personal<br />
instruction by phone. The books and<br />
courses were written in veiled language<br />
which is almost impossible to understand<br />
by the average person.<br />
Traders World Research found that many<br />
successful traders used the techniques of<br />
W.D. Gann. Due to the overwhelming interest<br />
in the W.D. Gann trading techniques,<br />
Traders World created the Gann Masters<br />
Trading Course to help traders become successful.<br />
The course was created by Traders<br />
World Research in combination with asking<br />
large traders how they used the techniques<br />
of W.D. Gann. This was put together in an<br />
easy-to-understand course designed for the<br />
average person. The course includes dozens<br />
of charts and illustrations which were not<br />
included in the courses of W.D. Gann. The<br />
course length is 200 pages. An Excel template<br />
was also developed to help the students<br />
with master table and circle charts. It<br />
includes electronic versions of all the master<br />
charts including the square of 4 and 9. It is<br />
possible to extend these master charts out<br />
to infi nity with the Excel template. It is recommended<br />
that you purchase the Microsoft<br />
Excel software to run the program, but it<br />
is not necessary. Students can download a<br />
Excel viewer from the Microsoft internet<br />
site. This will run the template.<br />
It still takes a lot of work and study<br />
to achieve the trading expertise of W.D.<br />
Gann. To help the understanding of material<br />
a secret internet site was developed just<br />
for students of the course. The site is used<br />
for students only. Students can ask questions<br />
of the material they don’t understand. A<br />
master instructor will respond. A discussion<br />
group was also created so students could<br />
talk to each other and help each other understand<br />
the material in study groups. The site<br />
also includes updated versions of the Excel<br />
template as well as viewer fi les as to how to<br />
use techniques and programs such as Quick<br />
Charts. It also includes a regular publication<br />
of Gann Today.<br />
A degree program is now in place and<br />
part of Traders World University program..<br />
All students who want level degrees in Gann<br />
Masters must pass essay tests. The tests are<br />
not easy and involve much work, but they<br />
help you to learn and to trade better.<br />
To enroll in GannMasters please send<br />
$90.00 printed course or $80.00 for PDF-CD<br />
version plus $4.95 shipping to Traders World<br />
use the catalog order blank in this magazine.<br />
Gann Masters c/o Traders World<br />
Phone: 800-288-4266<br />
Fax: 417-886-5180<br />
publisher@tradersworld.com<br />
www.tradersworld.com<br />
42 Spring 2001 tradersworld.com<br />
price lines have a label on the left which<br />
is a degree of rotation around a Square<br />
of 9. This is covered in the Pyrapoint<br />
book, but is beyond the scope of this<br />
article. Note that in my example, the<br />
time lines are nearly vertical. This is a<br />
slight variation from the method of construction<br />
in the Pyrapoint book which<br />
shows vertical lines. I feel that my presentation<br />
is appropriate because of the<br />
theory of the time curve illustrated in my<br />
fi rst article. The time curve forms the<br />
left and right sides of the trapezoid, and<br />
the price levels form the top and bottom<br />
sides.<br />
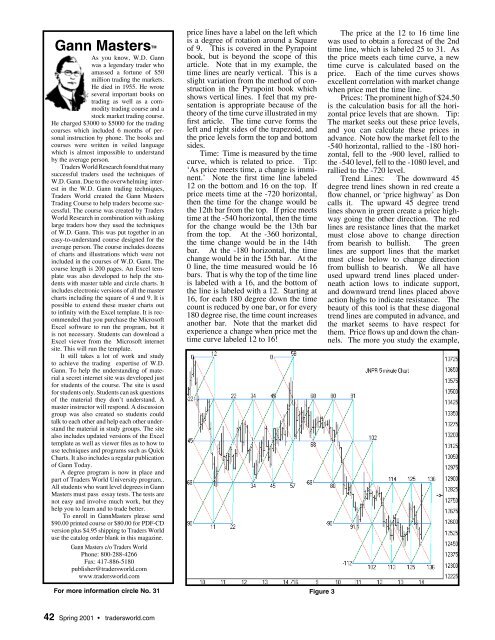
Time: Time is measured by the time<br />
curve, which is related to price. Tip:<br />
‘As price meets time, a change is imminent.’<br />
Note the fi rst time line labeled<br />
12 on the bottom and 16 on the top. If<br />
price meets time at the -720 horizontal,<br />
then the time for the change would be<br />
the 12th bar from the top. If price meets<br />
time at the -540 horizontal, then the time<br />
for the change would be the 13th bar<br />
from the top. At the -360 horizontal,<br />
the time change would be in the 14th<br />
bar. At the -180 horizontal, the time<br />
change would be in the 15th bar. At the<br />
0 line, the time measured would be 16<br />
bars. That is why the top of the time line<br />
is labeled with a 16, and the bottom of<br />
the line is labeled with a 12. Starting at<br />
16, for each 180 degree down the time<br />
count is reduced by one bar, or for every<br />
180 degree rise, the time count increases<br />
another bar. Note that the market did<br />
experience a change when price met the<br />
time curve labeled 12 to 16!<br />
For more information circle No. 31 Figure 3<br />
The price at the 12 to 16 time line<br />
was used to obtain a forecast of the 2nd<br />
time line, which is labeled 25 to 31. As<br />
the price meets each time curve, a new<br />
time curve is calculated based on the<br />
price. Each of the time curves shows<br />
excellent correlation with market change<br />
when price met the time line.<br />
Prices: The prominent high of $24.50<br />
is the calculation basis for all the horizontal<br />
price levels that are shown. Tip:<br />
The market seeks out these price levels,<br />
and you can calculate these prices in<br />
advance. Note how the market fell to the<br />
-540 horizontal, rallied to the -180 horizontal,<br />
fell to the -900 level, rallied to<br />
the -540 level, fell to the -1080 level, and<br />
rallied to the -720 level.<br />
Trend Lines: The downward 45<br />
degree trend lines shown in red create a<br />
fl ow channel, or ‘price highway’ as Don<br />
calls it. The upward 45 degree trend<br />
lines shown in green create a price highway<br />
going the other direction. The red<br />
lines are resistance lines that the market<br />
must close above to change direction<br />
from bearish to bullish. The green<br />
lines are support lines that the market<br />
must close below to change direction<br />
from bullish to bearish. We all have<br />
used upward trend lines placed underneath<br />
action lows to indicate support,<br />
and downward trend lines placed above<br />
action highs to indicate resistance. The<br />
beauty of this tool is that these diagonal<br />
trend lines are computed in advance, and<br />
the market seems to have respect for<br />
them. Price fl ows up and down the channels.<br />
The more you study the example,