
Create successful ePaper yourself
Turn your PDF publications into a flip-book with our unique Google optimized e-Paper software.
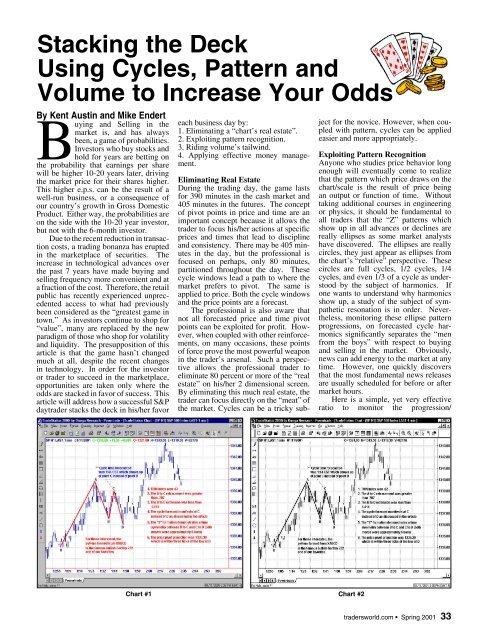
Stacking the Deck<br />
Using Cycles, Pattern and<br />
Volume to Increase Your Odds<br />
By Kent Austin and Mike Endert<br />
Buying and Selling in the<br />
market is, and has always<br />
been, a game of probabilities.<br />
Investors who buy stocks and<br />
hold for years are betting on<br />
the probability that earnings per share<br />
will be higher 10-20 years later, driving<br />
the market price for their shares higher.<br />
This higher e.p.s. can be the result of a<br />
well-run business, or a consequence of<br />
our country’s growth in Gross Domestic<br />
Product. Either way, the probabilities are<br />
on the side with the 10-20 year investor,<br />
but not with the 6-month investor.<br />
Due to the recent reduction in transaction<br />
costs, a trading bonanza has erupted<br />
in the marketplace of securities. The<br />
increase in technological advances over<br />
the past 7 years have made buying and<br />
selling frequency more convenient and at<br />
a fraction of the cost. Therefore, the retail<br />
public has recently experienced unprecedented<br />
access to what had previously<br />
been considered as the “greatest game in<br />
town.” As investors continue to shop for<br />
“value”, many are replaced by the new<br />
paradigm of those who shop for volatility<br />
and liquidity. The presupposition of this<br />
article is that the game hasn’t changed<br />
much at all, despite the recent changes<br />
in technology. In order for the investor<br />
or trader to succeed in the marketplace,<br />
opportunities are taken only where the<br />
odds are stacked in favor of success. This<br />
article will address how a successful S&P<br />
daytrader stacks the deck in his/her favor<br />
each business day by:<br />
1. Eliminating a “chart’s real estate”.<br />
2. Exploiting pattern recognition.<br />
3. Riding volume’s tailwind.<br />
4. Applying effective money management.<br />
Eliminating Real Estate<br />
During the trading day, the game lasts<br />
for 390 minutes in the cash market and<br />
405 minutes in the futures. The concept<br />
of pivot points in price and time are an<br />
important concept because it allows the<br />
trader to focus his/her actions at specifi c<br />
prices and times that lead to discipline<br />
and consistency. There may be 405 minutes<br />
in the day, but the professional is<br />
focused on perhaps, only 80 minutes,<br />
partitioned throughout the day. These<br />
cycle windows lead a path to where the<br />
market prefers to pivot. The same is<br />
applied to price. Both the cycle windows<br />
and the price points are a forecast.<br />
The professional is also aware that<br />
not all forecasted price and time pivot<br />
points can be exploited for profi t. However,<br />
when coupled with other reinforcements,<br />
on many occasions, these points<br />
of force prove the most powerful weapon<br />
in the trader’s arsenal. Such a perspective<br />
allows the professional trader to<br />
eliminate 80 percent or more of the “real<br />
estate” on his/her 2 dimensional screen.<br />
By eliminating this much real estate, the<br />
trader can focus directly on the “meat” of<br />
the market. Cycles can be a tricky sub-<br />
Chart #1 Chart #2<br />
ject for the novice. However, when coupled<br />
with pattern, cycles can be applied<br />
easier and more appropriately.<br />
Exploiting Pattern Recognition<br />
Anyone who studies price behavior long<br />
enough will eventually come to realize<br />
that the pattern which price draws on the<br />
chart/scale is the result of price being<br />
an output or function of time. Without<br />
taking additional courses in engineering<br />
or physics, it should be fundamental to<br />
all traders that the “Z” patterns which<br />
show up in all advances or declines are<br />
really ellipses as some market analysts<br />
have discovered. The ellipses are really<br />
circles, they just appear as ellipses from<br />
the chart’s “relative” perspective. These<br />
circles are full cycles, 1/2 cycles, 1/4<br />
cycles, and even 1/3 of a cycle as understood<br />
by the subject of harmonics. If<br />
one wants to understand why harmonics<br />
show up, a study of the subject of sympathetic<br />
resonation is in order. Nevertheless,<br />
monitoring these ellipse pattern<br />
progressions, on forecasted cycle harmonics<br />
signifi cantly separates the “men<br />
from the boys” with respect to buying<br />
and selling in the market. Obviously,<br />
news can add energy to the market at any<br />
time. However, one quickly discovers<br />
that the most fundamental news releases<br />
are usually scheduled for before or after<br />
market hours.<br />
Here is a simple, yet very effective<br />
ratio to monitor the progression/<br />
tradersworld.com Spring 2001 33