Raman Microanalysis in the Forensic Laboratory - Thermo Scientific ...
Raman Microanalysis in the Forensic Laboratory - Thermo Scientific ...
Raman Microanalysis in the Forensic Laboratory - Thermo Scientific ...

Create successful ePaper yourself
Turn your PDF publications into a flip-book with our unique Google optimized e-Paper software.
<strong>Raman</strong> <strong>Microanalysis</strong><br />
Intensity Intensity Intensity (x10 5 )<br />
2.0<br />
*GBL (liquid) by dispersive <strong>Raman</strong> - White Light Corrected<br />
1.5<br />
1.0<br />
GBL by FT-<strong>Raman</strong><br />
2.0<br />
1.5<br />
1.0<br />
0.5<br />
1.0<br />
γ-Butyrolactone, 99+%<br />
0.8<br />
0.6<br />
0.4<br />
0.2<br />
1800 1600 1400 1200 1000<br />
-1<br />
800 600 400<br />
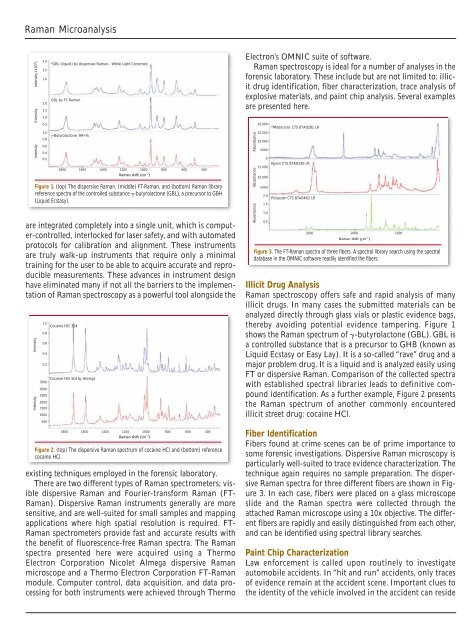
Figure 1. (top) The dispersive <strong>Raman</strong>, (middle) FT-<strong>Raman</strong>, and (bottom) <strong>Raman</strong> library<br />
reference spectra of <strong>the</strong> controlled substance �-butyrolactone (GBL), a precursor to GBH<br />
(Liquid Ecstasy).<br />
are <strong>in</strong>tegrated completely <strong>in</strong>to a s<strong>in</strong>gle unit, which is computer-controlled,<br />
<strong>in</strong>terlocked for laser safety, and with automated<br />
protocols for calibration and alignment. These <strong>in</strong>struments<br />
are truly walk-up <strong>in</strong>struments that require only a m<strong>in</strong>imal<br />
tra<strong>in</strong><strong>in</strong>g for <strong>the</strong> user to be able to acquire accurate and reproducible<br />
measurements. These advances <strong>in</strong> <strong>in</strong>strument design<br />
have elim<strong>in</strong>ated many if not all <strong>the</strong> barriers to <strong>the</strong> implementation<br />
of <strong>Raman</strong> spectroscopy as a powerful tool alongside <strong>the</strong><br />
Intensity Intensity<br />
1.0<br />
Coca<strong>in</strong>e.HCI 354<br />
0.8<br />
0.6<br />
0.4<br />
0.2<br />
Coca<strong>in</strong>e HCI Std by Almega<br />
3500<br />
3000<br />
2500<br />
2000<br />
1500<br />
1000<br />
500<br />
1800 1600 1400 1200 1000<br />
-1<br />
800 600 400<br />
Figure 2. (top) The dispersive <strong>Raman</strong> spectrum of coca<strong>in</strong>e HCl and (bottom) reference<br />
coca<strong>in</strong>e HCl.<br />
exist<strong>in</strong>g techniques employed <strong>in</strong> <strong>the</strong> forensic laboratory.<br />
There are two different types of <strong>Raman</strong> spectrometers; visible<br />
dispersive <strong>Raman</strong> and Fourier-transform <strong>Raman</strong> (FT-<br />
<strong>Raman</strong>). Dispersive <strong>Raman</strong> <strong>in</strong>struments generally are more<br />
sensitive, and are well-suited for small samples and mapp<strong>in</strong>g<br />
applications where high spatial resolution is required. FT-<br />
<strong>Raman</strong> spectrometers provide fast and accurate results with<br />
<strong>the</strong> benefit of fluorescence-free <strong>Raman</strong> spectra. The <strong>Raman</strong><br />
spectra presented here were acquired us<strong>in</strong>g a <strong>Thermo</strong><br />
Electron Corporation Nicolet Almega dispersive <strong>Raman</strong><br />
microscope and a <strong>Thermo</strong> Electron Corporation FT-<strong>Raman</strong><br />
module. Computer control, data acquisition, and data process<strong>in</strong>g<br />
for both <strong>in</strong>struments were achieved through <strong>Thermo</strong><br />
Electron’s OMNIC suite of software.<br />
<strong>Raman</strong> spectroscopy is ideal for a number of analyses <strong>in</strong> <strong>the</strong><br />
forensic laboratory. These <strong>in</strong>clude but are not limited to: illicit<br />
drug identification, fiber characterization, trace analysis of<br />
explosive materials, and pa<strong>in</strong>t chip analysis. Several examples<br />
are presented here.<br />
Absorbance Absorbance Absorbance<br />
20,000<br />
*Modacrylic CTS 87A0281 LR<br />
15,000<br />
10,000<br />
5000<br />
0<br />
Nylon CTS 87A0330 LR<br />
15,000<br />
10,000<br />
5000<br />
2.0<br />
Polyester CTS 87A0462 LR<br />
1.5<br />
1.0<br />
0.5<br />
3000 2000 1000<br />
Figure 3. The FT-<strong>Raman</strong> spectra of three fibers. A spectral library search us<strong>in</strong>g <strong>the</strong> spectral<br />
database <strong>in</strong> <strong>the</strong> OMNIC software readily identified <strong>the</strong> fibers.<br />
Illicit Drug Analysis<br />
<strong>Raman</strong> spectroscopy offers safe and rapid analysis of many<br />
illicit drugs. In many cases <strong>the</strong> submitted materials can be<br />
analyzed directly through glass vials or plastic evidence bags,<br />
<strong>the</strong>reby avoid<strong>in</strong>g potential evidence tamper<strong>in</strong>g. Figure 1<br />
shows <strong>the</strong> <strong>Raman</strong> spectrum of �-butyrolactone (GBL). GBL is<br />
a controlled substance that is a precursor to GHB (known as<br />
Liquid Ecstasy or Easy Lay). It is a so-called “rave” drug and a<br />
major problem drug. It is a liquid and is analyzed easily us<strong>in</strong>g<br />
FT or dispersive <strong>Raman</strong>. Comparison of <strong>the</strong> collected spectra<br />
with established spectral libraries leads to def<strong>in</strong>itive compound<br />
identification. As a fur<strong>the</strong>r example, Figure 2 presents<br />
<strong>the</strong> <strong>Raman</strong> spectrum of ano<strong>the</strong>r commonly encountered<br />
illicit street drug: coca<strong>in</strong>e HCl.<br />
Fiber Identification<br />
Fibers found at crime scenes can be of prime importance to<br />
some forensic <strong>in</strong>vestigations. Dispersive <strong>Raman</strong> microscopy is<br />
particularly well-suited to trace evidence characterization. The<br />
technique aga<strong>in</strong> requires no sample preparation. The dispersive<br />
<strong>Raman</strong> spectra for three different fibers are shown <strong>in</strong> Figure<br />
3. In each case, fibers were placed on a glass microscope<br />
slide and <strong>the</strong> <strong>Raman</strong> spectra were collected through <strong>the</strong><br />
attached <strong>Raman</strong> microscope us<strong>in</strong>g a 10x objective. The different<br />
fibers are rapidly and easily dist<strong>in</strong>guished from each o<strong>the</strong>r,<br />
and can be identified us<strong>in</strong>g spectral library searches.<br />
Pa<strong>in</strong>t Chip Characterization<br />
Law enforcement is called upon rout<strong>in</strong>ely to <strong>in</strong>vestigate<br />
automobile accidents. In “hit and run” accidents, only traces<br />
of evidence rema<strong>in</strong> at <strong>the</strong> accident scene. Important clues to<br />
<strong>the</strong> identity of <strong>the</strong> vehicle <strong>in</strong>volved <strong>in</strong> <strong>the</strong> accident can reside<br />
-1