Raman Microanalysis in the Forensic Laboratory - Thermo Scientific ...
Raman Microanalysis in the Forensic Laboratory - Thermo Scientific ...
Raman Microanalysis in the Forensic Laboratory - Thermo Scientific ...

Create successful ePaper yourself
Turn your PDF publications into a flip-book with our unique Google optimized e-Paper software.
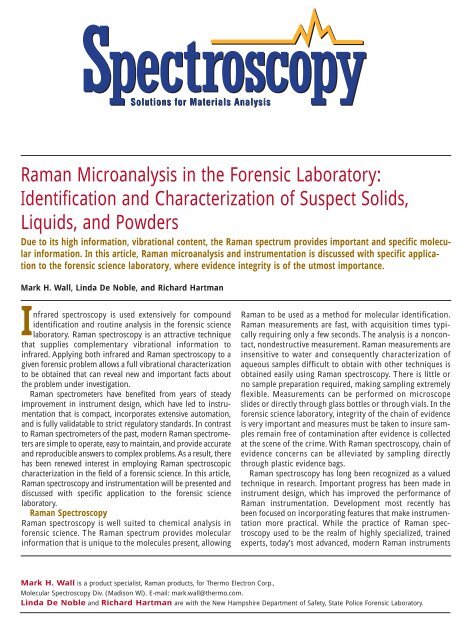
<strong>Raman</strong> <strong>Microanalysis</strong> <strong>in</strong> <strong>the</strong> <strong>Forensic</strong> <strong>Laboratory</strong>:<br />
Identification and Characterization of Suspect Solids,<br />
Liquids, and Powders<br />
Due to its high <strong>in</strong>formation, vibrational content, <strong>the</strong> <strong>Raman</strong> spectrum provides important and specific molecular<br />
<strong>in</strong>formation. In this article, <strong>Raman</strong> microanalysis and <strong>in</strong>strumentation is discussed with specific application<br />
to <strong>the</strong> forensic science laboratory, where evidence <strong>in</strong>tegrity is of <strong>the</strong> utmost importance.<br />
Mark H. Wall, L<strong>in</strong>da De Noble, and Richard Hartman<br />
Infrared spectroscopy is used extensively for compound<br />
identification and rout<strong>in</strong>e analysis <strong>in</strong> <strong>the</strong> forensic science<br />
laboratory. <strong>Raman</strong> spectroscopy is an attractive technique<br />
that supplies complementary vibrational <strong>in</strong>formation to<br />
<strong>in</strong>frared. Apply<strong>in</strong>g both <strong>in</strong>frared and <strong>Raman</strong> spectroscopy to a<br />
given forensic problem allows a full vibrational characterization<br />
to be obta<strong>in</strong>ed that can reveal new and important facts about<br />
<strong>the</strong> problem under <strong>in</strong>vestigation.<br />
<strong>Raman</strong> spectrometers have benefited from years of steady<br />
improvement <strong>in</strong> <strong>in</strong>strument design, which have led to <strong>in</strong>strumentation<br />
that is compact, <strong>in</strong>corporates extensive automation,<br />
and is fully validatable to strict regulatory standards. In contrast<br />
to <strong>Raman</strong> spectrometers of <strong>the</strong> past, modern <strong>Raman</strong> spectrometers<br />
are simple to operate, easy to ma<strong>in</strong>ta<strong>in</strong>, and provide accurate<br />
and reproducible answers to complex problems. As a result, <strong>the</strong>re<br />
has been renewed <strong>in</strong>terest <strong>in</strong> employ<strong>in</strong>g <strong>Raman</strong> spectroscopic<br />
characterization <strong>in</strong> <strong>the</strong> field of a forensic science. In this article,<br />
<strong>Raman</strong> spectroscopy and <strong>in</strong>strumentation will be presented and<br />
discussed with specific application to <strong>the</strong> forensic science<br />
laboratory.<br />
<strong>Raman</strong> Spectroscopy<br />
<strong>Raman</strong> spectroscopy is well suited to chemical analysis <strong>in</strong><br />
forensic science. The <strong>Raman</strong> spectrum provides molecular<br />
<strong>in</strong>formation that is unique to <strong>the</strong> molecules present, allow<strong>in</strong>g<br />
<strong>Raman</strong> to be used as a method for molecular identification.<br />
<strong>Raman</strong> measurements are fast, with acquisition times typically<br />
requir<strong>in</strong>g only a few seconds. The analysis is a noncontact,<br />
nondestructive measurement. <strong>Raman</strong> measurements are<br />
<strong>in</strong>sensitive to water and consequently characterization of<br />
aqueous samples difficult to obta<strong>in</strong> with o<strong>the</strong>r techniques is<br />
obta<strong>in</strong>ed easily us<strong>in</strong>g <strong>Raman</strong> spectroscopy. There is little or<br />
no sample preparation required, mak<strong>in</strong>g sampl<strong>in</strong>g extremely<br />
flexible. Measurements can be performed on microscope<br />
slides or directly through glass bottles or through vials. In <strong>the</strong><br />
forensic science laboratory, <strong>in</strong>tegrity of <strong>the</strong> cha<strong>in</strong> of evidence<br />
is very important and measures must be taken to <strong>in</strong>sure samples<br />
rema<strong>in</strong> free of contam<strong>in</strong>ation after evidence is collected<br />
at <strong>the</strong> scene of <strong>the</strong> crime. With <strong>Raman</strong> spectroscopy, cha<strong>in</strong> of<br />
evidence concerns can be alleviated by sampl<strong>in</strong>g directly<br />
through plastic evidence bags.<br />
<strong>Raman</strong> spectroscopy has long been recognized as a valued<br />
technique <strong>in</strong> research. Important progress has been made <strong>in</strong><br />
<strong>in</strong>strument design, which has improved <strong>the</strong> performance of<br />
<strong>Raman</strong> <strong>in</strong>strumentation. Development most recently has<br />
been focused on <strong>in</strong>corporat<strong>in</strong>g features that make <strong>in</strong>strumentation<br />
more practical. While <strong>the</strong> practice of <strong>Raman</strong> spectroscopy<br />
used to be <strong>the</strong> realm of highly specialized, tra<strong>in</strong>ed<br />
experts, today’s most advanced, modern <strong>Raman</strong> <strong>in</strong>struments<br />
Mark H. Wall is a product specialist, <strong>Raman</strong> products, for <strong>Thermo</strong> Electron Corp.,<br />
Molecular Spectroscopy Div. (Madison WI). E-mail: mark.wall@<strong>the</strong>rmo.com.<br />
L<strong>in</strong>da De Noble and Richard Hartman are with <strong>the</strong> New Hampshire Department of Safety, State Police <strong>Forensic</strong> <strong>Laboratory</strong>.
<strong>Raman</strong> <strong>Microanalysis</strong><br />
Intensity Intensity Intensity (x10 5 )<br />
2.0<br />
*GBL (liquid) by dispersive <strong>Raman</strong> - White Light Corrected<br />
1.5<br />
1.0<br />
GBL by FT-<strong>Raman</strong><br />
2.0<br />
1.5<br />
1.0<br />
0.5<br />
1.0<br />
γ-Butyrolactone, 99+%<br />
0.8<br />
0.6<br />
0.4<br />
0.2<br />
1800 1600 1400 1200 1000<br />
-1<br />
800 600 400<br />
Figure 1. (top) The dispersive <strong>Raman</strong>, (middle) FT-<strong>Raman</strong>, and (bottom) <strong>Raman</strong> library<br />
reference spectra of <strong>the</strong> controlled substance �-butyrolactone (GBL), a precursor to GBH<br />
(Liquid Ecstasy).<br />
are <strong>in</strong>tegrated completely <strong>in</strong>to a s<strong>in</strong>gle unit, which is computer-controlled,<br />
<strong>in</strong>terlocked for laser safety, and with automated<br />
protocols for calibration and alignment. These <strong>in</strong>struments<br />
are truly walk-up <strong>in</strong>struments that require only a m<strong>in</strong>imal<br />
tra<strong>in</strong><strong>in</strong>g for <strong>the</strong> user to be able to acquire accurate and reproducible<br />
measurements. These advances <strong>in</strong> <strong>in</strong>strument design<br />
have elim<strong>in</strong>ated many if not all <strong>the</strong> barriers to <strong>the</strong> implementation<br />
of <strong>Raman</strong> spectroscopy as a powerful tool alongside <strong>the</strong><br />
Intensity Intensity<br />
1.0<br />
Coca<strong>in</strong>e.HCI 354<br />
0.8<br />
0.6<br />
0.4<br />
0.2<br />
Coca<strong>in</strong>e HCI Std by Almega<br />
3500<br />
3000<br />
2500<br />
2000<br />
1500<br />
1000<br />
500<br />
1800 1600 1400 1200 1000<br />
-1<br />
800 600 400<br />
Figure 2. (top) The dispersive <strong>Raman</strong> spectrum of coca<strong>in</strong>e HCl and (bottom) reference<br />
coca<strong>in</strong>e HCl.<br />
exist<strong>in</strong>g techniques employed <strong>in</strong> <strong>the</strong> forensic laboratory.<br />
There are two different types of <strong>Raman</strong> spectrometers; visible<br />
dispersive <strong>Raman</strong> and Fourier-transform <strong>Raman</strong> (FT-<br />
<strong>Raman</strong>). Dispersive <strong>Raman</strong> <strong>in</strong>struments generally are more<br />
sensitive, and are well-suited for small samples and mapp<strong>in</strong>g<br />
applications where high spatial resolution is required. FT-<br />
<strong>Raman</strong> spectrometers provide fast and accurate results with<br />
<strong>the</strong> benefit of fluorescence-free <strong>Raman</strong> spectra. The <strong>Raman</strong><br />
spectra presented here were acquired us<strong>in</strong>g a <strong>Thermo</strong><br />
Electron Corporation Nicolet Almega dispersive <strong>Raman</strong><br />
microscope and a <strong>Thermo</strong> Electron Corporation FT-<strong>Raman</strong><br />
module. Computer control, data acquisition, and data process<strong>in</strong>g<br />
for both <strong>in</strong>struments were achieved through <strong>Thermo</strong><br />
Electron’s OMNIC suite of software.<br />
<strong>Raman</strong> spectroscopy is ideal for a number of analyses <strong>in</strong> <strong>the</strong><br />
forensic laboratory. These <strong>in</strong>clude but are not limited to: illicit<br />
drug identification, fiber characterization, trace analysis of<br />
explosive materials, and pa<strong>in</strong>t chip analysis. Several examples<br />
are presented here.<br />
Absorbance Absorbance Absorbance<br />
20,000<br />
*Modacrylic CTS 87A0281 LR<br />
15,000<br />
10,000<br />
5000<br />
0<br />
Nylon CTS 87A0330 LR<br />
15,000<br />
10,000<br />
5000<br />
2.0<br />
Polyester CTS 87A0462 LR<br />
1.5<br />
1.0<br />
0.5<br />
3000 2000 1000<br />
Figure 3. The FT-<strong>Raman</strong> spectra of three fibers. A spectral library search us<strong>in</strong>g <strong>the</strong> spectral<br />
database <strong>in</strong> <strong>the</strong> OMNIC software readily identified <strong>the</strong> fibers.<br />
Illicit Drug Analysis<br />
<strong>Raman</strong> spectroscopy offers safe and rapid analysis of many<br />
illicit drugs. In many cases <strong>the</strong> submitted materials can be<br />
analyzed directly through glass vials or plastic evidence bags,<br />
<strong>the</strong>reby avoid<strong>in</strong>g potential evidence tamper<strong>in</strong>g. Figure 1<br />
shows <strong>the</strong> <strong>Raman</strong> spectrum of �-butyrolactone (GBL). GBL is<br />
a controlled substance that is a precursor to GHB (known as<br />
Liquid Ecstasy or Easy Lay). It is a so-called “rave” drug and a<br />
major problem drug. It is a liquid and is analyzed easily us<strong>in</strong>g<br />
FT or dispersive <strong>Raman</strong>. Comparison of <strong>the</strong> collected spectra<br />
with established spectral libraries leads to def<strong>in</strong>itive compound<br />
identification. As a fur<strong>the</strong>r example, Figure 2 presents<br />
<strong>the</strong> <strong>Raman</strong> spectrum of ano<strong>the</strong>r commonly encountered<br />
illicit street drug: coca<strong>in</strong>e HCl.<br />
Fiber Identification<br />
Fibers found at crime scenes can be of prime importance to<br />
some forensic <strong>in</strong>vestigations. Dispersive <strong>Raman</strong> microscopy is<br />
particularly well-suited to trace evidence characterization. The<br />
technique aga<strong>in</strong> requires no sample preparation. The dispersive<br />
<strong>Raman</strong> spectra for three different fibers are shown <strong>in</strong> Figure<br />
3. In each case, fibers were placed on a glass microscope<br />
slide and <strong>the</strong> <strong>Raman</strong> spectra were collected through <strong>the</strong><br />
attached <strong>Raman</strong> microscope us<strong>in</strong>g a 10x objective. The different<br />
fibers are rapidly and easily dist<strong>in</strong>guished from each o<strong>the</strong>r,<br />
and can be identified us<strong>in</strong>g spectral library searches.<br />
Pa<strong>in</strong>t Chip Characterization<br />
Law enforcement is called upon rout<strong>in</strong>ely to <strong>in</strong>vestigate<br />
automobile accidents. In “hit and run” accidents, only traces<br />
of evidence rema<strong>in</strong> at <strong>the</strong> accident scene. Important clues to<br />
<strong>the</strong> identity of <strong>the</strong> vehicle <strong>in</strong>volved <strong>in</strong> <strong>the</strong> accident can reside<br />
-1
1<br />
2<br />
3<br />
4<br />
5a<br />
5b<br />
Bottom primer (5a)<br />
Bottom primer (5)<br />
Dark primer (4)<br />
Light primer (3)<br />
Green - near primer (2a)<br />
Green (2)<br />
Top (1)<br />
3000 2000 1000<br />
<strong>Raman</strong> shift (cm -1 )<br />
Figure 4. (left) Cross-sectional view of a pa<strong>in</strong>t chip with correspond<strong>in</strong>g dispersive<br />
<strong>Raman</strong> spectra.<br />
<strong>in</strong> a small pa<strong>in</strong>t chip. Pa<strong>in</strong>t chips typically conta<strong>in</strong> multiple<br />
layers (for example, primer, bottom coat, and so forth) each<br />
with a dist<strong>in</strong>ct chemical composition. <strong>Raman</strong> microanalysis<br />
of <strong>the</strong> pa<strong>in</strong>t chip layers will aid <strong>in</strong> identify<strong>in</strong>g <strong>the</strong> vehicle<br />
<strong>in</strong>volved <strong>in</strong> <strong>the</strong> crime. Figure 4 shows a cross-sectional view<br />
of a pa<strong>in</strong>t chip subjected to <strong>Raman</strong> microanalysis. No sample<br />
preparation was <strong>in</strong>volved, o<strong>the</strong>r than plac<strong>in</strong>g <strong>the</strong> pa<strong>in</strong>t<br />
chip <strong>in</strong> a clay mount. <strong>Raman</strong> microanalysis characterizes<br />
each of <strong>the</strong> layers <strong>in</strong> <strong>the</strong> pa<strong>in</strong>t chip by simply mov<strong>in</strong>g <strong>the</strong><br />
stage of <strong>the</strong> microscope to each of <strong>the</strong> targeted areas of <strong>in</strong>terest.<br />
Figure 4 shows <strong>the</strong> dist<strong>in</strong>ct <strong>Raman</strong> spectra that are<br />
obta<strong>in</strong>ed from each layer <strong>in</strong> <strong>the</strong> pa<strong>in</strong>t chip.<br />
Conclusion<br />
<strong>Raman</strong> spectroscopy is now recognized to be an <strong>in</strong>dispensable<br />
tool for <strong>the</strong> forensic laboratory. It has a number of <strong>in</strong>herent<br />
advantages over o<strong>the</strong>r techniques. Major advances <strong>in</strong> <strong>in</strong>strumentation<br />
have led to greater reliability, reproducibility, a<br />
much higher level of automation, and greater ease of use.<br />
Instruments now are much easier to ma<strong>in</strong>ta<strong>in</strong> than <strong>the</strong> <strong>in</strong>struments<br />
that were available as recently as five years ago. <strong>Raman</strong><br />
spectroscopy is a powerful technique that can provide rapid<br />
answers to some of <strong>the</strong> most complex problems encountered<br />
<strong>in</strong> <strong>the</strong> forensic laboratory. ■<br />
© Repr<strong>in</strong>ted from SPECTROSCOPY, June 2005 Pr<strong>in</strong>ted <strong>in</strong> U.S.A.<br />
Copyright Notice Copyright by Advanstar Communications Inc. Advanstar Communications Inc. reta<strong>in</strong>s all rights to this article. This article may only be viewed or pr<strong>in</strong>ted (1) for personal use. User may not<br />
actively save any text or graphics/photos to local hard drives or duplicate this article <strong>in</strong> whole or <strong>in</strong> part, <strong>in</strong> any medium. Advanstar Communications Inc. home page is located at http://www.advanstar.com.
<strong>Thermo</strong> Electron Corporation • 5225 Verona Road • Madison, WI 53711 USA<br />
Tel: (608) 276-6100, (800) 532-4752 • Fax: (608) 273-5046 • Email: analyze@<strong>the</strong>rmo.com<br />
Web site: www.<strong>the</strong>rmo.com/raman • Part Number: AR51003_E 09/05M