8 Hour Stability
8 Hour Stability
8 Hour Stability

You also want an ePaper? Increase the reach of your titles
YUMPU automatically turns print PDFs into web optimized ePapers that Google loves.
Application Note:<br />
AN_E0637<br />
Key Words<br />
• ICP-AES<br />
• Environmental<br />
Analysis<br />
• SW-846 Method<br />
6010B<br />
• US EPA<br />
• SW-846 Method<br />
3050B<br />
US EPA SW-846 Method 6010B using the IRIS<br />
Intrepid II ICP-AES<br />
1. Introduction<br />
This Application Note describes the use of the Thermo<br />
Electron Corporation IRIS Intrepid II ICP-AES to carry<br />
out SW-846 Method 6010B compliant analysis. The<br />
method is suitable for the determination of 31 elements<br />
in ground waters, TCLP and EP extracts, industrial and<br />
organic wastes, soils, sludges and sediments. This note<br />
provides data showing compliance with each of the<br />
requirements and highlights the integrated system tools<br />
specifically designed to aid compliance.<br />
2. Background<br />
EPA Historical Facts<br />
In 1970, the United States government established the<br />
Environmental Protection Agency (EPA) in response to<br />
growing public demand for cleaner water, air and land.<br />
Prior to this, the national government was not structured<br />
to deal with pollution that caused harm to human health<br />
and degraded the environment. The EPA was tasked with<br />
repairing the damage already done and moving towards<br />
a cleaner environment. Its mission is to protect human<br />
health and to safeguard the natural environment. The<br />
Agency provides leadership in the nation's<br />
environmental science, research, education and<br />
assessment efforts and works closely with other federal<br />
agencies and local government to develop and enforce<br />
regulations under existing environmental law. The<br />
Agency is responsible for researching and setting national<br />
standards for a variety of environmental programs and<br />
delegates the responsibility for issuing permits, and<br />
monitoring and enforcing compliance, to local<br />
government. Where national standards are not met, the<br />
EPA can issue sanctions and take other steps to assist<br />
local government in reaching the desired levels of<br />
environmental quality. The Agency also works with<br />
industries and all levels of government in a wide variety<br />
of voluntary pollution prevention programs and energy<br />
conservation efforts. Its protocols have also been<br />
adopted as the basis for national or local standards in<br />
many countries around the world.<br />
Office of Solid Waste<br />
The EPA's Office of Solid Waste (OSW) regulates all waste<br />
under the Resource Conservation and Recovery Act<br />
(RCRA). The RCRA's goals are to:<br />
1. Protect the public from the hazards of waste disposal<br />
2. Conserve energy and natural resources by recycling and<br />
recovery<br />
3. Reduce or eliminate waste, and<br />
4. Clean up waste, which may have spilled, leaked, or<br />
been improperly disposed of.<br />
The RCRA tightly regulates all hazardous waste from<br />
production to disposal. The RCRA also controls domestic<br />
and industrial waste. Industrial waste is process waste that<br />
comes from a broad range of operations. Some wastes are<br />
managed by other federal agencies or state laws. Examples<br />
of such wastes are animal waste, radioactive waste, and<br />
medical waste.<br />
The EPA publication SW-846, entitled Test Methods for<br />
Evaluating Solid Waste, Physical/Chemical Methods, is the<br />
OSW's official compendium of over 200 analytical and<br />
sampling methods that have been evaluated and approved<br />
for use for analysis relating to the RCRA regulations. SW-<br />
846 functions primarily as a guidance document setting<br />
forth acceptable, although not required, methods for the<br />
regulated and regulatory communities to use in responding<br />
to RCRA-related sampling and analysis requirements. SW-<br />
846 is a multi-volume document that changes over time as<br />
new information and data are developed. It was first issued<br />
by the EPA in 1980 and is currently in its fourth edition.<br />
Advances in analytical instrumentation and techniques are<br />
continually reviewed by the OSW and incorporated into<br />
periodic updates to SW-846 to support changes in the<br />
regulatory program and to improve method performance<br />
and cost effectiveness. To date, the EPA has finalized<br />
Updates I through IIIA of the SW-846 manual, and the<br />
updated and fully integrated manual contains approximately<br />
3500 pages. The Methods Team of OSW has also made<br />
Draft Updates IVA and IVB available for public discussion.<br />
The SW-846 Method 6010B describes the use of ICP-<br />
AES instrumentation for determining a variety of metallic<br />
elements in aqueous and solid media. In draft edition IVA of<br />
November 2000, updated Method 6010C is under<br />
consideration.
Method 6010B (and draft 6010C)<br />
Both methods are broadly similar and provide guidelines<br />
on general laboratory practices such as sample<br />
preparation, instrument setup, calibration of analytes,<br />
and interference correction equations. They also provide<br />
specific rules on various analytical practices that must be<br />
followed, including elements covered, quality control<br />
practices and instrument validation. Since both methods<br />
are well established and readily available in the public<br />
domain they have become widely adopted as templates<br />
for methodologies used by a host of laboratories<br />
undertaking environmental analysis world-wide. The<br />
aim of the protocol is to ensure a consistently high<br />
quality of analytical data by enforcing compliance with a<br />
variety of stringent instrument and analytical<br />
performance checks.<br />
NOTE: Method 6010C, along with all Draft Update IVA SW-846 methods,<br />
may be downloaded from the EPA OSW website:<br />
http://www.epa.gov/epaoswer/hazwaste/test/up4a.htm<br />
3. Experimental<br />
3.1 Equipment<br />
An IRIS Intrepid II Model XDL ICP-AES (Thermo<br />
Electron Corporation, Franklin, Mass., USA) was used<br />
for the analysis of soil and sludge samples. It was fitted<br />
with a dual view optical design - axial view was used for<br />
elements expected at low concentration where the best<br />
sensitivity is required while radial view was used for<br />
elements at higher concentration or for those elements<br />
that suffer from EIE (Easily Ionised Element) interference.<br />
Internal standards were added on-line using the Internal<br />
Standard Mixing Kit (P/N 13670800).<br />
The instrument conditions used for the analysis are<br />
shown in Table 1 below.<br />
PARAMETER VALUE<br />
RF Forward power 1200 watts<br />
Torch Orientation Dual View<br />
Torch Gas Flow 16 L/min<br />
Auxiliary Gas Flow 0.5 L/min<br />
Mixing Chamber Glass Cyclone<br />
Nebulizer Glass Concentric<br />
Nebulizer Gas 0.65 L/min<br />
Sample Pump Winding 3-stop Orange Tygon<br />
Sample Uptake 1.7 mL/min<br />
Purge Gas Argon<br />
Tank Flow 4 L/min<br />
Nozzle Flow 4 L/min<br />
Camera Flow 1 L/min<br />
Table 1. Intrepid II XDL Parameters<br />
Details of the wavelengths and plasma view<br />
orientations used, as well as the internal standards<br />
employed, are shown in Table 2.<br />
ELEMENT WAVELENGTH PLASMA INTERNAL<br />
(nm) VIEW STANDARD<br />
Ag 328.289 Axial Y 361<br />
Al 308.215 Radial Y360<br />
As 189.042 Axial Y224<br />
B 208.959 Axial Y224<br />
Ba 455.403 Radial Y360<br />
Be 313.107 Radial Y360<br />
Ca 317.933 Radial Y360<br />
Cd 214.438 Axial In230<br />
Co 228.616 Axial In230<br />
Cr 205.552 Axial Y224<br />
Cu 324.754 Axial Y361<br />
Fe 271.441 Radial Y360<br />
In 230.606 Axial Int Std<br />
K 766.491 Radial Y360<br />
Li 670.784 Radial Y360<br />
Mg 279.079 Radial Y360<br />
Mn 257.610 Axial Y361<br />
Mo 202.030 Axial Y224<br />
Na 589.592 Radial Y360<br />
Ni 231.604 Axial In230<br />
P 178.287 Axial In230<br />
Pb 220.353 Axial In230<br />
Sb 206.833 Axial Y224<br />
Se 196.090 Axial Y224<br />
Si 251.612 Radial Y360<br />
Sn 189.989 Axial In230<br />
Ti 334.941 Axial Y361<br />
Tl 190.864 Axial In230<br />
V 292.402 Axial Y361<br />
Y 224.306 Axial Int Std<br />
Y 360.073 Radial Int Std<br />
Y 361.105 Axial Int Std<br />
Zn 206.200 Axial In230<br />
Table 2. Wavelengths and Plasma View used.<br />
3.2 Calibration Solutions<br />
Calibration Solutions<br />
High purity reagents were used throughout. Calibration<br />
standards were prepared in 5%v/v HCl and 1%v/v HNO3<br />
from a range of SPEX ICP standards at concentrations<br />
selected to cover the linear range for each element.<br />
Mixed calibration standards were prepared according<br />
to the conditions laid down in Method 6010B.<br />
SOLUTION ELEMENTS<br />
I Be, Cd, Mn, Pb, Se and Zn<br />
II Ba, Co, Cu, Fe and V<br />
III As and Mo<br />
IV Al, Ca, Cr, K, Na, Ni, Li and Sr<br />
V Ag, Mg, Sb and Tl<br />
VI P<br />
A mixture of 20ppm In and 10ppm Y was used as the<br />
internal standard.
Blanks<br />
Two types of blanks are required for the analysis of<br />
samples prepared by any method other than EPA Method<br />
3050B. The calibration blank is used in establishing the<br />
analytical curve and the method blank is used to identify<br />
possible contamination resulting from either the reagents<br />
(acids) or the equipment used during sample processing<br />
including filtration.<br />
The calibration blank is prepared by acidifying<br />
reagent water to the same concentrations of the acids<br />
found in the standards and samples. A sufficient quantity<br />
must be prepared to flush the system between standards<br />
and samples. The calibration blank will also be used for<br />
all initial (ICB) and continuing calibration blank (CCB)<br />
determinations.<br />
The method blank must contain all of the reagents in<br />
the same volumes as used in the processing of the samples.<br />
The method blank must be carried through the complete<br />
preparation procedure and contain the same acid<br />
concentration in the final solution as the sample solution<br />
used for analysis<br />
Check Solutions<br />
The initial calibration verification (ICV) standard is<br />
prepared by combining compatible elements from a<br />
standard source different from that used to prepare the<br />
calibration standard, and at concentration near the<br />
midpoint of the calibration curve. This standard may also<br />
be purchased commercially.<br />
The continuing calibration verification (CCV)<br />
standard is prepared in the same acid matrix using the<br />
same standards used for calibration, at a concentration<br />
near the mid-point of the calibration curve.<br />
The interference check solution (ICS) is prepared to<br />
contain known concentrations of interfering elements that<br />
will provide an adequate test of the correction factors.<br />
The sample is spiked with the elements of interest,<br />
particularly those with known interferences at the 0.5 to 1<br />
mg/L level.<br />
3.3 Method Development<br />
Interelement Corrections<br />
Due to the complex nature of the matrix experienced with<br />
these types of samples, significant interferences from<br />
spectral overlaps can be observed. As part of the method<br />
development process, high purity solutions of the major<br />
matrix elements, such as Al, Ca, Fe, Mg, Si and P, were<br />
checked for their contribution to the signals of other<br />
analyte elements. After the interfering elements were<br />
identified, their solutions were measured and the<br />
instrument software was used to automatically calculate<br />
the appropriate interference correction factors.<br />
Table 3 lists the major interferences found during this<br />
procedure. A dash indicates that no significant interference<br />
was encountered at the wavelength concerned.<br />
ELEMENT WAVELENGTH (nm) INTERFERING ELEMENT<br />
Ag 328.289 Ca, Fe<br />
Al 308.215 -<br />
As 189.042 -<br />
B 208.959 Al, Fe<br />
Ba 455.403 -<br />
Be 313.107 -<br />
Ca 315.887 -<br />
Cd 214.438 Fe<br />
Co 228.616 Fe<br />
Cr 205.552 Fe<br />
Cu 324.754 Ca, Fe<br />
Fe 271.441 -<br />
In 230.606 -<br />
K 766.491 -<br />
Li 670.784 -<br />
Mg 279.079 -<br />
Mn 257.610 Al, Mg<br />
Mo 202.030 -<br />
Na 589.592 -<br />
Ni 231.604 Al, Fe<br />
P 178.287 -<br />
Pb 220.353 Al, Fe<br />
Sb 206.833 Al, Fe<br />
Se 196.090 Al, Fe<br />
Si 251.612 -<br />
Sn 189.989 -<br />
Ti 334.941 -<br />
Tl 190.864 Mg<br />
V 292.402 Fe<br />
Y 224.306 -<br />
Y 360.073 -<br />
Y 361.105 -<br />
Zn 206.200 Fe, Mg<br />
Table 3. Interelement interferences.<br />
Method 6010B states that interference effects must be<br />
evaluated for each individual instrument and the<br />
interelement corrections should be verified daily by<br />
running an ICS. The measured values must be within 20%<br />
for five consecutive days. They must also be verified and<br />
updated every six months or when changes to the<br />
instrumentation have been made (i.e. changing torch or<br />
nebuliser or plasma conditions).<br />
Method Detection Limits (MDL)<br />
Method Detection Limits were established by measuring a<br />
solution containing all the analytes at concentration levels<br />
which are 3 - 5x the published Instrument Detection<br />
Limits for the IRIS Intrepid II. The solution was analysed<br />
ten times on three separate days and the mean of the three<br />
sigma values from all runs was calculated. Table 4 lists the<br />
MDL’s in mg/L measured in the test and Method 6010B<br />
calls for them to be re-confirmed on a quarterly basis.
ELEMENT WAVELENGTH MDL MAXIMUM<br />
(nm) (µg/L) LINEAR RANGE (mg/L)<br />
Ag 328.289 0.5 10<br />
Al 308.215 11.4 1000<br />
As 189.042 2.1 50<br />
B 208.959 2.2 10<br />
Ba 455.403 0.7 50<br />
Be 313.107 0.1 10<br />
Ca 317.933 2.6 1000<br />
Cd 214.438 0.1 20<br />
Co 228.616 0.2 100<br />
Cr 205.552 0.3 50<br />
Cu 324.754 0.5 50<br />
Fe 271.441 52 1000<br />
K 766.491 30 500<br />
Li 670.784 1.0 50<br />
Mg 279.079 40 1000<br />
Mn 257.610 0.1 20<br />
Mo 202.030 0.5 20<br />
Na 589.592 10 200<br />
Ni 231.604 0.4 50<br />
P 178.287 3.2 20<br />
Pb 220.353 2.1 50<br />
Sb 206.833 2.4 50<br />
Se 196.090 2.8 50<br />
Si 251.612 7.2 50<br />
Sn 189.989 1.8 50<br />
Ti 334.941 0.2 20<br />
Tl 190.864 1.6 100<br />
V 292.402 0.6 50<br />
Zn 206.200 0.2 20<br />
Table 4. Wavelengths, Method Detection Limits and Maximum Linear Range.<br />
Linear Concentration Range<br />
The upper limit of the linear dynamic range must be<br />
established for each analyte and instrument configuration.<br />
The upper range limit should result in an observed signal<br />
no more than 10% below the level extrapolated from the<br />
normal calibration curve. This check should be carried<br />
out whenever instrument changes occur and at six<br />
monthly intervals as a minimum.<br />
This evaluation is very important when using interelement<br />
correction since, if the linear range is exceeded for<br />
the interfering element measurement, the calculated<br />
correction factor will be incorrect and the analytical result<br />
will be in error.<br />
For some elements the plasma is viewed in radial<br />
mode using a weaker line to improve the linear range.<br />
This results in less chance of some samples being overrange<br />
so that more accurate data is achieved. Table 4<br />
shows the maximum linear range figures in mg/L.<br />
Background Correction Points<br />
Method 6010B requires that off-peak background<br />
correction is used for trace element determinations. The<br />
background was measured simultaneously by monitoring<br />
the signal in pixels adjacent to the analyte peak position.<br />
The ideal position of background correction points was<br />
determined by examining spectra in subarrays for a<br />
calibration blank, calibration standard and spiked matrix<br />
solution. The points selected for analysis should take into<br />
account any spectral interferences that may be present.<br />
The documented data for all decisions related to<br />
wavelength choice (where different to the EPArecommended<br />
lines), background correction points,<br />
interelement corrections and MDL’s must be kept on file<br />
and be available for review by the data user or auditor.<br />
4. Results and Discussion<br />
4.1 Initial (ICV) and Continuing (CCV) Calibration<br />
Verification<br />
Method 6010B requires that a very strict quality control<br />
procedure is followed to ensure validity of sample data.<br />
Quality control checks are carried out following<br />
instrument calibration, during sample analysis and at the<br />
end of the analytical run. For the sample data to be<br />
acceptable all checks must meet the required criteria.<br />
The instrument was set up using the parameters shown in<br />
Table 1 and allowed to stabilise for 30 minutes prior to<br />
calibration.<br />
Immediately after calibration, an Initial Calibration<br />
Verification (ICV) solution, calibration blank and<br />
Continuing Calibration Verification (CCV) solution were<br />
run. The calibration blank value must be within 3 times<br />
the Method Detection Limit (MDL) while the calibration<br />
verification solution results must be within 10% of their<br />
calibrated value. In addition, the standard deviation for a<br />
minimum of 2 resamples must be less than 5% for the<br />
data to be acceptable. Typical results are shown in Table 5<br />
below.<br />
Analysis of the CCV solution and calibration blank<br />
was then repeated every 10 samples to ensure that the<br />
instrument remained in calibration.<br />
4.2 Interference Check Solutions<br />
Prior to the start of each sample analysis, interference<br />
check solutions were run to verify that the inter-element<br />
correction factors and background correction points were<br />
still valid.<br />
Interference Check Sample A (ICSA) was prepared<br />
containing 500mg/L Al, Ca, Mg and 200mg/L Fe.<br />
Interference Check Solution AB was then prepared by<br />
spiking this solution at concentrations of 0.05 to 1mg/L<br />
for the analyte elements. The values measured for ICSAB<br />
must be within 20% of the true value for the data to be<br />
acceptable. Data is shown in Table 6 below.
ELEMENT ICV (µg/g) CCV (µg/g)<br />
ACTUAL MEASURED ACTUAL MEASURED<br />
Ag 1 0.96 0.5 0.51<br />
Al 200 202 100 99.7<br />
As 1 0.99 0.5 0.48<br />
B 1 0.99 0.5 0.5<br />
Ba 10 10.3 5 4.97<br />
Be 1 1.02 0.5 0.52<br />
Ca 200 201 100 98.8<br />
Cd 1 1.03 0.5 0.49<br />
Co 10 10.5 5 5.02<br />
Cr 10 10.2 5 5.05<br />
Cu 10 9.80 5 4.98<br />
Fe 200 203 100 101<br />
K 100 98.7 50 49.9<br />
Mg 100 101 50 50.5<br />
Mn 10 9.85 5 4.92<br />
Mo 1 1.02 0.5 0.48<br />
Na 100 102 50 51.2<br />
Ni 10 10.1 5 5.10<br />
P 10 10.2 5 5.07<br />
Pb 10 9.93 5 5.04<br />
Sb 1 0.98 0.5 0.48<br />
Se 1 1.05 0.5 0.53<br />
Ti 10 10.1 5 5.02<br />
Tl 1 0.97 0.5 0.48<br />
V 10 10.4 5 4.89<br />
Zn 10 10.1 5 5.02<br />
Table 5. Calibration QC Checks.<br />
4.3 Correction Factor <strong>Stability</strong> Evaluation<br />
The IRIS Intrepid II XDL spectrometer has a highly<br />
regulated temperature controlled optical system. This<br />
ensures that peak analytical performance is maintained<br />
over extended time periods, despite any fluctuations in the<br />
general laboratory conditions.<br />
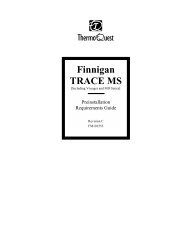
An interference correction was set up for Fe on Cd<br />
and then a high purity iron solution was measured over<br />
an 8 hour period in order to assess the amount of drift on<br />
the Cd signal in this time frame. A plot of the data is<br />
shown in Figure 1.<br />
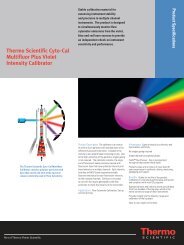
To provide additional evidence of the instrument<br />
stability, a nominal 100 ppb multielement standard was<br />
analysed over an 8 hour period, without any calibration<br />
updates. The plots are shown in Figure 2 and illustrate the<br />
inherent stability of the system.<br />
ELEMENT ICSA ICSAB TARGET VALUE %<br />
(µg/L) (µg/L) (µg/L) RECOVERY<br />
Ag < 0.5 98.7 100 98.7<br />
As -1.3 100.7 100 100.7<br />
B < 2 499 500 99.8<br />
Ba < 0.7 486 500 97.2<br />
Be < 0.1 495 500 99.0<br />
Cd < 0.1 103 100 103<br />
Co < 0.2 489 500 97.8<br />
Cr < 0.3 476 500 95.2<br />
Cu < 0.5 478 500 95.6<br />
Mn < 0.1 512 500 102<br />
Mo < 0.5 478 500 95.6<br />
Ni < 0.4 952 1000 95.2<br />
P < 3 475 500 95<br />
Pb < 2 48.9 50 97.8<br />
Sb < 2 503 500 101<br />
Se < 3 58 50 116<br />
Si < 7 47 50 94<br />
Ti < 0.2 507 500 101<br />
Tl < 2 88.5 100 88.5<br />
V < 0.6 487 500 97.4<br />
Zn < 0.2 1012 1000 101<br />
Table 6. Results for Interference Check Solutions.<br />
4.4 Sample Results<br />
After the successful analysis of the specified quality<br />
control solutions, the actual sample analysis sequence can<br />
begin. With the exception of groundwater samples, all<br />
aqueous and solid matrices require acid digestion prior to<br />
analysis. Recommended dissolution procedures for real<br />
samples are given in EPA Method 3050B or 3051A (the<br />
latter being a microwave-assisted version of the former).<br />
Groundwater samples that have been pre-filtered and<br />
acidified do not need acid digestion.<br />
It is general practice to include at least one Laboratory<br />
Control Sample (LCS) in each run, the LCS normally<br />
being a Standard Reference Material with a similar matrix<br />
to the samples being analysed. In this particular analysis, a<br />
sample of Buffalo River Sediment (NBS SRM2704) was<br />
prepared and used as the LCS.<br />
This sample can also be prepared and analysed in<br />
duplicate, at least once per analysis, in order to check for<br />
contamination problems. The sample was also spiked and<br />
analysed to monitor spike recoveries.<br />
Method 6010B states that duplicate samples must<br />
agree within 20% of each other and spiked samples must<br />
be recovered within 25% of the actual value.
Concentration (ug/L)<br />
110<br />
105<br />
100<br />
95<br />
90<br />
85<br />
80<br />
10:38<br />
11:15<br />
11:44<br />
8 <strong>Hour</strong> Run, drift of Corrected Cadmium with Iron IEC<br />
12:16<br />
12:48<br />
13:14<br />
13:40<br />
EPA Acceptable Range<br />
EPA Acceptable Range<br />
13:57<br />
8 <strong>Hour</strong> <strong>Stability</strong><br />
1 21 41 61 81 101 121<br />
Sample number<br />
ELEMENT MEASURED CONCENTRATION CERTIFIED VALUE<br />
As 23.1µg/g 23.4+/- 0.8<br />
Ba 407µg/g 414 +/- 12<br />
Ca 2.55% 2.60 +/- 0.03<br />
Cd 3.50µg/g 3.45 +/- 0.22<br />
Co 14.3µg/g 14 +/- 0.6<br />
Cr 132µg/g 135 +/- 5<br />
Cu 100.2µg/g 98.6 +/- 5.0<br />
Fe 4.03% 4.11 +/- 0.10<br />
K 2.02% 2.00 +/- 0.04<br />
Mg 1.21% 1.20 +/- 0.02<br />
Mn 547µg/g 555 +/- 19<br />
Na 0.53% 0.547 +/- 0.014<br />
Ni 43.8µg/g 44.1 +/- 3.0<br />
Pb 163µg/g 161 +/- 17<br />
Sb 3.61µg/g 3.79 +/- 0.15<br />
Ti 0.46% 0.457 +/- 0.018<br />
V 93µg/g 95 +/- 4<br />
Zn 440µg/g 438 +/- 12<br />
Table 7. NBS 2704 Buffalo River Sediment Data<br />
14:25<br />
15:12<br />
15:40<br />
15:55<br />
16:25<br />
16:50<br />
17:18<br />
17:42<br />
18:00<br />
2<br />
1.5<br />
1<br />
0.5<br />
0<br />
-0.5 -<br />
-1 -<br />
-1.5 -<br />
-2 -<br />
PPB<br />
As1890<br />
Ba4554<br />
Cd2288<br />
Pb2203<br />
Se1960<br />
Zn2138<br />
Figure 1. <strong>Stability</strong> of<br />
the Fe interelement<br />
correction factor for<br />
Cd<br />
Figure 2. <strong>Stability</strong> of a<br />
100ppb multielement<br />
standard over an 8<br />
hour period<br />
Table 7 compares the measured and certified results<br />
for the SRM2704 Buffalo River Sediment sample,<br />
demonstrating the excellent agreement between them.
Table 8 shows the results for a duplicate analysis test<br />
with the LCS sample. Agreement between duplicates is<br />
generally within 1%, well within the EPA limit of 20%.<br />
ELEMENT ANALYSIS 1 ANALYSIS 2 % DIFFERENCE<br />
As 23.1µg/g 23.3µg/g 0.8<br />
Ba 407µg/g 403µg/g 1.0<br />
Ca 2.55% 2.54% 0.4<br />
Cd 3.50µg/g 3.46µg/g 1.1<br />
Co 14.3µg/g 14.4µg/g 0.7<br />
Cr 132µg/g 131µg/g 0.8<br />
Cu 100.2µg/g 101µg/g 0.8<br />
Fe 4.03% 4.04% 0.3<br />
K 2.02% 2.03% 0.6<br />
Mg 1.21% 1.20% 0.3<br />
Mn 547µg/g 543µg/g 0.8<br />
Na 0.53% 0.54% 1.8<br />
Ni 43.8µg/g 44.1µg/g 0.7<br />
Pb 163µg/g 163µg/g 0.2<br />
Sb 3.61µg/g 3.65µg/g 1.1<br />
Ti 0.46% 0.46% 0.4<br />
V 93.0µg/g 92.3µg/g 0.8<br />
Zn 440µg/g 435µg/g 1.1<br />
Table 8. NBS 2704 Buffalo River Sediment Duplicate Analysis Test<br />
Table 9 shows the recoveries from spiked samples of<br />
the LCS, again all well within the EPA 25% limit.<br />
ELEMENT CERTIFIED VALUE SPIKE CONC MEASURED VALUE % REC<br />
www.thermo.com/elemental<br />
µg/L µg/L µg/L<br />
As 230 50 276 92<br />
Ba 4140 100 4234 94<br />
Cd 34.5 10 43.6 91<br />
Co 140 10 151 110<br />
Cr 1350 50 1402 104<br />
Cu 986 50 1033 94<br />
Mn 5550 100 5652 102<br />
Ni 441 10 450 90<br />
Pb 1610 50 1656 92<br />
Sb 37.9 10 47.0 91<br />
V 950 50 1004 108<br />
Zn 4380 100 4482 102<br />
Table 9. NBS 2704 Buffalo River Sediment Spike Sample Recovery Data<br />
In order to check that the method works for different<br />
sample matrices, a reference sample of a sewage sludge<br />
(BCR146) was analysed using exactly the same procedure.<br />
Table 10 compares the measured and certified results for<br />
the sediment sample, demonstrating the excellent<br />
agreement. Values in brackets are advisory figures only.<br />
USA: 5225 Verona Road<br />
Madison, WI 53711-4495<br />
Tel: +1 800 201 8132, +1 608 276 6100<br />
Fax: +1 608 273 5046<br />
Email: spectroscopy@thermo.com<br />
ELEMENT MEASURED CONCENTRATION CERTIFIED VALUE<br />
Ca 10.2% (10.14%)<br />
Cd 75.8µg/g 77.7 +/- 2.6<br />
Co 11.9µg/g 11.8 +/- 0.7<br />
Cu 928µg/g 934 +/- 24<br />
Fe 1.80% (1.86%)<br />
K 0.49% (0.48%)<br />
Mg 2.01% (1.99%)<br />
Mn 570µg/g 588 +/- 24<br />
Na 0.21% (0.22%)<br />
Ni 276µg/g 280 +/- 18<br />
P 2.52% (2.58%)<br />
Pb 1260µg/g 1270 +/- 28<br />
Zn 4040µg/g 4059 +/- 90<br />
Table 10. BCR146 Sewage Sludge Data<br />
5. Conclusions<br />
The IRIS Intrepid II demonstrates SW-846 Method 6010B<br />
compliant analysis for a range of sample types and easily<br />
copes with the stringent interference checks and AQC<br />
requirements stipulated for use in this method.<br />
The IRIS Intrepid II is the latest generation of IRIS<br />
ICP Spectrometers from Thermo Electron. It incorporates<br />
a new design of the exclusive charge injection device<br />
(CID) detector housed in a highly regulated optical<br />
system. The result of these product developments is an<br />
instrument that is capable of providing extremely low<br />
detection limits and excellent long term stability. This<br />
makes the IRIS Intrepid II ideally suited for cost-effective<br />
elemental analysis in the environmental field.<br />
References<br />
USEPA SW-846 Method 3050B, Revision 2, December 1996.<br />
USEPA SW-846 Method 3051A, Revision 1, January 1998.<br />
USEPA SW-846 Method 6010B, Revision 2, December 1996.<br />
USEPA SW-846 Method 6010C, Revision 3, November 2000.<br />
UK: 19 Mercers Row<br />
Cambridge, CB5 8BZ, UK<br />
Tel: +44 (0)1223 345410<br />
Fax: +44 (0)1223 345411<br />
Email: spectroscopy.uk@thermo.com<br />
Switzerland: En Vallaire Ouest C<br />
case postale, CH-1024, Ecublens<br />
Tel: +41 (0)21 694 71 11<br />
Fax: +41 (0)21 694 71 12<br />
Email: spectroscopy.ch@thermo.com<br />
Thermo Electron Corporation<br />
has direct subsidiary offices in<br />
North America, Europe and<br />
Japan. To complement these<br />
direct subsidiaries, we maintain<br />
a network of representative<br />
organizations throughout the<br />
world. Use this reference list or<br />
visit our Web site to locate the<br />
representative nearest you.<br />
Australia<br />
Tel: +61 (0)2 9898 1244<br />
Austria<br />
Tel: +43 (0)1 333 50 34 0<br />
Belgium<br />
Tel: +32 2482 3030<br />
Canada<br />
Tel: +1 905 890 1034<br />
China<br />
Thermo ARL:<br />
Tel: +86 10 6833 6715<br />
Thermo Elemental:<br />
Tel: +86 10 6592 0232<br />
Thermo Nicolet:<br />
Tel: +86 10 6597 3388 ext 2912<br />
France<br />
Tel: +33 (0)1 39 30 53 00<br />
Germany<br />
Tel: +49 (0)6102 3671 0<br />
Italy<br />
Tel: +39 02 6601 6351<br />
Japan<br />
Thermo Elemental:<br />
Tel: +81 774 201245<br />
Thermo Nicolet:<br />
Tel: +81 45 450 1112<br />
Netherlands<br />
Tel: +31 76 5724840<br />
Nordic<br />
Thermo Nicolet:<br />
Tel: +358 9 3291 00<br />
Thermo ARL:<br />
Tel: +46 (0)8 556 468 31<br />
South Africa<br />
Tel: +27 (0) 11 570 1840<br />
Spain<br />
Tel: +34 (91) 657 49 30<br />
©2003 Thermo Electron Corp.<br />
All rights reserved worldwide.<br />
We make no warranties,<br />
expressed or implied, in<br />
this product summary, and<br />
information is subject to<br />
change without notice.<br />
All product and company<br />
names are property of their<br />
respective owners.<br />
AN_E0637 06/03