8 Hour Stability
8 Hour Stability
8 Hour Stability

You also want an ePaper? Increase the reach of your titles
YUMPU automatically turns print PDFs into web optimized ePapers that Google loves.
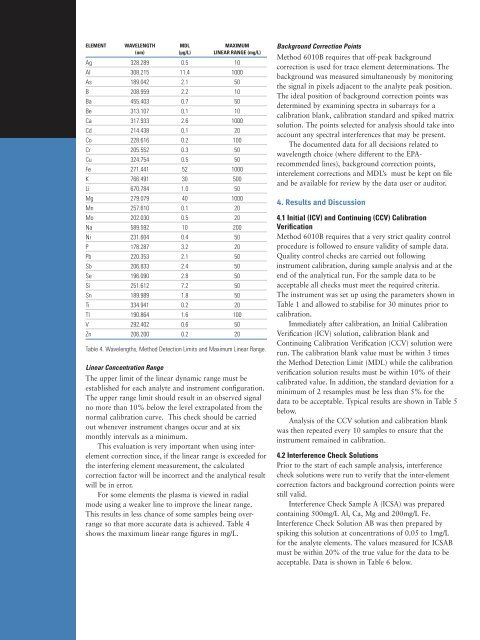
ELEMENT WAVELENGTH MDL MAXIMUM<br />
(nm) (µg/L) LINEAR RANGE (mg/L)<br />
Ag 328.289 0.5 10<br />
Al 308.215 11.4 1000<br />
As 189.042 2.1 50<br />
B 208.959 2.2 10<br />
Ba 455.403 0.7 50<br />
Be 313.107 0.1 10<br />
Ca 317.933 2.6 1000<br />
Cd 214.438 0.1 20<br />
Co 228.616 0.2 100<br />
Cr 205.552 0.3 50<br />
Cu 324.754 0.5 50<br />
Fe 271.441 52 1000<br />
K 766.491 30 500<br />
Li 670.784 1.0 50<br />
Mg 279.079 40 1000<br />
Mn 257.610 0.1 20<br />
Mo 202.030 0.5 20<br />
Na 589.592 10 200<br />
Ni 231.604 0.4 50<br />
P 178.287 3.2 20<br />
Pb 220.353 2.1 50<br />
Sb 206.833 2.4 50<br />
Se 196.090 2.8 50<br />
Si 251.612 7.2 50<br />
Sn 189.989 1.8 50<br />
Ti 334.941 0.2 20<br />
Tl 190.864 1.6 100<br />
V 292.402 0.6 50<br />
Zn 206.200 0.2 20<br />
Table 4. Wavelengths, Method Detection Limits and Maximum Linear Range.<br />
Linear Concentration Range<br />
The upper limit of the linear dynamic range must be<br />
established for each analyte and instrument configuration.<br />
The upper range limit should result in an observed signal<br />
no more than 10% below the level extrapolated from the<br />
normal calibration curve. This check should be carried<br />
out whenever instrument changes occur and at six<br />
monthly intervals as a minimum.<br />
This evaluation is very important when using interelement<br />
correction since, if the linear range is exceeded for<br />
the interfering element measurement, the calculated<br />
correction factor will be incorrect and the analytical result<br />
will be in error.<br />
For some elements the plasma is viewed in radial<br />
mode using a weaker line to improve the linear range.<br />
This results in less chance of some samples being overrange<br />
so that more accurate data is achieved. Table 4<br />
shows the maximum linear range figures in mg/L.<br />
Background Correction Points<br />
Method 6010B requires that off-peak background<br />
correction is used for trace element determinations. The<br />
background was measured simultaneously by monitoring<br />
the signal in pixels adjacent to the analyte peak position.<br />
The ideal position of background correction points was<br />
determined by examining spectra in subarrays for a<br />
calibration blank, calibration standard and spiked matrix<br />
solution. The points selected for analysis should take into<br />
account any spectral interferences that may be present.<br />
The documented data for all decisions related to<br />
wavelength choice (where different to the EPArecommended<br />
lines), background correction points,<br />
interelement corrections and MDL’s must be kept on file<br />
and be available for review by the data user or auditor.<br />
4. Results and Discussion<br />
4.1 Initial (ICV) and Continuing (CCV) Calibration<br />
Verification<br />
Method 6010B requires that a very strict quality control<br />
procedure is followed to ensure validity of sample data.<br />
Quality control checks are carried out following<br />
instrument calibration, during sample analysis and at the<br />
end of the analytical run. For the sample data to be<br />
acceptable all checks must meet the required criteria.<br />
The instrument was set up using the parameters shown in<br />
Table 1 and allowed to stabilise for 30 minutes prior to<br />
calibration.<br />
Immediately after calibration, an Initial Calibration<br />
Verification (ICV) solution, calibration blank and<br />
Continuing Calibration Verification (CCV) solution were<br />
run. The calibration blank value must be within 3 times<br />
the Method Detection Limit (MDL) while the calibration<br />
verification solution results must be within 10% of their<br />
calibrated value. In addition, the standard deviation for a<br />
minimum of 2 resamples must be less than 5% for the<br />
data to be acceptable. Typical results are shown in Table 5<br />
below.<br />
Analysis of the CCV solution and calibration blank<br />
was then repeated every 10 samples to ensure that the<br />
instrument remained in calibration.<br />
4.2 Interference Check Solutions<br />
Prior to the start of each sample analysis, interference<br />
check solutions were run to verify that the inter-element<br />
correction factors and background correction points were<br />
still valid.<br />
Interference Check Sample A (ICSA) was prepared<br />
containing 500mg/L Al, Ca, Mg and 200mg/L Fe.<br />
Interference Check Solution AB was then prepared by<br />
spiking this solution at concentrations of 0.05 to 1mg/L<br />
for the analyte elements. The values measured for ICSAB<br />
must be within 20% of the true value for the data to be<br />
acceptable. Data is shown in Table 6 below.