ASQ13 EN

Create successful ePaper yourself
Turn your PDF publications into a flip-book with our unique Google optimized e-Paper software.
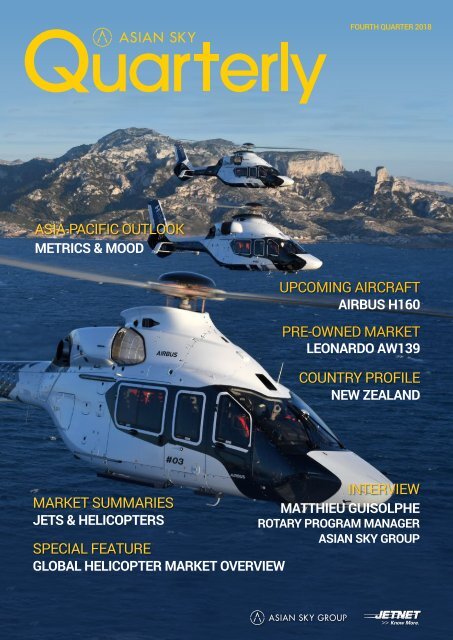
FOURTH QUARTER 2018<br />
ASIA-PACIFIC OUTLOOK<br />
METRICS & MOOD<br />
UPCOMING AIRCRAFT<br />
AIRBUS H160<br />
PRE-OWNED MARKET<br />
LEONARDO AW139<br />
COUNTRY PROFILE<br />
NEW ZEALAND<br />
MARKET SUMMARIES<br />
JETS & HELICOPTERS<br />
SPECIAL FEATURE<br />
GLOBAL HELICOPTER MARKET OVERVIEW<br />
INTERVIEW<br />
MATTHIEU GUISOLPHE<br />
ROTARY PROGRAM MANAGER<br />
ASIAN SKY GROUP
AVAILABLE MARCH 04, 2019<br />
YEAR <strong>EN</strong>D 2018<br />
A BREAKDOWN OF THE ASIA<br />
PACIFIC CIVIL HELICOPTER FLEET<br />
SPECIAL FEATURES:<br />
EMS Operations<br />
Helicopter Leasing<br />
Offshore O & G and<br />
Alternative Energy<br />
ASIANSKYMEDI
PUBLISHER’S NOTE<br />
The US has its “Sage of Omaha” in Warren Buffet. Here in Asia we have<br />
Superman – Li Ka Shing. And he’s “super” because he started work at<br />
the tender age of 15 in a plastics trading company and when he retired<br />
in 2018 was worth US$38B and held the title of the “Richest Man in<br />
Asia”. So when Mr. Li speaks, people listen. Recently, looking ahead at<br />
the economy in 2019, he said “it will probably be very complicated –<br />
everyone should be cautious”. You could literally hear the wallets being<br />
put back into pockets. Other industry giants in China have joined in.<br />
Baidu CEO and the Chairman of Cheung Kei Group have warned “winter<br />
is coming” and that this winter will be “colder and longer than expected”.<br />
Then on the heels of these dire proclamations, just this week the data<br />
showed the Chinese economy grew at its lowest rate in 10 years – a<br />
mere 6.6% - with expectations that it will worsen through the year.<br />
Not a surprise then that people are buying less mobile phones, cars …<br />
and aircraft and selling them too. Through 2018 ASG’s transactional<br />
consulting business, we saw mostly an outflow of aircraft from Greater<br />
China and into the US & Canada. Sellers I would categorize as a mixture<br />
of replacement, with a new aircraft either delivered or on order; hard to<br />
still justify, who only used the aircraft for 100 hrs a year anyway; and<br />
desperate, those with the bank knocking on the door of which there were<br />
quite a few. Not quite repossessions but controlled resales by the lender.<br />
It is with great anticipation therefore the industry waits for this year’s<br />
ASG Asia-Pacific Business Jet Fleet report. I’m asked quite often these<br />
days whether the data is ready yet and did the fleet expand or actually<br />
contract in 2018 – that’s how bad the perception is at the moment. We’ll<br />
know at ABACE 2019 in Shanghai.<br />
felt with operators looking for ways to utilize their once valuable assets,<br />
and the overall market is faced with an oversupply. But, again, we’ll see<br />
the real impact of all this in the upcoming Fleet Report.<br />
A knock on effect of this fleet turmoil is certainly hard times for the<br />
management companies, with making a buck becoming harder and<br />
harder. 2018 had everything. We saw management companies go<br />
bankrupt & put their AOCs up for sale; whole fleets of aircraft being put<br />
on the market in an effort to downsize & survive; senior management<br />
changes; and business model adjustments.<br />
We expect more of the same in 2019 with management companies<br />
right sizing, consolidating and seeking other sources of revenue. Every<br />
management company it seems is an aircraft broker now, others<br />
developing their MRO business or opening FBOs, all in an effort to<br />
generate more revenue and grow.<br />
This issue will give a hint at what’s to come, particularly in our special<br />
feature — Global Helicopter Market Overview, which is a historical<br />
analysis of the market. For our usual in-depth, pre-owned analysis, we’re<br />
looking at the AW139. We’ve also profiled the H160, which is set for entry<br />
onto the market later this year.<br />
The country profile this time around is New Zealand, giving some insight<br />
on its rotary market. And, we speak with one of ASG’s latest additions —<br />
Matthieu Guisolphe, Rotary Program Manager — who is based in Kuala<br />
Lumpur, Malaysia on the Southeast Asian rotary market.<br />
As always, we hope this information is insightful.<br />
All this uncertainly fills the pages this issue of Asian Sky Quarterly –<br />
the market is more pessimistic, with aircraft utilizations & purchase<br />
intentions down, with just more “I’m not sure” overall.<br />
The 2018 Q4 issue of Asian Sky Quarterly comes out just before the<br />
annual Asia-Pacific Civil Helicopter Fleet Report is released in early<br />
March, as such we focus a lot of our attention this issue on the helicopter<br />
market. Like the business jet market, the helicopter market faced turmoil<br />
in 2018; a major leasing company filed for bankruptcy shaking up the<br />
market quite a bit, the after effects of the O&G market were still being<br />
Sincerely,<br />
Jeffrey C. Lowe<br />
Managing Director, Asian Sky Group<br />
SPECIAL THANKS TO OUR CONTRIBUTORS:<br />
FOURTH QUARTER 2018 — ASIAN SKY QUARTERLY | 1
CONT<strong>EN</strong>TS<br />
04 ECONOMICS<br />
34<br />
Overview of the Asia-Pacific’s region current status and<br />
specific country’s GDP versus their business jet and<br />
helicopter fleet size.<br />
MARKET DYNAMICS<br />
An in-depth analysis of inventory levels, market trends and<br />
the changing price signals for the business jet and helicopter<br />
fleets in the Asia-Pacific region, given the continual<br />
fluctuations in supply and demand.<br />
08<br />
14<br />
22<br />
28<br />
MOOD & INT<strong>EN</strong>TIONS<br />
Results of our survey on the Asia-Pacific region’s outlook on<br />
economic status, aircraft utilization, purchase intentions and<br />
influencing factors.<br />
COUNTRY PROFILE - NEW ZEALAND<br />
Overview and examination of New Zealand’s growing rotary<br />
industry, current challenges and potential for the future.<br />
SPECIAL FEATURE:<br />
HELICOPTER MARKET OVERVIEW<br />
A historical look into the global helicopter market, featuring<br />
data on pre-owned helicopters and new deliveries.<br />
PRE-OWNED SPOTLIGHT<br />
LEONARDO AW139<br />
A comprehensive market performance analysis of the preowned<br />
AW139 market.<br />
42<br />
45<br />
50<br />
60<br />
INTERVIEW:<br />
MATTHIEU GUISOLPHE,<br />
ROTARY PROGRAM MANAGER; ASG<br />
Discussing the growing trend of helicopters used for VIP/<br />
corporate use in Southeast Asian market.<br />
UPCOMING SPOTLIGHT<br />
AIRBUS HELICOPTERS H160<br />
An introduction to the H160, with a complete look at the<br />
new helicopter’s operational uses.<br />
MARKET SUMMARY - JETS<br />
A look at market position and average days on market of<br />
featured pre-owned business jets.<br />
MARKET SUMMARY - HELICOPTERS<br />
A look at market position and average days on market of<br />
featured pre-owned helicopters.<br />
PUBLISHER<br />
EDITORIAL<br />
Litalia Yoakum<br />
Roderick Li<br />
DESIGN<br />
Michael Wong<br />
Aya Leung<br />
Robert Li<br />
MARKET RESEARCH & DATA ANALYSIS<br />
Bowen Zhang<br />
Avinava Sengupta<br />
Jordan Yuen<br />
Victor Li<br />
Casper Zhuang<br />
MEDIA SALES DIRECTOR<br />
Alison Pang<br />
The materials and information provided by Asian Sky<br />
Group Limited (“ASG”) in this report is for reference<br />
only. Any information we provide about how we may<br />
interpret the data and market, or how certain issues<br />
may be addressed is provided generally without<br />
considering your specific circumstances. Such<br />
information should not be regarded as a substitute<br />
for professional advice. Independent professional<br />
advice should be sought before taking action on any<br />
matters to which information provided in this report<br />
may be relevant.<br />
ASG shall not be liable for any losses, damage, costs<br />
or expenses howsoever caused, arising directly or<br />
indirectly from the use of or inability to use this report<br />
or use of or reliance upon any information or material<br />
provided in this report or otherwise in connection with<br />
any representation, statement or information on or<br />
contained in this report.<br />
ASG endeavors to ensure that the information<br />
contained in this report is accurate as at the date<br />
of publication, but does not guarantee or warrant<br />
its accuracy or completeness, or accept any liability<br />
of whatever nature for any losses, damage, costs<br />
or expenses howsoever caused, whether arising<br />
directly or indirectly from any error or omission in<br />
compiling such information. This report also uses<br />
third party information not compiled by ASG. ASG<br />
is not responsible for such information and makes<br />
no representation about the accuracy, completeness<br />
or any other aspect of information contained. The<br />
information, data, articles, or resources provided by<br />
any other parties do not in any way signify that ASG<br />
endorses the same.<br />
ADVERTISING/AIRCRAFT SALES <strong>EN</strong>QUIRIES:<br />
Alison Pang: apang@asianskygroup.com<br />
Asian Sky Group<br />
Suite 1401, 14 Floor, Fortis Tower<br />
77-79 Gloucester Road, Wan Chai, Hong Kong<br />
Tel: (852) 2235 9222 | Fax: (852) 2528 2766<br />
sales@asianskygroup.com<br />
www.asianskygroup.com<br />
www.asianskymedia.com<br />
2 | ASIAN SKY QUARTERLY — FOURTH QUARTER 2018
Chris is a Senior Airworthiness Inspector<br />
who’s always loved to travel. His many<br />
years of aviation experience and expertise<br />
go far when it comes to getting your<br />
aircraft inspected and certified. Check in<br />
with Chris if you need a fast turnaround,<br />
he can usually inspect and issue<br />
certificates on the same day. Go Chris!<br />
Find out how we can help you with<br />
your aircraft registration needs at<br />
bermudaaircraftregistry.bm<br />
Connect with us<br />
PUTTING YOU AT THE C<strong>EN</strong>TRE<br />
OF EVERYTHING WE DO
2018Q3 ECONOMICS<br />
Australia<br />
Australia’s economy slowed in the third quarter of 2018, growing 2.8%<br />
year-on-year (y/y); down from Q2’s 3.1% growth (revised from 3.4%).<br />
Household consumption was the main contributor of the weakened<br />
growth, driven by low discretionary spending — durable goods, apparel,<br />
entertainment and leisure.<br />
Mainland China<br />
China’s economy fell to 6.5% y/y in Q3, amid a growing trade war with<br />
the US, marking the lowest growth rate since the first quarter of 2009<br />
during the global financial crisis. Still, the economy remains on track<br />
to meet and exceed the full-year growth expectation of 6.5%. Slowed<br />
growth is attributed to weakened domestic demand.<br />
Hong Kong<br />
Hong Kong’s economy grew 2.9% y/y in Q3, down from 3.5% in Q2. Still,<br />
the two-year low met market expectations. The growth is attributed<br />
to consumer spending, which has continued to slow over the year,<br />
impacted by a decline in the stock and property markets. Hong Kong<br />
continues to be vulnerable to the regional trade conflict. Forecasts<br />
predict Hong Kong’s economy will slow in coming quarters.<br />
India<br />
India’s economy slipped to 7.1% y/y in Q3, down from 8.2% in the<br />
previous quarter as consumption demand moderated and the farm<br />
sector slowed. Still, India remained the world’s fastest-growing major<br />
economy, ahead of China.<br />
Indonesia<br />
Indonesia’s economy expanded 5.2% y/y in Q3, down only slightly from<br />
5.27% in Q2. Domestic demand continued to be the driver of growth in<br />
Q3. Government consumption expanded, as well, supported by spending<br />
on the Asian Games held August through September. Analysts forecast<br />
private consumption will continue to drive the economy.<br />
Japan<br />
Japan’s economy contracted to 1.2% y/y in Q3; a three-year low. The<br />
contraction is largely attributed to several natural disasters hitting the<br />
country, including torrential rain, a typhoon and an earthquake. Nearly<br />
all factors considered in GDP faced decline. However, the economy is<br />
expected to recover in Q4.<br />
Malaysia<br />
Malaysia’s GDP slipped slightly to 4.4% y/y in Q3, down from 4.5% in Q2,<br />
marking the fourth quarter of decline. Growth in Q3 was supported by<br />
an increase in household and private spending. The sudden bottoming<br />
out of the liquefied natural gas and palm oil markets lowered growth<br />
of the economy. However, the Bank Negara Malaysia has advised that<br />
the decline in oil prices will not have an impact on the growth projection<br />
for 2019.<br />
Philippines<br />
The Philippine economy slowed down to 6.1% y/y in Q3, down from<br />
a revised 6.2% in Q2. Trade, construction and manufacturing were<br />
the main drivers of growth for the quarter, while consumer spending<br />
slowed. To meet the government’s growth target of 6.5% to 6.9% the<br />
country needs to expand by at least 7% in Q4.<br />
Taiwan<br />
Taiwan’s economy grew 2.28% y/y in Q3, down from 3.29% in Q2 and<br />
short of the government’s forecast of 2.36%. The slowed growth is<br />
attributed to weaker than expected private consumption, which fell<br />
short of forecasts. Still, merchandise and service exports rose, as well<br />
as government and private sector investments.<br />
Thailand<br />
Thailand’s economy slowed to 3.3% y/y in Q3, down from 4.6% in the<br />
previous quarter and below market expectations. Growth in exports<br />
decelerated and the tourism sector was notably impacted by a decline<br />
in visitors from China after a tour boat capsized ending in 50 fatalities.<br />
The Thai Government expects the economy will grow 4.2% in 2018 and<br />
between 3.5% and 4.5% in 2019.<br />
Singapore<br />
Singapore’s economy slowed significantly to 2.2% y/y in Q3, down<br />
from 3.9% in Q2. Growth was supported by the finance and insurance,<br />
manufacturing and business services sectors. Still, manufacturing — a<br />
key contributor to GDP growth in 2017 — grew only 3.5% in Q3, down<br />
from 10.7% in the previous quarter.<br />
South Korea<br />
The South Korean economy decelerated to 2% y/y in Q3, down from the<br />
2.8% growth in the previous quarter and marking the weakest growth<br />
rate since Q3 of 2009. Construction lowered 8.1% in Q3, as well as a<br />
contraction in gross fixed capital formation, contributing to the lower<br />
growth rate.<br />
* China's researching area includes Mainland China, Hong Kong, Macau & Taiwan.<br />
4 | ASIAN SKY QUARTERLY — FOURTH QUARTER 2018
FOURTH QUARTER 2018 — ASIAN SKY QUARTERLY | 5
ECONOMICS<br />
BUSINESS JET & HELICOPTER FLEET AND GDP BY COUNTRY<br />
Australia<br />
China<br />
Hong Kong<br />
India<br />
Indonesia<br />
Japan<br />
Malaysia<br />
New Zealand<br />
Papua New<br />
Guinea<br />
Philippines<br />
Singapore<br />
South Korea<br />
Taiwan<br />
Thailand<br />
GDP (BILLION USD)*<br />
BUSINESS JET FLEET<br />
CIVIL TURBINE HELICOPTER FLEET<br />
348<br />
873<br />
9,491<br />
12,544<br />
749<br />
674<br />
651<br />
4,909<br />
5,019<br />
608<br />
250<br />
2,439<br />
520<br />
1,862<br />
1,564<br />
1,306<br />
913<br />
1,484<br />
1,246<br />
980<br />
170<br />
140<br />
186<br />
153<br />
138<br />
382<br />
511<br />
420<br />
323<br />
300<br />
276<br />
272<br />
191<br />
566<br />
421<br />
339<br />
324<br />
322<br />
194<br />
114<br />
55<br />
48<br />
43<br />
39<br />
32<br />
20<br />
60<br />
55<br />
52<br />
51<br />
48<br />
37<br />
26<br />
21<br />
20<br />
274<br />
272<br />
210<br />
170<br />
136<br />
135<br />
128<br />
95<br />
288<br />
225<br />
214<br />
176<br />
158<br />
118<br />
107<br />
15<br />
20<br />
16<br />
9<br />
3<br />
6<br />
36<br />
14<br />
1<br />
22<br />
17<br />
6<br />
2013 2014 2015 2016 2017 2018Q3 2013 2014 2015 2016 2017 2018 2013 2014 2015 2016 2017 2018<br />
* Data Source: ASG & JETNET, the annual fleet size is adjusted using Jetnet fleet yearly increases, subject to change.<br />
* GDP Source: Tradingeconomics.com<br />
YEAR <strong>EN</strong>D 2018<br />
Asia Pacific Business Jet and Civil Helicopter Fleet Report<br />
Comprehensive coverage and overview of the business jet and civil helicopter<br />
fleet in the Asia-Pacific region, visit www.asianskymedia.com for more!<br />
COMING SOON<br />
6 | ASIAN SKY QUARTERLY — FOURTH QUARTER 2018
UNDERSTAND THE DYNAMICS OF BUSINESS AND G<strong>EN</strong>ERAL<br />
AVIATION IN SELECT ASIA PACIFIC COUNTRIES.<br />
FEATURING COUNTRY SPECIFIC INFORMATION ON CIVIL<br />
HELICOPTER AND BUSINESS JET FLEETS, AS WELL AS<br />
DATA ON INFRASTRUCTURE AND TRAINING SCHOOLS.<br />
PAID ACCESS<br />
AVAILABLE ON<br />
ASIAN SKY MEDIA<br />
COMING SOON<br />
Source: JETNET & ASG<br />
www.asianskymedia.com<br />
FOURTH QUARTER 2018 — ASIAN SKY QUARTERLY | 7
MOOD & INT<strong>EN</strong>TIONS:<br />
ASIA-PACIFIC REGION SURVEY 2018Q4<br />
RESPOND<strong>EN</strong>T LOCATION<br />
41+29+14+9+7+G<br />
Rest of the World (7%)<br />
Oceania (9%)<br />
Central Asia<br />
(14%)<br />
310 +<br />
RESPOND<strong>EN</strong>TS<br />
Greater China (41%)<br />
SE & NE Asia (29%)<br />
RESPOND<strong>EN</strong>T AIRCRAFT TYPE<br />
59+23+18+G<br />
Turboprop (18%) Business Jet (59%)<br />
Civil Helicopter<br />
(23%)<br />
RESPOND<strong>EN</strong>T CATEGORY<br />
Owner /<br />
Charter User (6%)<br />
Broker (13%)<br />
Others**<br />
(18%)<br />
Aircraft Operator<br />
/Management<br />
Company (25%)<br />
38+25+18+13+6+G<br />
Aircraft Service<br />
Providers* (38%)<br />
In the fourth quarter of 2018, over 310 respondents participated<br />
in ASG’s survey regarding the mood and intentions of the current<br />
business aviation market.<br />
ECONOMY MOOD<br />
Tension between the US and China regarding the trade conflict has Singapore (9%)<br />
resulted in the Asia-Pacific region’s — particularly Greater China’s —<br />
* Aircraft Serice Providers include: financial services, training, FBO, ground handlers, MRO, parts, etc.<br />
** Others include Law Firms, research facilities and government officials.<br />
TOP 10 RESPOND<strong>EN</strong>T’S LOCATIONS<br />
Taiwan (3%)<br />
Indonesia (5%)<br />
United States (6%)<br />
Philippines (9%)<br />
86 %<br />
OF TOTAL<br />
RESPOND<strong>EN</strong>TS<br />
respondents to maintain their economic pessimism in 2018 Q4.<br />
29+17+10+9+9+9+6+5+3+3+G<br />
South Korea (3%)<br />
Mainland China (29%)<br />
Hong Kong (17%)<br />
Australia (9%)<br />
India (10%)<br />
WHAT IS OUR CURR<strong>EN</strong>T ECONOMIC STATUS?<br />
(QUARTERLY COMPARISON)<br />
Optimistic<br />
(Will get better)<br />
25%<br />
30%<br />
Past Low Point<br />
22%<br />
At Low Point<br />
30%<br />
24%<br />
30%<br />
26%<br />
27%<br />
36%<br />
38%<br />
45%<br />
52%<br />
56%<br />
52%<br />
55%<br />
41%<br />
38%<br />
100%<br />
90%<br />
80%<br />
70%<br />
60%<br />
Pessimistic<br />
(Will get worse)<br />
45%<br />
Not Reached Low Point<br />
48%<br />
46%<br />
47%<br />
30%<br />
34%<br />
35%<br />
27%<br />
34%<br />
21%<br />
32%<br />
15%<br />
34%<br />
10%<br />
37%<br />
11%<br />
28%<br />
16%<br />
27%<br />
32%<br />
29%<br />
33%<br />
50%<br />
40%<br />
30%<br />
20%<br />
10%<br />
0%<br />
2015<br />
Q4<br />
2016<br />
Q1<br />
2016<br />
Q2<br />
2016<br />
Q3<br />
2016<br />
Q4<br />
2017<br />
Q1<br />
2017<br />
Q2<br />
2017<br />
Q3<br />
2017<br />
Q4<br />
2018<br />
Q1<br />
2018<br />
Q2<br />
2018<br />
Q3<br />
2018<br />
Q4<br />
Respondents Regional Breakdown:<br />
1. Greater China (129 valid respondents, including Mainland China, Taiwan & Hong Kong)<br />
2. Southeast and Northeast Asia (91 valid respondents, including Malaysia, Indonesia,<br />
Singapore, Brunei, Philippines, Thailand, Myanmar, Cambodia, Laos, Vietnam, Japan, and<br />
South Korea)<br />
3. Central Asia (45 valid respondents, including India, Pakistan, UAE, etc.)<br />
4. Oceania (28 valid respondents, including Australia and New Zealand)<br />
63% of the respondents from this quarter’s survey are from aircraft operators and aircraft<br />
services providers (FBO, MRO, etc.), as well as from aircraft brokers (13%), aircraft end<br />
users (6%) and other related areas.<br />
8 | ASIAN SKY QUARTERLY — FOURTH QUARTER 2018
MOOD & INT<strong>EN</strong>TIONS: ASIA-PACIFIC REGION SURVEY 2018Q4<br />
OPTIMISM LEVELS SINCE 2015Q4 - REGIONAL DIFFER<strong>EN</strong>CES<br />
Greater China SE & NE Asia Central Asia Oceania<br />
Overall<br />
100%<br />
90%<br />
80%<br />
70%<br />
60%<br />
50%<br />
40%<br />
57%<br />
55%<br />
60%<br />
53%<br />
56%<br />
52%<br />
51%<br />
37%<br />
54%<br />
52%<br />
80%<br />
57%<br />
54%<br />
53%<br />
43%<br />
83%<br />
69%<br />
66%<br />
54%<br />
61%<br />
84%<br />
79%<br />
73%<br />
62%<br />
91%<br />
81%<br />
79%<br />
70%<br />
68%<br />
95%<br />
86%<br />
85%<br />
79%<br />
100%<br />
92%<br />
91%<br />
90%<br />
92%<br />
94%<br />
87% 88%<br />
78%<br />
89%<br />
89%<br />
84%<br />
75%<br />
92%<br />
76%<br />
88%<br />
88%<br />
83%<br />
68%<br />
41%<br />
95%<br />
86%<br />
80%<br />
67%<br />
48%<br />
30%<br />
2015<br />
Q4<br />
2016<br />
Q1<br />
2016<br />
Q2<br />
2016<br />
Q3<br />
2016<br />
Q4<br />
2017<br />
Q1<br />
2017<br />
Q2<br />
2017<br />
Q3<br />
2017<br />
Q4<br />
2018<br />
Q1<br />
2018<br />
Q2<br />
2018<br />
Q3<br />
2018<br />
Q4<br />
During the fourth quarter of 2018, the US pushed ahead with tariffs on<br />
imports from China. Though there are signs of relief between the two<br />
largest economies and subsequent trade talks, there are now increased<br />
concerns over China’s economic outlook in 2019.<br />
In Q4, 38% of respondents believed that the economy passed its low<br />
point and will improve; 18% lower than 2017 Q4, which marked the<br />
highest point of optimism with 56% of respondents. Optimism has<br />
gradually declined since then. The number of respondents who believe<br />
the current economy is at its low point and will get better is 29%; 2%<br />
higher than the previous quarter. 33% of respondents believed that the<br />
economy hasn’t reached its low point and will continue to worsen; the<br />
highest level of pessimism since 2017 Q1.<br />
The optimism level for Greater China (Mainland, Hong Kong, Macau and<br />
Taiwan) is the main contributor to the overall low optimistic levels for Q4,<br />
as concerns over the future economy continue to increase.<br />
In general, respondents who believed that the current economic<br />
situation has passed its low point or is at its low point can be described<br />
as optimistic. This quarter, 67% of respondents believed that our<br />
economy will improve in the future; a decreasing trend since 2017 Q4<br />
and the lowest point since 2016 Q1.<br />
HOW IS YOUR AIRCRAFT UTILIZATION COMPARED TO 12 MONTHS AGO?<br />
100%<br />
90%<br />
Up by 20% and more (>20%)<br />
21%<br />
80%<br />
70%<br />
Up but less than 20% (0 - 20%)<br />
Increased<br />
60%<br />
The same (0%)<br />
28%<br />
50%<br />
40%<br />
20%<br />
Unchanged<br />
30%<br />
20%<br />
10%<br />
0%<br />
2016<br />
Q3<br />
Down but less than 20% (-20 - 0%)<br />
Down by 20% or more (
MOOD & INT<strong>EN</strong>TIONS: ASIA-PACIFIC REGION SURVEY 2018Q4<br />
GREATER CHINA<br />
OPTIMISTIC<br />
47 19 34 34 28 38 29 24 47 18 31 51 22 23 55 21 19 60 18 22 60 21 33 48 23 22 55 242433<br />
PESSIMISTIC<br />
47%<br />
19%<br />
34%<br />
2016<br />
Q3<br />
46 32 22 38 31 31 31 44 25 23 33 45 25 17 58 21 38 41 30 18 52 47 18 35 26 19 56 302545<br />
PESSIMISTIC<br />
34%<br />
28%<br />
38%<br />
OCEANIA<br />
OPTIMISTIC<br />
46%<br />
32%<br />
22%<br />
2016<br />
Q3<br />
2016<br />
Q4<br />
38%<br />
31%<br />
31%<br />
2016<br />
Q4<br />
Decreased The Same Increased Signal Line*<br />
29%<br />
24%<br />
47%<br />
2017<br />
Q1<br />
18%<br />
31%<br />
51%<br />
22%<br />
23%<br />
55%<br />
21%<br />
19%<br />
60%<br />
18%<br />
22%<br />
Decreased The Same Increased Signal Line*<br />
31%<br />
44%<br />
25%<br />
2017<br />
Q1<br />
2017<br />
Q2<br />
SOUTHEAST AND NORTHEAST ASIA<br />
23%<br />
33%<br />
45%<br />
2017<br />
Q2<br />
2017<br />
Q3<br />
25%<br />
27%<br />
58%<br />
2017<br />
Q3<br />
2017<br />
Q4<br />
21%<br />
38%<br />
41%<br />
2017<br />
Q4<br />
60%<br />
2018<br />
Q1<br />
30%<br />
18%<br />
52%<br />
2018<br />
Q1<br />
21%<br />
47%<br />
33%<br />
18%<br />
46%<br />
2018<br />
Q2<br />
35%<br />
2018<br />
Q2<br />
23%<br />
22%<br />
26%<br />
19%<br />
55%<br />
2018<br />
Q3<br />
56%<br />
2018<br />
Q3<br />
43%<br />
24%<br />
30%<br />
25%<br />
33%<br />
2018<br />
Q4<br />
45%<br />
2018<br />
Q4<br />
AIRCRAFT UTILIZATION:<br />
REGIONAL DIFFER<strong>EN</strong>CES<br />
In Q4, 31% of respondents in the surveyed<br />
area said their expected aircraft utilization<br />
had decreased, which has risen for three<br />
consecutive quarters. 49% of respondents said<br />
their aircraft utilization has increased, which is<br />
an 11% decline compared with last quarter.<br />
* An Optimistic-Pessimistic Signal Line has<br />
been added to regional aircraft usage trend<br />
analyses for Greater China, Oceania and South<br />
and East Asia regions. An optimistic mood is<br />
derived from more people indicating ‘higher’<br />
aircraft utilization compared with 12 months<br />
ago, while a pessimistic mood is derived from<br />
more people indicating ‘lower’ aircraft utilization<br />
compared with 12 months ago.<br />
Greater China<br />
33% of respondents indicated their aircraft<br />
utilization in 2018 Q4 increased, which is the<br />
lowest level recorded. 43% of respondents<br />
stated their aircraft utilization has decreased<br />
compared with 12 months ago, which is a<br />
similar level compared with previous quarters’<br />
result. Based on survey results for Q4, an<br />
assumption can be made that the ongoing<br />
US-China trade conflict has affected the aircraft<br />
utilization of Greater China.<br />
Oceania<br />
45% of respondents have indicated their aircraft<br />
utilization increased, a 10% decline from 2018<br />
Q3. 30% of respondents indicated their aircraft<br />
utilization decreased, 4% higher than the<br />
previous quarter. Higher aircraft utilization may<br />
be reflective of respondent’s higher economic<br />
optimism.<br />
Southeast and Northeast Asia<br />
OPTIMISTIC<br />
PESSIMISTIC<br />
37 27 33 26 22 27 17 10 14 25<br />
28 35 36 37 48 19 18 56 13 65 14 59 22 61 20 70 22 64 1856<br />
37%<br />
28%<br />
35%<br />
27%<br />
36%<br />
37%<br />
Decreased The Same Increased Signal Line*<br />
33%<br />
48%<br />
19%<br />
26%<br />
18%<br />
56%<br />
26%<br />
13%<br />
65%<br />
27%<br />
14%<br />
59%<br />
17%<br />
22%<br />
61%<br />
10%<br />
20%<br />
70%<br />
14%<br />
22%<br />
64%<br />
25%<br />
18%<br />
56%<br />
In 2018 Q4, 56% of respondents recorded<br />
increased aircraft utilization, which is 8% lower<br />
compared with 2018 Q3. 25% of respondents<br />
believe that their aircraft utilization decreased,<br />
which is 11% higher compared with the previous<br />
quarter and continued increase since 2018 Q2.<br />
2016<br />
Q3<br />
2016<br />
Q4<br />
2017<br />
Q1<br />
2017<br />
Q2<br />
2017<br />
Q3<br />
2017<br />
Q4<br />
2018<br />
Q1<br />
2018<br />
Q2<br />
2018<br />
Q3<br />
2018<br />
Q4<br />
10 | ASIAN SKY QUARTERLY — FOURTH QUARTER 2018
MOOD & INT<strong>EN</strong>TIONS: ASIA-PACIFIC REGION SURVEY 2018Q4<br />
SATISFACTION KEY FACTORS:<br />
CHARTER OPERATOR VS. CHARTER BROKER<br />
(OUTER IS BETTER)<br />
Operational<br />
Safety<br />
Charter<br />
Operator<br />
Customer Service<br />
Charter<br />
Broker<br />
Most Satisfied<br />
Operational<br />
Efficiency<br />
Just Own (39%)<br />
DO YOU OR YOUR CLI<strong>EN</strong>T OWN OR<br />
CHARTER A PRIVATE AIRCRAFT?<br />
49+39+12+G<br />
Just Charter (12%) Both Own and Charter (49%)<br />
Quality of<br />
Maintenance<br />
Quality of<br />
On-board Service<br />
In Q4’s market survey, ASG recorded over 60 rankings from the Asia-<br />
Pacific region regarding the satisfaction factors of management<br />
companies and those of charter brokers. Over 200 respondents answered<br />
questions regarding end users’ travel behaviours.<br />
Similarly, compared to previous quarters, when asking “Do you or your<br />
client own or charter a private aircraft?”, 12% of respondents only charter<br />
an aircraft, while 39% just own a private aircraft. The remaining 49% would<br />
both own and charter an aircraft, implying that to charter an aircraft is<br />
reasonable for those who already own one.<br />
Value for<br />
Money (Price)<br />
WH<strong>EN</strong> CHARTERING AN AIRCRAFT,<br />
WHAT IS YOUR PRIMARY SOURCE?<br />
20+80+G<br />
Contact Operator (80%) Contact Broker (20%)<br />
On the charter operator / broker side, when asking the primary choice<br />
when chartering an aircraft, 80% of respondents would contact a charter<br />
operator first.<br />
PURCHASE INT<strong>EN</strong>TION<br />
Regarding the current pre-owned market, 38% of respondents believed<br />
that the current market is still in a ‘Buyer’s Market’ with low demand<br />
and high supply.<br />
Buyer’s Market<br />
WHERE ARE WE IN THE CURR<strong>EN</strong>T<br />
PRE-OWNED MARKET?<br />
Balanced Market<br />
Seller’s Market<br />
I’m not sure<br />
Over the past five quarters of surveys, there has been an increasing trend<br />
of respondents believing that the market is moving away from a ‘Buyer’s<br />
Market’. 26% (38% last quarter) of respondents believed that we are now<br />
in a balanced market with equal demand and supply; a 12% decrease<br />
compared with last quarter. The remaining 26% believed that we have<br />
moved into a ‘Seller’s Market’, with higher demand on the market.<br />
49%<br />
39%<br />
36%<br />
40%<br />
29%<br />
47%<br />
43%<br />
38%<br />
38%<br />
Based on the Market Dynamic analysis from ASG’s research department,<br />
ASG now believes the pre-owned business jet market has entered a<br />
balanced market. Notably, the pre-owned market for the large and longrange<br />
business jet markets have improved. For details, please go to the<br />
Market Dynamics, and Market Summary section of this issue of ASQ.<br />
Regarding the purchase intentions of 2018 Q4, ASG noticed that the<br />
demand for both new aircraft and pre-owned aircraft together represent<br />
59% of the respondents who now have the intention of buying an aircraft.<br />
26%<br />
23%<br />
2%<br />
2017<br />
Q3<br />
21%<br />
4%<br />
2017<br />
Q4<br />
21%<br />
10%<br />
2018<br />
Q1<br />
28%<br />
17%<br />
8%<br />
2018<br />
Q2<br />
14%<br />
5%<br />
2018<br />
Q3<br />
26%<br />
26%<br />
10%<br />
2018<br />
Q4<br />
FOURTH QUARTER 2018 — ASIAN SKY QUARTERLY | 11
MOOD & INT<strong>EN</strong>TIONS: ASIA-PACIFIC REGION SURVEY 2018Q4<br />
* Since 2017 Q3’s market survey, a new method was applied filtering<br />
out those respondents who are not relevant to this question, hence<br />
reflecting a percentage drop in the category “No / I’m not sure”.<br />
PURCHASE INT<strong>EN</strong>TION 2016Q4 - 2018Q4*<br />
Yes, a new aircraft Yes, a pre-owned aircraft No / I’m not sure<br />
Purchase intention by region is shown in a graph to understand regional<br />
differences for fixed-wing aircraft. Greater China has a significantly<br />
higher need for large jets, while turboprops and small jets are more<br />
suitable for Oceania. Corporate airliners are commonly needed (13-<br />
30%) all areas except Oceania. Additionally, the medium and small jet<br />
categories are wanted, but on a relatively lower level.<br />
PURCHASE INT<strong>EN</strong>TION - REGIONAL<br />
DIFFER<strong>EN</strong>CES (FIXED WING)<br />
55%<br />
25%<br />
19%<br />
59%<br />
54%<br />
23% 22%<br />
23%<br />
19%<br />
41% 41%<br />
40%<br />
38%<br />
33% 33%<br />
31% 31%<br />
30%<br />
29% 28%<br />
27%<br />
38%<br />
32%<br />
31%<br />
41%<br />
30%<br />
29%<br />
2016<br />
Q4<br />
2017<br />
Q1<br />
2017<br />
Q2<br />
2017<br />
Q3<br />
2017<br />
Q4<br />
2018<br />
Q1<br />
2018<br />
Q2<br />
2018<br />
Q3<br />
2018<br />
Q4<br />
Turboprop /<br />
Piston Fixed Wing<br />
15%<br />
12%<br />
21%<br />
50%<br />
7%<br />
10%<br />
29%<br />
13%<br />
13%<br />
38%<br />
PURCHASE INT<strong>EN</strong>TION - FIXED WING<br />
(OUTER IS PREFERRED)<br />
Corporate Airliner<br />
(Such as ACJ, BBJ)<br />
Most Preferred<br />
Small Jet<br />
Medium Jet<br />
Large Jet<br />
Corporate Airliner<br />
21%<br />
30%<br />
50%<br />
37%<br />
25%<br />
Turboprop/Piston<br />
Fixed Wing<br />
(Such as King Air Series)<br />
Large Jet<br />
(Such as G650,<br />
Falcon 8X)<br />
17%<br />
13%<br />
Small Jet<br />
(Such as Citation Series, Hawker Series)<br />
Midsize Jet<br />
(Such as G200 & CL650)<br />
SE & NE Asia<br />
Oceania<br />
Greater China Central Asia<br />
PURCHASE DECISIONS - INFLU<strong>EN</strong>CING FACTORS<br />
(OUTER IS LIMITING)<br />
Greater China Oceania Central Asia SE & NE Asia<br />
Government / Public Opinion<br />
PURCHASE INT<strong>EN</strong>TION - HELICOPTER<br />
(OUTER IS PREFERRED)<br />
Twin Turbine<br />
(Such as Sikorsky S-76C++)<br />
Most Limiting<br />
Most Preferred<br />
No Need<br />
No Interesting Aircraft<br />
Piston Helicopter<br />
(Such as Robinson R22)<br />
Single Turbine Helicopter<br />
(Such as Bell 206)<br />
Price<br />
12 | ASIAN SKY QUARTERLY — FOURTH QUARTER 2018
TRAINING REPORT AD. TBD
COUNTRY PROFILE<br />
NEW ZEALAND<br />
AUCKLAND<br />
1 6<br />
7<br />
8<br />
9<br />
10<br />
19 22 26<br />
HAMILTON<br />
12<br />
13 17<br />
14<br />
TE KUITI<br />
NAPIER<br />
2<br />
15<br />
21<br />
20<br />
WELLINGTON INT'L<br />
4<br />
16<br />
CHRISTCHURCH INT'L<br />
3<br />
18 24<br />
QUE<strong>EN</strong>STOWN INT'L<br />
5<br />
25<br />
DUNEDIN<br />
11<br />
23<br />
Airport FBO MRO Training School<br />
1<br />
2<br />
3<br />
4<br />
5<br />
6<br />
7<br />
8<br />
9<br />
Air Centre One<br />
Air Napier<br />
Capital Jet Services<br />
ExecuJet / Capital Jet Services<br />
Queenstown Corporate Jet Svc.<br />
Air New Zealand<br />
Airbus Helicopters<br />
Airwork Group<br />
Flightline Aviation<br />
10 Oceania Aviation<br />
19<br />
11 Flightline Aviation<br />
20<br />
12 Hamilton Aero<br />
21<br />
13 Hamilton Aero<br />
22<br />
14 Southair Limited<br />
23<br />
15 Helicopters (NZ)<br />
24<br />
16 ExecuJet<br />
25<br />
17 CTC Aviation Training (NZ) 26<br />
18 Canterbury Aero Club<br />
Ardmore Flying School<br />
Nelson Aviation College<br />
Massey University School of Aviation<br />
HNZ New Zealand<br />
Helicopters Otago<br />
Garden City Helicopters<br />
Wanaka Helicopters<br />
North Shore Helicopters<br />
14 | ASIAN SKY QUARTERLY — FOURTH QUARTER 2018
COUNTRY PROFILE: NEW ZEALAND<br />
NEW ZEALAND<br />
by Litalia Yoakum<br />
New Zealand, made up of two main islands — North Island and South<br />
Island, is regularly recognized for its natural beauty. This small islandcountry<br />
is diverse and relatively untouched, with mountainous terrain,<br />
stunning beaches and active volcanoes. And, while its landscape is<br />
possibly the most often noted in reference to the country, New Zealand<br />
has much more to offer.<br />
Reliant on trade — with its neighbour Australia, along with the US, China,<br />
South Korea, Japan, Canada and the European Union — means New<br />
Zealand is one of the most globalized countries, with agriculture and<br />
manufacturing playing significant roles in the country’s economy. The<br />
growing tourism segment is also an increasing contributor to New<br />
Zealand’s GDP.<br />
Supporting the country’s economy and its population — most of which<br />
is situated on the North Island, has been its growing aviation industry. It<br />
has evolved from being used during World War I, as part of the air force,<br />
to being used for airmail, connectivity between islands, emergency use,<br />
tourism and civil flying. Today, helicopters in New Zealand have proven<br />
to be valuable, as they’re employed for a wide-range of uses and allow<br />
for accessibility to the more remote areas of the country.<br />
Helicopter Fleet — Mission Breakdown<br />
EMS 17 (3%)<br />
Private 18 (4%)<br />
SAR 20 (4%)<br />
Corporate 37 (7%)<br />
Charter 55 (11%)<br />
68+11+7+4+4+3+2+1+G<br />
TOTAL FLEET<br />
500<br />
Data Source: Asian Sky Group Fleet Report (Year-End 2018)<br />
Offshore 8 (2%)<br />
Training 3 (1%)<br />
Multi-Mission 342 (68%)<br />
Civil Helicopter Fleet by Mission and OEM<br />
100+71+65+65+57+52+48+43+43+33<br />
21<br />
15<br />
14 14<br />
12<br />
11<br />
10 9 9<br />
7<br />
The<br />
HelicopterLine<br />
Fox Franz<br />
Heliservices<br />
HeliOtago<br />
Advanced Flight<br />
Airwork<br />
GCH Aviation<br />
HNZ<br />
Heli Resources<br />
Search & Rescue<br />
Services<br />
Alpine Helicopters<br />
Total<br />
Airbus<br />
Bell<br />
MD<br />
Leonardo<br />
AS355 5 5<br />
BK117 6 1 5 5 17<br />
H120 1 1<br />
H125 21 7 1 4 3 6 1 3 5 51<br />
H130 7 2 9<br />
H135 1 1<br />
H145 1 1 2<br />
Bell 205 4 4<br />
Bell 206 7 4 11<br />
Bell 222 1 1<br />
Bell 429 4 4<br />
MD 500 7 1 2 10<br />
MD 520 1 1<br />
AW109 1 1 2<br />
AW139 3 3<br />
Total 21 15 14 14 12 11 10 9 9 7 122<br />
FOURTH QUARTER 2018 — ASIAN SKY QUARTERLY | 15
COUNTRY PROFILE: NEW ZEALAND<br />
CIVIL (TURBINE) HELICOPTER FLEET<br />
New Zealand’s civil helicopter market is the fourth largest in the Asia-<br />
Pacific region, behind the much larger markets of Australia, Japan and<br />
Mainland China, respectively. At yearend 2017, 478 civil helicopters<br />
(turbine) made up the country’s fleet, increasing to 500 by yearend 2018.<br />
Helicopters based in New Zealand are utilized for a variety of reasons,<br />
with the multi-mission segment being the largest. This broad category<br />
means helicopters can be operated for several different mission types,<br />
including tourism, cargo lifting, firefighting, aerial photography, aerial<br />
tours, agriculture and pest control, powerline repair and media, among<br />
others operational uses.<br />
Charter is the second largest mission segment in New Zealand;<br />
notable as it is more so than in other countries. One reason for the high<br />
utilization of helicopters for charter is the increased tourism activity in<br />
New Zealand, offering an opportunity for adventure and sightseeing<br />
Business Jet Fleet Distribution by Age<br />
>20 Years, 5 (31%)<br />
11-15 Years, 5 (31%)<br />
19+19+31+31+G<br />
TOTAL FLEET<br />
16<br />
Business Jet Fleet by OEM<br />
0-5 Years, 3 (19%)<br />
6-10 Years, 3 (19%)<br />
in remote countryside. Emergency medical services (EMS) is also a<br />
growing segment in New Zealand.<br />
0+0+72 0+0+24 0+0+160+0+8<br />
9<br />
3<br />
2<br />
1 1<br />
One reason for the<br />
high utilization of<br />
helicopters for charter<br />
is the increased tourism<br />
activity in New Zealand.<br />
Airbus Helicopters holds the largest market share of all manufacturers,<br />
with over 50% of the market share. Notably, the most popular model is<br />
the single-engine light utility helicopter, H125. MD Helicopters follows<br />
with just over 21% of the market, while Bell Helicopter holds just above<br />
20%.<br />
The largest operator in New Zealand is The Helicopter Line, which has<br />
21 turbine helicopters operating under its name. The second largest<br />
operator is Fox Franz Heliservices, with 15 turbine helicopters.<br />
TOURISM<br />
According to Stats NZ — Tourism Satellite Account, continued growth<br />
in overseas visitor numbers and a buoyant domestic tourism market,<br />
drove tourism spending to NZ$39.1 billion (approximately US$26.8<br />
billion) in the year ending in March 2018; an increase of 7.7% from the<br />
previous year. The growing industry now directly contributes to 6.1% of<br />
the country’s GDP and an additional, indirect contribution of 4.3%.<br />
CESSNA<br />
DASSAULT<br />
Bombardier 2 (13%)<br />
Cessna 9 (56%)<br />
Dassault 3 (19%)<br />
Gulfstream 1 (6%)<br />
Nextant 1 (6%)<br />
BOMBARDIER<br />
NEXTANT<br />
GULFSTREAM<br />
1+1 4+2+1+1+1 1+1+1 1 1<br />
Learjet 60XR<br />
Challenger 300<br />
Citation Mustang<br />
Citation II/SP<br />
Citation III<br />
Citation CJ3+<br />
Citation 500<br />
Falcon 2000LX<br />
Falcon 900EX EASy<br />
Falcon 7X<br />
Nextant 400XT/XTi<br />
1<br />
1<br />
1<br />
1<br />
1<br />
1<br />
1<br />
1<br />
G650 1<br />
2<br />
1<br />
4<br />
The increase in tourists and their financial contribution means the<br />
country is now seeking out ways to continue the growth.<br />
Data Source: Asian Sky Group Fleet Report (Year-End 2017)<br />
Tourists flocking to the country are eager to enjoy its natural wonders —<br />
Fiordland National Park, Bay of Islands, Lake Taupo, Tongariro National<br />
Park and the Franz Josef Glaciers, among others. Because of the varied<br />
topography, adventure and thrill seeking are common amongst visitors.<br />
And, the most efficient way to see and visit many of these remote<br />
locations is via helicopter, with most operators in New Zealand offering<br />
helicopter tourism and charter services.<br />
According to New Zealand’s Civil Aviation Authority (CAA), “While the<br />
boom in [visitor] numbers is undoubtedly good for business, it also has<br />
important ramifications for managing safety risks. More people means<br />
more flights, more hours worked by staff, busier airspace and landing<br />
sites, and more pressure to make the most of the busy season.”<br />
16 | ASIAN SKY QUARTERLY — FOURTH QUARTER 2018
OFFSHORE OIL & GAS<br />
While the downturn in O&G has adversely affected helicopter operators<br />
0+0+8<br />
across the globe,<br />
0+0+0<br />
operators in New Zealand are now facing another<br />
challenge. In early 2018, the New Zealand Government announced its<br />
decision to end further offshore O&G exploration; however, all existing<br />
permits for exploration will continue. The ban is part of the Government’s<br />
plan to transition to ‘clean energy’.<br />
From 2016 to 2018, helicopters used for O&G exploration have seen<br />
no growth. In 2016, there were 12 helicopters used in this mission<br />
segment and only eight by yearend 2017 and 2018. HNZ is the largest<br />
O&G operator in New Zealand. The company’s fleet has also declined<br />
in recent years, although they’re diversifying the fleet’s mission type; a<br />
common practice among O&G operators.<br />
HELICOPTER EMERG<strong>EN</strong>CY MEDICAL SERVICES (HEMS)<br />
According to New Zealand’s Ministry of Health, emergency air ambulance<br />
services are a vital component of the country’s emergency services. Both<br />
fixed-wing aircraft and helicopters are used for air ambulance service,<br />
which provide inter-hospital transfer (IHT) services, search and rescue<br />
(SAR) services and fire mission services.<br />
As demand for HEMS has increased over the past years, the sector has<br />
taken notice of the increasing aviation and clinical compliance regulations<br />
and the need to transition from the use of smaller, single-engine<br />
helicopters to larger twin-engine helicopters. Currently, New Zealand’s<br />
Civil Aviation requirements limit flying over urban areas (e.g. flying into<br />
hospital helipads) for single-engine helicopters. Also, with more space<br />
a twin-engine helicopter would have additional capacity for crew and<br />
medical equipment.<br />
HEMS providers in the Southern region — Helicopters Otago Limited<br />
and GCH Aviation Limited (Christchurch) — have come to a conclusion<br />
forming a new venture, Helicopter Emergency Medical Services New<br />
Zealand Limited. Several existing air ambulance ‘trusts’ will support this<br />
new Southern venture. In the Central region, five existing HEMS trusts<br />
formed a joint venture — Central Air Ambulance Rescue Limited — which<br />
will work to phase in additional twin-engine helicopters over the next<br />
year. In the Northern region, two existing trusts will also join forces — the<br />
Civil Helicopter Fleet Age Distribution Breakdown<br />
by Size Category<br />
35<br />
30<br />
25<br />
20<br />
15<br />
10<br />
5<br />
0<br />
1959<br />
1966<br />
1970<br />
1974<br />
Number of Hangars<br />
1982<br />
1986<br />
1990<br />
1994<br />
1998<br />
2002<br />
2006<br />
Light Twin<br />
Single<br />
Medium<br />
2010<br />
2014<br />
2018<br />
To overcome this issue the National Ambulance Sector Office (NASO),<br />
along with the Ministry of Health, the district health boards (DHBs) and<br />
the Accident Compensation Corporation, is in the process of modernizing<br />
HEMS in the country. NASO issued a Request for Proposal (RFP), calling<br />
for qualified suppliers to submit an RFP for the provision of New Zealand’s<br />
HEMS, with three successful respondents granted in each region —<br />
Northern, Central and Southern.<br />
New Zealand has long been served by 12 air ambulance providers, with<br />
varying operating models and cost structures. NASO’s intention when<br />
issuing the RFP was for a more integrated network, well-linked with other<br />
emergency services.<br />
5 5<br />
Business Jet Parking Civil Helicopter Parking<br />
Data Source: Asian Sky Group Infrastructure Report 2017<br />
Total number of hangars only includes FBO and MRO facilities in this report.<br />
FOURTH QUARTER 2018 — ASIAN SKY QUARTERLY | 17
COUNTRY PROFILE: NEW ZEALAND<br />
Auckland Rescue Helicopter Trust and Northland Emergency Services<br />
Trust will work together to serve this region, with an official name for the<br />
joint venture not yet announced.<br />
The Southern region’s Helicopter Emergency Medical Services New<br />
Zealand Limited is already in the process of transitioning to twin-engine<br />
helicopters. In the first half of 2019, two Airbus H145s will be delivered<br />
to the region.<br />
SAFETY<br />
A few fatal helicopter accidents in New Zealand, including one in late<br />
2018, have left the industry and the country questioning the safety of<br />
commercial helicopters.<br />
The CAA has responded to the questioning of safety stating: “The<br />
risk posed by the helicopter sector is that fatal and serious helicopter<br />
accidents, particularly in air transport operations, have the potential to<br />
damage New Zealand’s reputation for safe and secure skies, as well as<br />
incurring unnecessary social cost.”<br />
Promising to focus on the area of safety, the CAA aims to address the<br />
helicopter sector’s poor safety performance “…to ensure safety risks<br />
are managed effectively by aviation participants with strong leadership,<br />
co-ordination and oversight by the Authority, and that accident rates are<br />
lowered so they align with, or are better than, international comparisons.”<br />
The CAA has reallocated existing resources out of its oversight of airlines<br />
into the oversight of helicopter operations. CAA staff have engaged in<br />
a number of activities relating to the safety performance of the sector.<br />
These range from engagement with user groups, industry bodies and<br />
other Government agencies, training seminars, amendment of guidance<br />
material such as Advisory Circulars, and the prioritization of helicopterrelated<br />
issues.<br />
An important aspect of assisting the sector to manage risks is the<br />
introduction of Civil Aviation Rule Part 100 Safety Management. This<br />
requires operators to have an effective Safety Management System<br />
(SMS) in place to, amongst other elements, identify hazards and mitigate<br />
against identified risks.<br />
FUTURE OF ROTARY<br />
New Zealand’s rotary market is and will continue to be a crucial part of the<br />
country. The coming years will see various mission segments continue<br />
to evolve.<br />
The Government’s plan to transform the country’s EMS sector will bring<br />
an increase of twin-engine helicopters, as the Government transitions<br />
from single-engine helicopters in its 10-year overhaul of the country’s<br />
helicopter emergency services.<br />
The recent ban on further offshore O&G exploration will additionally<br />
impact the O&G sector, particularly HNZ. While these new regulations may<br />
not immediately impact the sector as current O&G contracts will continue<br />
to be recognized, the future may eventually see less O&G-configured<br />
helicopters and more utilized for alternative energy sources.<br />
As inbound tourism continues to rise to record levels, the industry will<br />
likely see an influx of operators catering to more tourists in search of more<br />
exciting trips. While this will continue to be good news for the country’s<br />
economy and the helicopter sector, the New Zealand CAA will be diligently<br />
working to maintain safety of operations.<br />
FBO’s Facilities and Services<br />
1<br />
Fuel Arrangement Service<br />
FBO Name<br />
Airport<br />
Aircraft<br />
Hangarage<br />
On-Site<br />
CIQ<br />
VIP<br />
Lounges<br />
Aircraft<br />
Handling<br />
Aircraft<br />
Refueling 1<br />
Air Centre One Auckland International Airport ● ● ● ● ●<br />
Air Napier Hawkes Bay Airport/Napier Airport ● ● ●<br />
Capital Jet Services Christchurch International Airport ● ● ● ●<br />
ExecuJet/Capital Jet Services Wellington International Airport ● ● ● ● ●<br />
Queenstown Corporate Jet Services Queenstown International Airport ● ● ● ● ●<br />
Data Source: Asian Sky Group Infrastructure Report 2017<br />
1 Under Construction; 2 CIQ: Customs, Immigration and Quarantine; 3 Aircraft Refueling: Fuel Arrangement Service<br />
18 | ASIAN SKY QUARTERLY — FOURTH QUARTER 2018
● ● ● ● ●<br />
● ● ● ● ● ●<br />
● ● ● ● ● ●<br />
● ● ● ● ● ● ● ●<br />
● ● ● ● ● ● ● ●<br />
● ● ●<br />
● ●<br />
● ●<br />
● ●<br />
● ●<br />
●<br />
● ● ●<br />
● ● ●<br />
● ●<br />
● ● ●<br />
●<br />
● ● ●<br />
● ●<br />
COUNTRY PROFILE: NEW ZEALAND<br />
MRO Capabilities by Model<br />
● Line Maintenance (Fixed-wing)/Field Maintenance (Helicopter)<br />
● Base Maintenance (Fixed-wing)/Overhaul (Helicopter)<br />
● Both<br />
AIRBUS<br />
Air New Zealand<br />
ExecuJet<br />
Hamilton Aero<br />
TEXTRON<br />
Flightline (AKL)<br />
Flightline (DUD)<br />
Southair<br />
AIRBUS<br />
Airbus NZ<br />
Airwork Group<br />
HNZ<br />
ACJ318<br />
King Air 90<br />
H120<br />
ACJ319<br />
King Air 200/250<br />
H125<br />
ACJ320<br />
King Air 300/350<br />
H130<br />
ACJ321<br />
Cessna 172<br />
H135<br />
BOEING<br />
Cessna 182<br />
H145<br />
BBJ<br />
Cessna 205<br />
H155<br />
BBJ2<br />
Cessna 206<br />
H215<br />
BBJ3<br />
Cessna 207<br />
H225<br />
GULFSTREAM<br />
Cessna 400<br />
AS355<br />
G100<br />
Caravan<br />
AS365<br />
G150<br />
Grand Caravan<br />
BK117<br />
G200<br />
Baron<br />
LEONARDO<br />
G280<br />
Bonanza<br />
AW109<br />
GIV/GIV-SP/G300/G400<br />
AW119<br />
GV<br />
AW139<br />
G350/G450<br />
AW169<br />
G500/G550<br />
G650/G650ER<br />
TEXTRON<br />
Citation I<br />
Citation II/Bravo<br />
MD<br />
Flightline (AKL)<br />
Helicare<br />
Helicraft<br />
Heliflite<br />
Helispecs<br />
Oceania Aviation<br />
Rotor & Wing<br />
Skysales Aviation<br />
Southair<br />
Citation III/VI/VII<br />
MD 500<br />
Citation V<br />
MD 600<br />
Citation XLS/+<br />
MD 900<br />
Citation X/+<br />
ROBINSON<br />
Citation CJ1/+<br />
R22<br />
Citation CJ2/+<br />
R44<br />
Citation Sovereign/+<br />
R66<br />
Citation Longitude<br />
Citation Mustang<br />
Hawker 400A/B<br />
Hawker 400XP<br />
Hawker 750<br />
Hawker 800 A/B/850XP<br />
Hawker 900XP<br />
Hawker 4000<br />
FOURTH QUARTER 2018 — ASIAN SKY QUARTERLY | 19
20 | ASIAN SKY QUARTERLY — FOURTH QUARTER 2018
FOURTH QUARTER 2018 — ASIAN SKY QUARTERLY | 21
SPECIAL FEATURE<br />
GLOBAL HELICOPTER MARKET<br />
OVERVIEW<br />
Over the past several years, ASG has recorded<br />
data on the civil helicopter fleet worldwide. The<br />
following is an analysis of new deliveries, as well as<br />
pre-owned aircraft. This analysis provides insight<br />
into the market, amid an oil and gas downturn and<br />
the recent reshaping of several major international<br />
operators and leasing companies.<br />
22 | ASIAN SKY QUARTERLY — FOURTH QUARTER 2018
SPECIAL FEATURE: GLOBAL HELICOPTER MARKET OVERVIEW<br />
OEM OVERVIEW<br />
OEM DELIVERIES<br />
The four major civil helicopter OEMs (Airbus Helicopters, Bell Helicopter,<br />
Leonardo and Sikorsky) manufacture a wide-range of turbine helicopters<br />
from light single-engine helicopters, such as the Bell 505, to heavy multiengine<br />
helicopters, such as the S92.<br />
Starting from 2010, ASG has witnessed a gradual decline in new<br />
deliveries from OEMs. During that same year, the four major OEMs had a<br />
combined new delivery number of 824 helicopters. In 2018, the total new<br />
deliveries were approximately 460; about a 44% reduction from 2010.<br />
OEM DELIVERIES 2010 - 2018<br />
506<br />
407<br />
386<br />
379<br />
2010 - 2018<br />
OEM MARKET SHARE<br />
During 2016 to 2018, Airbus and Leonardo held 88% of new deliveries<br />
in the medium and heavy helicopter segments. The H145 and AW139<br />
represent the highest number of deliveries during this time.<br />
OEM MARKET SHARE - MEDIUM & HEAVY SECTOR:<br />
TOTAL FLEET DELIVERIES DURING 2016 - 2018<br />
Bell 21 (5%)<br />
Sikorsky 42 (10%)<br />
Leonardo 195 (46%)39+46+10+5+G<br />
Airbus 163 (39%)<br />
210<br />
112<br />
135<br />
188<br />
187<br />
164<br />
164<br />
122<br />
114<br />
159<br />
168<br />
124<br />
122<br />
163<br />
136<br />
137<br />
322<br />
298<br />
286<br />
285<br />
90<br />
67<br />
87<br />
38<br />
36<br />
29<br />
54<br />
46<br />
31<br />
18<br />
6<br />
Data Source: Jetnet<br />
Airbus Bell Leonardo Sikorsky<br />
Data Source: Jetnet<br />
The most noticeable reduction was the decline in the medium and heavy<br />
sized multi-engine helicopter market segment. Notably, new delivery<br />
numbers for aircraft models such as the H145 (EC145), Bell 429, AW139<br />
and S76D are declining.<br />
However, during 2016 to 2018, deliveries of later helicopters, such as the<br />
Bell 505 and H125 saw an increase, causing total delivery numbers for<br />
the single-engine light category to increase. This reflects the market’s<br />
shifting interest in the lighter helicopter segment.<br />
AIRBUS HELICOPTERS<br />
The current production line for Airbus Helicopters includes the following:<br />
• Light Single-Engine Helicopters: H125 (AS350), H130, H135<br />
• Light Twin-Engine Helicopters: H135, H145 (EC145)<br />
• Medium Twin-Engine Helicopters: H155, H160, H175<br />
• Heavy Helicopters: H225<br />
The most delivered Airbus models for the past three years were singleengine<br />
turbine helicopters, including the H125 & H145. The H125 is<br />
a successful and popular light utility helicopter. New H125 deliveries<br />
have been high, although there have been no signs of this increasing.<br />
Although deliveries for the H145 have declined, this model is still<br />
recognized for its versatility among various mission segments.<br />
OEM DELIVERIES BY CATEGORY 2016 - 2018<br />
2016 - 2018<br />
257<br />
217 217<br />
AIRBUS HELICOPTERS - DELIVERY BREAKDOWN<br />
90<br />
110<br />
92<br />
2016 - 2018<br />
123<br />
109<br />
79<br />
137<br />
109<br />
96<br />
25<br />
26<br />
28<br />
55<br />
30<br />
17<br />
44<br />
34<br />
18<br />
28<br />
46<br />
37<br />
45<br />
44<br />
38<br />
4<br />
3<br />
1<br />
5<br />
11<br />
7<br />
2<br />
1<br />
0<br />
Single<br />
Turbine<br />
Light<br />
Multi-Engine<br />
Medium<br />
Multi-Engine<br />
Heavy and Super<br />
Medium*<br />
Single<br />
Turbine<br />
H125<br />
Single<br />
Turbine<br />
H130<br />
Light<br />
Multi<br />
EC-145<br />
Light<br />
Multi<br />
H135<br />
Med<br />
Multi<br />
H145<br />
Med<br />
Multi<br />
H155<br />
Heavy<br />
Multi<br />
H175<br />
Heavy<br />
Multi<br />
H225<br />
Data Source: Jetnet<br />
*Heavy multi-engine and super medium helicopter models include models such<br />
as AW189, H175 and H225.<br />
Data Source: Jetnet<br />
FOURTH QUARTER 2018 — ASIAN SKY QUARTERLY | 23
SPECIAL FEATURE: GLOBAL HELICOPTER MARKET OVERVIEW<br />
For O&G models, there were no deliveries in 2018. Airbus Helicopters’<br />
H160 will start replacing the H155 in the coming years, with expectations<br />
of an increasing market demand. In 2016, the H225 fleet was grounded<br />
after a fatal accident involving the model. This has heavily affected<br />
market confidence; the past three years saw only five H225 deliveries,<br />
including one delivered in early 2019 to a Mainland China operator used<br />
for passenger transportation / sightseeing. A large part of this market<br />
demand was filled by its lighter competitor: Leonardo AW139 & AW189,<br />
which are relatively smaller models, as well as its own H175 model,<br />
which had 23 deliveries as of yearend 2018.<br />
BELL HELICOPTER<br />
The current production line for Bell Helicopter includes the following:<br />
• Light Single-Engine Helicopters: Bell 505 Jet Ranger X, Bell 407GXP<br />
• Light Twin-Engine Helicopters: Bell 429 Global Ranger<br />
• Medium Twin-Engine Helicopters: Bell 412EP & 412EPI<br />
• Heavy Helicopters: Bell 525 Relentless – Under testing and delivery<br />
postponed<br />
LEONARDO<br />
The current production line for Leonardo includes the following:<br />
• Light Single Engine Helicopters: AW119Kx<br />
• Light Twin-Engine Helicopters: AW109 GrandNew<br />
• Medium Twin-Engine Helicopters: AW169 & AW139<br />
• Super Medium Helicopters: AW189<br />
LEONARDO - DELIVERY BREAKDOWN<br />
11 14 10<br />
Single<br />
Turbine<br />
AW119Kx<br />
10 8 7<br />
52<br />
Light<br />
Multi<br />
AW109<br />
21<br />
Med<br />
Multi<br />
38<br />
AW139<br />
15<br />
24<br />
Med<br />
Multi<br />
14<br />
AW169<br />
2016 - 2018<br />
6 7 18<br />
Super<br />
Medium<br />
AW189<br />
BELL HELICOPTER - DELIVERY BREAKDOWN<br />
102<br />
60<br />
2016 - 2018<br />
Data Source: Jetnet<br />
Leonardo's helicopter division focuses largely on medium and super<br />
medium sized helicopters. It is the only OEM that recorded an increase<br />
of new deliveries in these categories – AW189, which is one of the first<br />
certified “super medium sized” models, aimed at missions such as O&G<br />
and search and rescue (SAR). The AW189 is mainly used by large O&G<br />
operators and government services.<br />
0<br />
24<br />
Single<br />
Turbine<br />
505<br />
39<br />
35<br />
27 35 17<br />
Single<br />
Turbine<br />
407GX/GXP<br />
Light<br />
Multi<br />
429<br />
7 10 4<br />
Med<br />
Multi<br />
412EPI & EP<br />
AW139 is a medium sized twin-engine model aimed at the multi-mission<br />
market. It offers a larger cabin compared to its main competitors the<br />
S76D, Bell 412 and H155 and its engine has more power, allowing the<br />
aircraft to have a wider mission capabilities than other comparable<br />
models.<br />
Data Source: Jetnet<br />
Bell Helicopter is the only OEM that has seen an increase in new<br />
deliveries for the past three years; due, in great part, to the light singleengine<br />
Bell 505 model, which has delivered 126 aircraft in total and<br />
notably 102 in 2018. The cost-efficient 407GXP had 120 new deliveries<br />
over the past three years.<br />
Bell acquired a larger market share from its competitor’s light helicopter<br />
market segment – such as the Airbus H125 and Robinson R66, both<br />
capable of performing light utility missions. However, Bell suffered from<br />
a decline in new deliveries with the rest of its production line.<br />
The AW169 is smaller compared to the AW139, and has been widely<br />
accepted in the EMS segment to date.<br />
SIKORSKY<br />
Sikorsky currently produces two helicopter models:<br />
• Medium Twin-Engine: S76D<br />
• Heavy Helicopters: S92<br />
There have been 20 S-92 delivered for the past three years, many of<br />
which were to government operations. However, of these deliveries, only<br />
two were delivered in 2018.<br />
SIKORSKY - DELIVERY BREAKDOWN<br />
Of the medium and heavy models, there have only been 21 412EPI and<br />
EP deliveries (three 412EP and 18 412EPI) over the past three years. Bell<br />
postponed the delivery of the Bell 525 Relentless, in attempt to avoid the<br />
competition from the pre-owned market and other OEMs.<br />
14<br />
12<br />
2016 - 2018<br />
7<br />
1<br />
6<br />
2<br />
Med Multi<br />
S-76D<br />
Heavy Multi<br />
S-92A<br />
Data Source: Jetnet<br />
24 | ASIAN SKY QUARTERLY — FOURTH QUARTER 2018
PRE-OWNED MARKET ANALYSIS<br />
The pre-owned market inventory values have seen a constant increase<br />
since ASG began its market observation in late 2013. The most obvious<br />
contributing factor is the downturn of the oil and gas (O&G) industry,<br />
which began in 2013 and has subsequently impacted the utilization<br />
level of helicopter serving offshore oil and gas operations.<br />
From 2013 to mid-2017, ASG saw a high number of pre-owned helicopters<br />
(mainly O&G-configured helicopters) being place on the market for sale.<br />
On average, the inventory level (percentage of the helicopter fleet for sale<br />
vs. total fleet in operation) has risen from 3.9% in late 2013 to its highest<br />
point of 6.2% in late 2017, representing a market oversupply.<br />
To avoid recording a potential loss on the company’s book value, aircraft<br />
owners and leasing companies have been hesitant in lowering their official<br />
selling prices. Consequently, the pre-owned market’s inventory value has<br />
continued to remain high, while the transaction level remains low.<br />
PRE-OWNED MARKET VALUE & ASKING PRICE TR<strong>EN</strong>D<br />
Global Market Value<br />
Fleet Average Asking Price<br />
1,600 6<br />
1,400<br />
5<br />
MARKET VALUE<br />
(Million USD, Aircraft Asking Price x Total Aircraft for Sale)<br />
1,200<br />
1,000<br />
800 3<br />
600<br />
400<br />
200<br />
Market Oversupply<br />
Market<br />
Adjustment<br />
4<br />
2<br />
1<br />
AVERAGE ASKING PRICE (MILLION USD)<br />
0<br />
0<br />
Dec 13<br />
Feb 14<br />
Apr 14<br />
Jun 14<br />
Aug 14<br />
Oct 14<br />
Dec 14<br />
Feb 15<br />
Apr 15<br />
Jun 15<br />
Aug 15<br />
Oct 15<br />
Dec 15<br />
Feb 16<br />
Apr 16<br />
Jun 16<br />
Aug 16<br />
Oct 16<br />
Dec 16<br />
Feb 17<br />
Apr 17<br />
Jun 17<br />
Aug 17<br />
Oct 17<br />
Dec 17<br />
Feb 18<br />
Apr 18<br />
Jun 18<br />
Aug 18<br />
Oct 18<br />
Dec 18<br />
Data Source: ASG & Jetnet<br />
FOURTH QUARTER 2018 — ASIAN SKY QUARTERLY | 25
SPECIAL FEATURE: GLOBAL HELICOPTER MARKET OVERVIEW<br />
MARKET ADJUSTM<strong>EN</strong>T<br />
In late 2017, ASG witnessed the market selfadjust<br />
with average asking prices decreasing<br />
and inventory levels reducing. Thus, inventory<br />
values began to decrease and there was an<br />
increase in total transactions.<br />
PERC<strong>EN</strong>TAGE OF AIRCRAFT FOR SALE (% OF FLEET) 2016 - 2018<br />
7.0%<br />
6.5%<br />
6.0%<br />
5.5%<br />
5.0%<br />
4.5%<br />
4.0%<br />
3.5%<br />
3.0%<br />
Sep 16<br />
Oct 16<br />
Nov 16<br />
Dec 16<br />
Jan 17<br />
Feb 17<br />
Mar 17<br />
Apr 17<br />
May 17<br />
Jun 17<br />
Jul 17<br />
Aug 17<br />
Sep 17<br />
Oct 17<br />
Nov 17<br />
Dec 17<br />
Jan 18<br />
Feb 18<br />
Mar 18<br />
Apr 18<br />
May 18<br />
Jun 18<br />
Jul 18<br />
Aug 18<br />
Sep 18<br />
Oct 18<br />
Nov 18<br />
Dec 18<br />
There are multiple reasons contributing to the<br />
market trend reversal: the increasing helicopter<br />
demand from the O&G market; the reshaping<br />
of notable helicopter leasing companies, which<br />
has impacted market conditions; and operators<br />
diversifying their fleet, reconfiguring aircraft<br />
from O&G configured to operational for other<br />
mission types.<br />
PRE-OWNED HELICOPTER SOLD VS. TOTAL AIRCRAFT IN OPERATION % *<br />
0.50%<br />
0.45%<br />
0.40%<br />
0.35%<br />
0.30%<br />
0.25%<br />
0.20%<br />
0.15%<br />
0.10%<br />
0.05%<br />
0.00%<br />
Dec 13<br />
Feb 14<br />
Apr 14<br />
Jun 14<br />
Aug 14<br />
Oct 14<br />
Dec 14<br />
Feb 15<br />
Apr 15<br />
Jun 15<br />
TRANSACTION ANALYSIS<br />
AVERAGE DAYS ON MARKET OF THE FLEET FOR SALE<br />
Although the current helicopter market is<br />
still suffering from the previous market<br />
oversupply, reflecting still-high average days<br />
on market and a relatively low transaction<br />
level, there is an increased demand based on<br />
the current market transactions.<br />
700<br />
650<br />
600<br />
550<br />
500<br />
450<br />
400<br />
350<br />
300<br />
Transaction levels of pre-owned helicopters<br />
have seen a mild increasing trend starting<br />
from mid-2017. Meanwhile, the average<br />
age of the fleet sold is younger, down from<br />
20-30 years old in 2017 (with a relatively<br />
lower transaction level) to the current 10-20<br />
years old fleet being sold, along with a higher<br />
transaction level.<br />
TRANSACTION VS. AVERAGE SOLD FLEET AGE: 2016 - 2018<br />
9.0<br />
7.0 7.0<br />
13.0<br />
2 2 1 1<br />
20.0<br />
17.6<br />
11.3<br />
3<br />
7<br />
3<br />
35.0<br />
32.6<br />
18.8<br />
4 3<br />
18.5<br />
5 4<br />
37.8<br />
More Younger Fleet<br />
Transactions<br />
26.0<br />
22.4 22<br />
14.2 16.3 18.6 14.4 16.4 19.1<br />
13<br />
9<br />
10 11 12 11 14 17.1<br />
13<br />
15.4 14<br />
16.0 13.9<br />
12.5<br />
6<br />
7<br />
7 8<br />
10.7<br />
4<br />
3<br />
Sep 16<br />
Oct 16<br />
Nov 16<br />
Dec 16<br />
Jan 17<br />
Feb 17<br />
Mar 17<br />
Apr 17<br />
May 17<br />
Jun 17<br />
Jul 17<br />
Aug 17<br />
Sep 17<br />
Oct 17<br />
Nov 17<br />
Aug 15<br />
Oct 15<br />
Dec 15<br />
Feb 16<br />
Apr 16<br />
Jun 16<br />
Aug 16<br />
Oct 16<br />
Dec 16<br />
Aug 17<br />
Oct 17<br />
Dec 17<br />
Feb 17<br />
Apr 17<br />
Jun 17<br />
Feb 18<br />
Apr 18<br />
Jun 18<br />
Aug 18<br />
Oct 18<br />
Dec 18<br />
Dec 13<br />
Feb 14<br />
Apr 14<br />
Jun 14<br />
Aug 14<br />
Oct 14<br />
Dec 14<br />
Feb 15<br />
Apr 15<br />
Jun 15<br />
Aug 15<br />
Oct 15<br />
Dec 15<br />
Feb 16<br />
Apr 16<br />
Jun 16<br />
Aug 16<br />
Oct 16<br />
Dec 16<br />
Aug 17<br />
Oct 17<br />
Dec 17<br />
Feb 17<br />
Apr 17<br />
Jun 17<br />
Feb 18<br />
Apr 18<br />
Jun 18<br />
Aug 18<br />
Oct 18<br />
Dec 18<br />
Dec 17<br />
Jan 18<br />
Feb 18<br />
Mar 18<br />
Apr 18<br />
May 18<br />
Jun 18<br />
Jul 18<br />
Aug 18<br />
Sep 18<br />
Oct 18<br />
Nov 18<br />
Dec 18<br />
Fleet Transactions<br />
Average of Age<br />
Data Source: ASG and Jetnet.<br />
Note: The monitored pre-owned models include: S76C+/C++, S92, Bell 206, Bell 212, Bell 412, Bell 429,<br />
AW139, H225, H135, H145 & H155.<br />
26 | ASIAN SKY QUARTERLY — FOURTH QUARTER 2018
SPECIAL FEATURE: GLOBAL HELICOPTER MARKET OVERVIEW<br />
HELICOPTER DEMAND POSITIONING & FORECASTING<br />
The chart below demonstrates helicopter model market momentum during different period based on analyzed market data including the percentage<br />
of fleet for sale, aircraft transactions and average days on market. In 2018Q4, the market had more transactions, along with absorbtion of market<br />
inventory, compared to 2017Q4.<br />
CIVIL HELICOPTERS - MARKET POSITIONING BY MODEL<br />
HIGHER INV<strong>EN</strong>TORY VALUE<br />
More sellers than buyers / Fewer transactions<br />
Balanced<br />
Offer & Demand<br />
LOWER INV<strong>EN</strong>TORY VALUE<br />
More buyers than sellers / More transactions<br />
S76C+<br />
S76C++<br />
Market Score 2017Q4<br />
Market Score 2018Q4<br />
S92A<br />
BELL 412EP<br />
BELL 412HP<br />
BELL 429<br />
AW109E PWR<br />
AW109E GN<br />
AW139<br />
AS332L1<br />
H225<br />
EC135P2<br />
EC135T2<br />
EC145<br />
EC155B<br />
H155<br />
MARKET SUMMARY<br />
The pre-owned helicopter market has been suffering from a market oversupply. This situation did not begin to recover until the end of 2017, when<br />
the average asking price of the pre-owned market dropped and more transactions began to take place.<br />
The current situation of the pre-owned market is a result of the following:<br />
• Low demand for the OEM firsthand market;<br />
• The after effect of the 2013 O&G downturn;<br />
• The revived demand of O&G helicopters;<br />
• Helicopter sellers’ pricing strategy;<br />
• A shift in the current market demand – from medium/heavy helicopters to light helicopters.<br />
With less deliveries from OEMs in the future — particularly in the medium and heavy categories, the expectation is that the pre-owned market will<br />
stabilize with more inventory being consumed and a higher demand to meet.<br />
FOURTH QUARTER 2018 — ASIAN SKY QUARTERLY | 27
PRE-OWNED MARKET SPOTLIGHT<br />
LEONARDO AW139<br />
Entering service in 2003, the Leonardo AW139 is a medium twin-engine helicopter developed<br />
by Bell Agusta Aerospace; a now defunct joint venture between Bell Helicopter Textron and<br />
AgustaWestland. Originally named the AB139 to signify the venture, the helicopter was renamed<br />
in 2006 to the AW139 when Bell withdrew from the project in 2005 and AgustaWestland subsequently<br />
bought out Bell’s shares in the program.<br />
28 | ASIAN SKY QUARTERLY — FOURTH QUARTER 2018
PRE-OWNED SPOTLIGHT<br />
INTRODUCTION<br />
The AW139, powered by two Pratt & Whitney Canada PTC6-67C<br />
engines, is now known for having one of the largest passenger cabins<br />
in its class. It features a Honeywell Primus Epic fully integrated<br />
avionics system and a four-axis digital automatic flight control<br />
system with auto hover and full authority digital electronic engine<br />
control (FADEC), which enhances handling qualities. Its best-inclass<br />
power reserve and power-to-weight ratio provide Category A<br />
performance capabilities, allowing the aircraft to continue to fly safely<br />
in the event of engine failure.<br />
With the largest passenger cabin in its class and space for up to 15<br />
passengers and two pilots, the AW139 is suitable for a wide-range<br />
of operational uses. In a VIP/corporate capacity, the AW139 is an<br />
attractive aircraft for those looking for plenty of space, a smooth<br />
ride and quiet environment. In an EMS and SAR capacity, the AW139<br />
offers large internal volume with room for two to four stretchers and<br />
up to five seats. Its large sliding doors provide unobstructed access<br />
to a quick and easy reconfigurable, flat-floor cabin for loading and<br />
unloading of patients on the ground and during hoisting operations.<br />
For offshore operations, the AW139 offers a maximum take-off<br />
weight (MTOW) of 6,400 to 7,000kg (14,110 to 15,430lb). MTOW was<br />
increased to 7,000kg from 6,800kg in 2015; the additional weight<br />
capacity comes in the form of a retrofit, which enhances equipment<br />
and reduces weight. The increased gross weight (IGW) kit also<br />
increases flight radius of up to 165nm with 12 passengers. Typical<br />
offshore configuration includes emergency floats and rafts, cabin<br />
liners with sound proofing, crashworthy passenger seats and an<br />
adaptive anti-vibration system.<br />
In 2011, a military-configured variant was introduced to the market.<br />
The AW139M features mission ready equipment, including military<br />
communications, radar, electro-optic / infra-red (EO/IR) device,<br />
defensive aids, internal weapons, armour protection and other<br />
suitable equipment.<br />
AGE DISTRIBUTION BY AIRCRAFT DELIVERY YEAR<br />
120<br />
100<br />
80<br />
60<br />
FLEET DISTRIBUTION BY REGION*<br />
Northern Africa, 34 (4%)<br />
Eastern Europe, 47 (5%)<br />
Sub-Saharan Africa, 48<br />
(5%)<br />
Oceania, 52 (6%)<br />
Latin Amer. & Carib,<br />
79 (9%)<br />
Northern America,<br />
115 (13%)<br />
7.8<br />
92<br />
United States<br />
Italy<br />
22+21+15+13+8+6+5+5+4+1+G<br />
TOP 10 OPERATING COUNTRIES VS.<br />
AVERAGE FLEET AGE<br />
7.1<br />
78<br />
Japan<br />
United Arab Emirates<br />
Australia<br />
Brazil<br />
Qatar<br />
Mainland China<br />
Europe - Baltics, 3 (
PRE-OWNED SPOTLIGHT<br />
MODEL COMPARISON<br />
LEONARDO<br />
AW139<br />
SIKORSKY<br />
S76C++<br />
AIRBUS<br />
H155<br />
BELL<br />
412EP<br />
BELL<br />
412EPI<br />
<strong>EN</strong>GINE<br />
Engine Type<br />
Maximum Shaft Horsepower<br />
(Single Engine)*<br />
PWC PT6C-67C<br />
1,679 shp<br />
Turbomeca Arriel 2S2<br />
1,034 shp<br />
Turbomeca Arriel 2C2<br />
1,053 shp<br />
PWC PT6T-3D<br />
900 shp<br />
PWC PT6T-9<br />
1,021 shp<br />
PERFORMANCES<br />
Seats Full Range (30 min Reserve)<br />
Max Range (30 min Reserve)<br />
Long-Range Cruise Speed<br />
Rate of Climb<br />
Service Altitude<br />
Useful Load<br />
Payload w/ Full Fuel<br />
460 nm<br />
580 nm<br />
140 kts<br />
2,140 ft/min<br />
20,000 ft<br />
4,701 lb<br />
1,937 lb<br />
335 nm<br />
335 nm<br />
138 kts<br />
1,800 ft/min<br />
15,000 ft<br />
3,571 lb<br />
1,697 lb<br />
373 nm<br />
438 nm<br />
126 kts<br />
1,163 ft/min<br />
15,000 ft<br />
3,341 lb<br />
1,117 lb<br />
310 nm<br />
314 nm<br />
115 kts<br />
1,780 ft/min<br />
16,500 ft<br />
4,028 lb<br />
1,814 lb<br />
312 nm<br />
318 nm<br />
126 kts<br />
1,600 ft/min<br />
16,500 ft<br />
3,911 lb<br />
1,688 lb<br />
CABIN<br />
Passengers & Crew Capacity<br />
Cabin Volume<br />
Baggage Area<br />
15 Pax w/ 2 Crew<br />
282 cu ft<br />
120 cu ft<br />
13 Pax w/ 1 Crew<br />
208 cu ft<br />
68 cu ft<br />
13 Pax w/ 1 Crew<br />
225 cu ft<br />
88 cu ft<br />
14 Pax w/ 1 Crew<br />
208 cu ft<br />
68 cu ft<br />
14 Pax w/ 1 Crew<br />
205 cu ft<br />
38 cu ft<br />
OPERATING<br />
COST<br />
Annual Fixed Cost<br />
Hourly Variable Cost<br />
$716,066<br />
$1,830 / hr<br />
$471,831<br />
$1,816 / hr<br />
$531,438<br />
$1,593 / hr<br />
$506,731<br />
$1,615 / hr<br />
$494,581<br />
$1,651 / hr<br />
MARKET<br />
CONDITION<br />
Production<br />
List Price<br />
Average Asking Price<br />
Pre-owned Market**<br />
Total Fleet Delivered<br />
# of Aircraft for Sale<br />
2004 - Present<br />
$14.1M<br />
$7.7M<br />
898<br />
28<br />
2006-2012<br />
$6.8M<br />
$5.4M<br />
209<br />
23<br />
2003-Present<br />
$13.85M<br />
$7.5M<br />
146<br />
9<br />
1994-2013<br />
$9.6M<br />
$4.2M<br />
551<br />
32<br />
2014 - Present<br />
$11.25M<br />
N/A<br />
25<br />
-<br />
Data Source: Conklin & De Decker 2019; (*) OEM; (**) Asian Sky Group & Jetnet<br />
Assumptions: 45,000 nm Annual Utilization (300+ Operating Hours); Fuel Price: 4.73 USD/Gal; Labor Cost 106 USD/Hour.<br />
30 | ASIAN SKY QUARTERLY — FOURTH QUARTER 2018
PRE-OWNED SPOTLIGHT<br />
AW139 DEVELOPM<strong>EN</strong>T TIME LINE<br />
YEAR<br />
1998<br />
2000<br />
2003<br />
2004<br />
2005<br />
2008<br />
2011<br />
2015<br />
EV<strong>EN</strong>T<br />
Bell and Agusta entered into an agreement to set up a joint venture to develop a conventional helicopter - AB139.<br />
Bristow placed the first order for an AW139.<br />
AW139 received certification by European JAA.<br />
AW139 received certification by FAA.<br />
AgustaWestland bought out Bell’s 25% share in the program and all of its rights to the AW139 for US $95 million.<br />
AgustaWestland revealed AW139’s upgrade to enhance max gross weight to 14,991 lb (6,800 kg) to better compete in<br />
long-range markets served by helicopters such as the larger Sikorsky S-92 and Eurocopter EC225.<br />
The military-configured variant, the AW139M, was introduced to the market.<br />
AgustaWestland unveiled an AW139 variant with an increased gross weight of 7 tonnes, enabling a range of 305 km<br />
while carrying 12 passengers; existing AW139s can also be rebuilt to include the higher weight capacity the newer<br />
heavy-weight model.<br />
PRE-OWNED MARKET ANALYSIS<br />
Worldwide, the AW139 operating fleet stood at 898, as of January<br />
2019. Asia, which is base to 22% of the operating fleet, is the most<br />
popular region for the series, where Japan, China and Malaysia are<br />
home to relatively large AW139 fleets. Western Europe falls just short<br />
of that with 21% of the operating fleets. However, by country, the US<br />
is home to the largest fleet of AW139s with approximately 10% of<br />
the fleet.<br />
Age-wise, the US has the most mature fleet with an average year of<br />
manufacture year of 2011, while China has the youngest fleet with<br />
an average year of manufacture of 2015; reflective of Leonardo’s<br />
marketing efforts in China. Much like other helicopters utilized for<br />
O&G operations, delivery of the AW139 starkly declined after 2014,<br />
coinciding with the downturn of the O&G market.<br />
As of January 2019, almost 3% of the AW139 fleet were for sale. Over<br />
half of those for sale are configured for VIP/corporate use, attributed<br />
to the aircraft’s spacious interior. Over a quarter are configured for<br />
multi-mission use and 19% are configured for EMS use.<br />
Average asking prices of the AW139 are stabilizing. The average<br />
price in December 2018 was US$7.7M, slightly down from December<br />
2017 when the price was US$7.8M and much lower than the average<br />
asking price in December 2016 — US$8.3M. Lower average asking<br />
prices, and subsequently lower inventory values, have led to more<br />
transactions in the AW139 market.<br />
Average days on market (DOM) have decreased from 2016. In<br />
December 2018, the average DOM was 514 days; below average for<br />
most helicopters, including competitors — Sikorsky S76C++, Airbus<br />
H155 and the Bell 412EP.<br />
When comparing the AW139 with its main competitors, the AW139<br />
boasts a more powerful engine with higher horsepower. Performancewise,<br />
its range is farther, and its speed is faster than competitors.<br />
Although the AW139 has a higher annual fixed cost than the S76C++,<br />
H155 and Bell 412EP, the hourly variable cost — considering speed<br />
and range — is lower. The AW139’s cabin capacity has a significant<br />
amount of more space than its competitors. With 282 cubic-feet of<br />
cabin volume and 120 cubic feet of baggage area, the AW139 has<br />
FOURTH QUARTER 2018 — ASIAN SKY QUARTERLY | 31
PRE-OWNED SPOTLIGHT<br />
CURR<strong>EN</strong>T PRE-OWNED FLEET FOR SALE<br />
54+27+19+G<br />
BREAKDOWN BY MISSION CONFIGURATION*<br />
EMS, 5 (19%)<br />
Utility, 7 (27%)<br />
TOTAL FLEET<br />
26<br />
VIP, 14 (54%)<br />
PRE-OWNED FLEET FOR SALE:<br />
AGE DISTRIBUTION & CONFIGURATION BREAKDOWN<br />
Utility VIP EMS<br />
3<br />
1<br />
3 3<br />
1 3 1<br />
2<br />
1 1 1 1<br />
1 1 1 1 1<br />
2004 2005 2006 2007 2008 2009 2010 2011 2012 2013<br />
more space for passengers and more space to reconfigure the cabin<br />
to make it suitable for other mission types. The Airbus H155 follows<br />
in terms of space, with 225 cubic feet of cabin volume and 88 cubic<br />
feet of baggage area.<br />
PRE-OWNED FLEET FOR SALE:<br />
SUPPLY REGION & CONFIGURATION BREAKDOWN<br />
Utility VIP EMS<br />
The market’s demand and preference for the AW139 (manufactured<br />
from 2004-present) is reflected in its total operating fleet number<br />
of 898, compared with the S76C++’s fleet of 209 (manufactured<br />
from 2006-2012), the H155’s fleet of 146 (manufactured from<br />
2003-present), the Bell 412EP of 551 (manufactured from 1994-2013)<br />
and the Bell 412EPI of 25 (manufactured from 2014-present). The<br />
Airbus H160, expected to enter service later this year, is set to replace<br />
the H155. Although for now, the AW139 has clearly established itself<br />
as the medium twin-engine market leader.<br />
3<br />
1<br />
4<br />
Western<br />
Europe<br />
1<br />
4<br />
1<br />
Northern<br />
America<br />
3<br />
1<br />
Eastern<br />
Europe<br />
3<br />
Asia<br />
3<br />
Middle<br />
East<br />
1<br />
1<br />
Latin<br />
America<br />
PRE-OWNED AW139 INV<strong>EN</strong>TORY VALUE VS. AVERAGE ASKING PRICE<br />
PRE-OWNED MARKET<br />
INV<strong>EN</strong>TORY VALUE (MUSD)<br />
AW139 Inventory Value Avg Asking Price<br />
$300 $8.6<br />
9.0<br />
$8.3 $8.3 $8.3 $8.3 $8.3<br />
$8.5 $8.3 $8.3<br />
$8.0 $7.8 $7.8<br />
$7.8 $7.8 $7.5 $7.9 $7.9 $8.1<br />
$7.8<br />
$7.7<br />
$7.3 $7.4 $7.4 $7.3 $7.3<br />
8.0<br />
$250<br />
$238<br />
$223<br />
$217 $217<br />
7.0<br />
$205<br />
$213 $207<br />
$199 $205<br />
$200<br />
$190 $191 $191<br />
$195<br />
$188 $188 $188<br />
$190 $195 $198 $198<br />
$186 $186 6.0<br />
$173 $173<br />
$180<br />
5.0<br />
$150<br />
4.0<br />
$100<br />
3.0<br />
2.0<br />
$50<br />
1.0<br />
AVG. ASKING PRICE (M USD)<br />
$0 0<br />
Dec 2016<br />
Jan 2017<br />
Feb 2017<br />
Mar 2017<br />
Apr 2017<br />
May 2017<br />
Jun 2017<br />
Jul 2017<br />
Aug 2017<br />
Sep 2017<br />
Oct 2017<br />
Nov 2017<br />
Dec 2017<br />
Jan 2018<br />
Feb 2018<br />
Mar 2017<br />
Apr 2018<br />
May 2018<br />
Jun 2018<br />
Jul 2018<br />
Aug 2018<br />
Sep 2018<br />
Oct 2018<br />
Nov 2018<br />
Dec 2018<br />
AIRCRAFT FOR SALE & TRANSACTIONS VS. DAYS ON MARKET<br />
AW139 Aircraft for sale AW139 Aircraft for sold Days on market<br />
60 700<br />
648 644<br />
612 615<br />
602 595 595<br />
50<br />
600<br />
524<br />
579 587<br />
522<br />
544<br />
463 500<br />
40<br />
442<br />
482 495<br />
464 478 491<br />
481<br />
509 506 514<br />
436 438<br />
400<br />
30<br />
28 28<br />
29 28<br />
26 26 27 28<br />
26 26<br />
23 23 23 24<br />
24 25 24 23 24 25 25<br />
23 24 300<br />
21 21<br />
20<br />
200<br />
10<br />
2<br />
1<br />
1 1 2<br />
1 1<br />
2<br />
3 2<br />
100<br />
0 0<br />
Dec 2016<br />
Jan 2017<br />
Feb 2017<br />
Mar 2017<br />
Apr 2017<br />
May 2017<br />
Jun 2017<br />
Jul 2017<br />
Aug 2017<br />
Sep 2017<br />
Oct 2017<br />
Nov 2017<br />
Dec 2017<br />
Jan 2018<br />
Feb 2018<br />
Mar 2017<br />
Apr 2018<br />
May 2018<br />
Jun 2018<br />
Jul 2018<br />
Aug 2018<br />
Sep 2018<br />
Oct 2018<br />
Nov 2018<br />
Dec 2018<br />
Data Source: ASG & JETNET<br />
* Number of fleet for sale as of January 2019<br />
32 | ASIAN SKY QUARTERLY — FOURTH QUARTER 2018
PRE-OWNED SPOTLIGHT<br />
PRE-OWNED MARKET AVAILABILITY<br />
REF DELIVERY YEAR AFTT DOM BASE REGION CONFIGURATION Asking Price (USD)<br />
1 2004 2186 863 Northern America Utility 8,500,000<br />
2 2005 2750 771 Northern America Utility Make Offer<br />
3 2006 738 1317 Northern America VIP 7,950,000<br />
4 2006 1066 771 Northern America Utility Make Offer<br />
5 2006 2865 133 Asia VIP 5,000,000<br />
6 2006 600 133 Asia VIP 5,000,000<br />
7 2007 1425 657 Western Europe VIP Make Offer<br />
8 2007 4791 288 Latin America Utility 3,800,000<br />
9 2008 2438 1150 Eastern Europe Utility Make Offer<br />
10 2008 4900 596 Eastern Europe VIP Make Offer<br />
11 2008 739 471 Eastern Europe VIP Make Offer<br />
12 2008 4625 371 Western Europe EMS 7,000,000<br />
13 2008 4942 359 Western Europe EMS 7,000,000<br />
14 2008 4686 359 Western Europe EMS 7,000,000<br />
15 2008 967 76 Middle East VIP 6,000,000<br />
16 2009 418 657 Western Europe VIP 6,900,000<br />
17 2009 6975 43 Western Europe Utility 8,588,000<br />
18 2010 1902 1533 Asia VIP 7,000,000<br />
19 2010 487 1431 Middle East VIP 7,095,000<br />
20 2010 604 377 Latin America VIP Make Offer<br />
21 2010 1467 367 Northern America Utility Make Offer<br />
22 2011 2687 192 Western Europe EMS 9,900,000<br />
23 2012 272 471 Eastern Europe VIP Make Offer<br />
24 2013 947 237 Middle East VIP 8,900,000<br />
25 2013 1584 64 Northern America EMS 9,000,000<br />
FOURTH QUARTER 2018 — ASIAN SKY QUARTERLY | 33
MARKET DYNAMICS<br />
PRE-OWNED BUSINESS JETS FOR SALE - 2018 Q4<br />
INV<strong>EN</strong>TORY VALUE (USD) 1<br />
$7,752M<br />
WORLDWIDE<br />
$5,683M<br />
SEP 2018<br />
$5,587M<br />
$1,300M<br />
ASIA PACIFIC<br />
$1,155M<br />
SEP 2018<br />
$970M<br />
Dec Jan<br />
2016 2017<br />
Feb<br />
Mar<br />
Apr<br />
May<br />
Jun<br />
Jul<br />
Aug<br />
Sep<br />
Oct<br />
Nov<br />
Dec<br />
Jan<br />
2018<br />
Feb<br />
Mar<br />
Apr<br />
May<br />
Jun<br />
Jul<br />
Aug<br />
Sep<br />
Oct<br />
Nov<br />
Dec<br />
MARKET TR<strong>EN</strong>D 1<br />
WORLDWIDE<br />
TR<strong>EN</strong>D REVERSAL<br />
The Inventory Value Line represents the number of aircraft actively being marketed for sale in USD terms. 2<br />
The Trend Line represents the market’s direction in terms of the balance between sellers and buyers (supply and<br />
demand) at today’s price levels. A rising Trend Line indicates that pre-owned activity is stabilizing, with sellers of<br />
aircraft increasingly likely to find buyers.<br />
The Signal Line represents an indication of where the market’s direction may be heading in the future. A Signal<br />
Line consistently falling below the Trend Line indicates that any improvement in the market’s direction may not be<br />
entirely sustainable.<br />
TR<strong>EN</strong>D<br />
IMPROVEM<strong>EN</strong>T<br />
TR<strong>EN</strong>D<br />
WORS<strong>EN</strong>ING<br />
MOVING TOWARDS SELLER’S MARKET<br />
MOVING TOWARDS BUYER’S MARKET<br />
AIRCRAFT SOLD 1<br />
WORLDWIDE<br />
32<br />
21<br />
25 25<br />
25<br />
22<br />
36<br />
30<br />
49<br />
40 41<br />
37<br />
34 35 34<br />
34<br />
33<br />
30<br />
30<br />
28<br />
24 24<br />
25<br />
22<br />
27<br />
Dec Jan<br />
2016 2017<br />
Feb<br />
Mar<br />
Apr<br />
May<br />
Jun<br />
Jul<br />
Aug<br />
Sep<br />
Oct<br />
Nov<br />
Dec<br />
Jan<br />
2018<br />
Feb<br />
Mar<br />
Apr<br />
May<br />
Jun<br />
Jul<br />
Aug<br />
Sep<br />
Oct<br />
Nov<br />
Dec<br />
1 The historical inventory value and transactions are subject to change based on latest market information updates.<br />
2 ASG’s Inventory Value line is calculated by taking the total number of aircraft for sale from a selection of 26 different models, multiplied by their average asking prices.<br />
34 | ASIAN SKY QUARTERLY — FOURTH QUARTER 2018<br />
Source: JETNET & ASG
MARKET DYNAMICS<br />
% OF FLEET SOLD<br />
1.20%<br />
1.15%<br />
1.10%<br />
1.05%<br />
1.00%<br />
0.95%<br />
0.90%<br />
0.85%<br />
0.80%<br />
0.75%<br />
0.70%<br />
0.65%<br />
0.60%<br />
0.55%<br />
0.50%<br />
0.45%<br />
0.40%<br />
Dec<br />
16<br />
Feb<br />
17<br />
Apr<br />
17<br />
Jun<br />
17<br />
Aug<br />
17<br />
Oct<br />
17<br />
Dec<br />
17<br />
Feb<br />
18<br />
Apr<br />
18<br />
Jun<br />
18<br />
Aug<br />
18<br />
Out<br />
18<br />
Dec<br />
18<br />
AVERAGE ASKING PRICE<br />
MILLION USD<br />
31<br />
29<br />
27<br />
25<br />
ASIA PACIFIC<br />
23<br />
21<br />
WORLDWIDE<br />
19<br />
17<br />
Dec<br />
16<br />
Feb<br />
17<br />
Apr<br />
17<br />
Jun<br />
17<br />
Aug<br />
17<br />
Oct<br />
17<br />
Dec<br />
17<br />
Feb<br />
18<br />
Apr<br />
18<br />
Jun<br />
18<br />
Aug<br />
18<br />
Out<br />
18<br />
Dec<br />
18<br />
% OF FLEET FOR SALE<br />
15%<br />
13%<br />
ASIA PACIFIC<br />
11%<br />
9%<br />
7%<br />
WORLDWIDE<br />
5%<br />
3%<br />
Dec<br />
16<br />
Feb<br />
17<br />
Apr<br />
17<br />
Jun<br />
17<br />
Aug<br />
17<br />
Oct<br />
17<br />
Dec<br />
17<br />
Feb<br />
18<br />
Apr<br />
18<br />
Jun<br />
18<br />
Aug<br />
18<br />
Out<br />
18<br />
Dec<br />
18<br />
AVERAGE DAYS ON MARKET<br />
620<br />
570<br />
520<br />
470<br />
ASIA PACIFIC<br />
420<br />
370<br />
320<br />
WORLDWIDE<br />
270<br />
220<br />
Dec<br />
16<br />
Feb<br />
17<br />
Apr<br />
17<br />
Jun<br />
17<br />
Aug<br />
17<br />
Oct<br />
17<br />
Dec<br />
17<br />
Feb<br />
18<br />
Apr<br />
18<br />
Jun<br />
18<br />
Aug<br />
18<br />
Out<br />
18<br />
Dec<br />
18<br />
Source: JETNET & ASG<br />
FOURTH QUARTER 2018 — ASIAN SKY QUARTERLY | 35
MARKET DYNAMICS<br />
SUPPLY / DEMAND INDICATORS<br />
BUSINESS JETS<br />
SUPPLY VS. DEMAND RATIO<br />
AVERAGE DAYS ON MARKET<br />
SUPPLY ><br />
DEMAND<br />
% OF FLEET<br />
FOR SALE<br />
MODEL<br />
DAYS ON MARKET<br />
25.0%<br />
15.7%<br />
12.9%<br />
17.4%<br />
5.6%<br />
4.9%<br />
8.5%<br />
10.3%<br />
2.8%<br />
5.7%<br />
8.2%<br />
20.7%<br />
EMBRAER BOMBARDIER BOEING AIRBUS<br />
ACJ318<br />
ACJ319<br />
BBJ<br />
BBJ2<br />
CL604<br />
CL605<br />
CL850<br />
GL5000<br />
GL6000<br />
L600<br />
L650<br />
L1000<br />
AVERAGE<br />
3.1%<br />
2.6%<br />
5.1%<br />
F2000LX<br />
F2000LXS<br />
F2000S<br />
AVERAGE<br />
3.9%<br />
12.5%<br />
5.9%<br />
7.6%<br />
DASSAULT<br />
F7X<br />
F900DX<br />
F900EX<br />
F900EXe<br />
0.0%<br />
11.9%<br />
F900LX<br />
G200<br />
None for Sale<br />
2.0%<br />
5.6%<br />
5.0%<br />
3.6%<br />
GULFSTREAM<br />
G280<br />
G450<br />
G550<br />
G650<br />
3.7%<br />
G650ER<br />
400% 300% 200% 100%<br />
0<br />
Average AC for sale / Total sold in last 12 months<br />
6.2%<br />
Average<br />
0 200 400 600 800 1000<br />
The above chart reflects where certain aircraft models are positioned<br />
in terms of supply and demand (based on a ratio of completed<br />
transactions compared to the number of sellers and the average<br />
number of days on the market for a transaction to take place).<br />
These indications do not necessarily mean that prices will be higher in<br />
the future, but it does indicate that sellers of these particular models<br />
are more likely to find willing buyers in a shorter period of time than the<br />
overall average.<br />
For some model types, given the market indicators shown on the<br />
previous page, the stabilization in pre-owned asking prices and<br />
decline in inventory level appear to have stimulated increased<br />
demand, leading to an increase in transactions and a more balanced<br />
state of supply and demand.<br />
This can be seen most with certain Gulfstream (G200, G450, G550,<br />
G650), Bombardier models (Challenger 604/605 & Global 5000)<br />
and Dassault Falcon models (2000 Series and 7X), where more<br />
transactions are occurring relative to the number for sale, and<br />
transactions are requiring less time on the market for sellers to<br />
complete.<br />
36 | ASIAN SKY QUARTERLY — FOURTH QUARTER 2018<br />
Source: JETNET & ASG
MARKET DYNAMICS<br />
MARKET POSITIONING<br />
BUSINESS JETS<br />
MOVING TOWARDS<br />
BUYER’S MARKET<br />
Balanced<br />
Supply & Demand<br />
MOVING TOWARDS<br />
SELLER’S MARKET<br />
AIRBUS<br />
BOEING<br />
ACJ318<br />
ACJ319<br />
BBJ 1<br />
BBJ 2<br />
CL604<br />
BOMBARDIER<br />
CL605<br />
CL850<br />
GL5000<br />
GL6000<br />
EMBRAER<br />
L600<br />
L650<br />
L1000<br />
F2000LX<br />
F2000LXS<br />
F2000S<br />
DASSAULT<br />
F7X<br />
F900DX<br />
F900EX<br />
F900EXe<br />
F900LX<br />
G200<br />
GULFSTREAM<br />
G280<br />
G450<br />
G550<br />
G650<br />
G650ER<br />
The above chart provides a visual representation of the Supply /<br />
Demand Ratio of each aircraft model relative to the overall market,<br />
and is based on a ‘Marketability’ calculation for each particular model<br />
including the following four market indicators:<br />
When taking into account these four factors, most of the the large and<br />
medium sized jets, such as Challenger 600, Falcon 2000 & 900 Series,<br />
as well as the various Gulfstream models, appear better positioned to<br />
find buyers available, compare to corporate airliner models.<br />
1. The percentage of aircraft for sale relative to its fleet size.<br />
2. The number of aircraft sold relative to the average number for sale.<br />
3. The average days for sale relative to the overall market average.<br />
4. The momentum of the marketplace (represented by the trend<br />
towards supply and demand market equilibrium portrayed earlier).<br />
* ASG chose 26 popular aircraft models as described in this report<br />
Source: JETNET & ASG<br />
FOURTH QUARTER 2018 — ASIAN SKY QUARTERLY | 37
MARKET DYNAMICS<br />
PRE-OWNED CIVIL HELICOPTERS FOR SALE - 2018 Q4<br />
INV<strong>EN</strong>TORY VALUE (USD) 1<br />
WORLDWIDE<br />
$994M<br />
$1,167M<br />
SEP 2018<br />
$1,128M<br />
ASIA PACIFIC<br />
$105M<br />
$114M<br />
SEP 2018<br />
$97.5M<br />
Dec Jan<br />
2016 2017<br />
Feb<br />
Mar<br />
Apr<br />
May<br />
Jun<br />
Jul<br />
Aug<br />
Sep<br />
Oct<br />
Nov<br />
Dec<br />
Jan<br />
2018<br />
Feb<br />
Mar<br />
Apr<br />
May<br />
Jun<br />
Jul<br />
Aug<br />
Sep<br />
Oct<br />
Nov<br />
Dec<br />
The Inventory Value Line represents the number of aircraft actively being marketed for sale in USD terms. 2<br />
The Trend Line represents the market’s direction in terms of the balance between sellers and buyers (supply and<br />
demand) at today’s price levels. A rising Trend Line indicates that pre-owned activity is stabilizing, with sellers of<br />
aircraft increasingly likely to find buyers.<br />
The Signal Line represents an indication of where the market’s direction may be heading in the future. A Signal<br />
Line consistently falling below the Trend Line indicates that any improvement in the market’s direction may not be<br />
entirely sustainable.<br />
MARKET TR<strong>EN</strong>D 1<br />
WORLDWIDE<br />
TR<strong>EN</strong>D<br />
REVERSAL<br />
MOVING TOWARDS SELLER’S MARKET<br />
MOVING TOWARDS BUYER’S MARKET<br />
TR<strong>EN</strong>D<br />
IMPROVEM<strong>EN</strong>T<br />
TR<strong>EN</strong>D<br />
WORS<strong>EN</strong>ING<br />
AIRCRAFT SOLD 1<br />
WORLDWIDE<br />
7 7<br />
10<br />
9<br />
10<br />
10<br />
7<br />
6 7<br />
4<br />
2<br />
1<br />
6<br />
18<br />
19<br />
8<br />
15<br />
13 14<br />
16<br />
8<br />
17<br />
11<br />
9 9<br />
Dec Jan<br />
2016 2017<br />
Feb<br />
Mar<br />
Apr<br />
May<br />
Jun<br />
Jul<br />
Aug<br />
Sep<br />
Oct<br />
Nov<br />
Dec<br />
Jan<br />
2018<br />
Feb<br />
Mar<br />
Apr<br />
May<br />
Jun<br />
Jul<br />
Aug<br />
Sep<br />
Oct<br />
Nov<br />
Dec<br />
1 The historical inventory value and transactions are subject to change based on latest market information updates.<br />
2 ASG’s Inventory Value line is calculated by taking the total number of aircraft for sale from a selection of 16 different models, multiplied by their average asking prices.<br />
38 | ASIAN SKY QUARTERLY — FOURTH QUARTER 2018<br />
Source: JETNET & ASG
MARKET DYNAMICS<br />
% OF FLEET SOLD<br />
0.50%<br />
0.45%<br />
0.40%<br />
0.35%<br />
0.30%<br />
0.25%<br />
0.20%<br />
0.15%<br />
0.10%<br />
0.05%<br />
0.00%<br />
Dec<br />
16<br />
Feb<br />
17<br />
Apr<br />
17<br />
Jun<br />
17<br />
Aug<br />
17<br />
Oct<br />
17<br />
Dec<br />
17<br />
Feb<br />
18<br />
Apr<br />
18<br />
Jun<br />
18<br />
Aug<br />
18<br />
Out<br />
18<br />
Dec<br />
18<br />
AVERAGE ASKING PRICE<br />
MILLION USD<br />
6.5<br />
6<br />
ASIA PACIFIC<br />
5.5<br />
5<br />
WORLDWIDE<br />
4.5<br />
4<br />
Dec<br />
16<br />
Feb<br />
17<br />
Apr<br />
17<br />
Jun<br />
17<br />
Aug<br />
17<br />
Oct<br />
17<br />
Dec<br />
17<br />
Feb<br />
18<br />
Apr<br />
18<br />
Jun<br />
18<br />
Aug<br />
18<br />
Out<br />
18<br />
Dec<br />
18<br />
% OF FLEET FOR SALE<br />
8.0%<br />
7.0%<br />
ASIA PACIFIC<br />
6.0%<br />
5.0%<br />
4.0%<br />
3.0%<br />
WORLDWIDE<br />
2.0%<br />
1.0%<br />
0.0%<br />
Dec<br />
16<br />
Feb<br />
17<br />
Apr<br />
17<br />
Jun<br />
17<br />
Aug<br />
17<br />
Oct<br />
17<br />
Dec<br />
17<br />
Feb<br />
18<br />
Apr<br />
18<br />
Jun<br />
18<br />
Aug<br />
18<br />
Out<br />
18<br />
Dec<br />
18<br />
AVERAGE DAYS ON MARKET<br />
800<br />
750<br />
700<br />
650<br />
600<br />
WORLDWIDE<br />
550<br />
500<br />
450<br />
400<br />
ASIA PACIFIC<br />
350<br />
300<br />
Dec<br />
16<br />
Feb<br />
17<br />
Apr<br />
17<br />
Jun<br />
17<br />
Aug<br />
17<br />
Oct<br />
17<br />
Dec<br />
17<br />
Feb<br />
18<br />
Apr<br />
18<br />
Jun<br />
18<br />
Aug<br />
18<br />
Out<br />
18<br />
Dec<br />
18<br />
Source: JETNET & ASG<br />
FOURTH QUARTER 2018 — ASIAN SKY QUARTERLY | 39
MARKET DYNAMICS<br />
SUPPLY / DEMAND INDICATORS<br />
CIVIL HELICOPTERS<br />
SUPPLY VS. DEMAND RATIO<br />
AVERAGE DAYS ON MARKET<br />
SUPPLY ><br />
DEMAND<br />
% OF FLEET<br />
FOR SALE<br />
MODEL<br />
DAYS ON MARKET<br />
14.4%<br />
S76C+<br />
11.0%<br />
SIKORSKY<br />
S76C++<br />
3.2%<br />
S92A<br />
AVERAGE<br />
5.8%<br />
9.8%<br />
5.3%<br />
BELL HELICOPTER<br />
BELL 412EP<br />
BELL 412HP<br />
BELL 429<br />
AVERAGE<br />
12.4%<br />
AW109E PWR<br />
3.8%<br />
LEONARDO<br />
AW109SP GN<br />
2.7%<br />
AW139<br />
3.0%<br />
AS332L1<br />
9.5%<br />
H225<br />
4.6%<br />
2.8%<br />
1.5%<br />
AIRBUS HELICOPTERS<br />
EC135P2<br />
EC135T2<br />
EC145<br />
21.4%<br />
EC155B<br />
6.2%<br />
H155<br />
350% 300% 250% 200% 150% 100% 50% 0<br />
Average AC for sale / Total sold in last 12 months<br />
5.2%<br />
Average<br />
0 100 200 300 400 500 600 700 800<br />
The above chart reflects where certain aircraft models are positioned in terms of supply and demand (based on a ration of completed transactions<br />
compared to the number of sellers, and average number of days on the market for a transaction to take place).<br />
40 | ASIAN SKY QUARTERLY — FOURTH QUARTER 2018<br />
Source: JETNET & ASG
MARKET DYNAMICS<br />
MARKET POSITIONING<br />
CIVIL HELICOPTERS<br />
MOVING TOWARDS<br />
BUYER’S MARKET<br />
Balanced<br />
Supply & Demand<br />
MOVING TOWARDS<br />
SELLER’S MARKET<br />
S76C+<br />
SIKORSKY<br />
S76C++<br />
S92A<br />
BELL HELICOPTER<br />
BELL 412EP<br />
BELL 412HP<br />
BELL 429<br />
AW109E PWR<br />
LEONARDO<br />
AW109SP GN<br />
AW139<br />
AS332L1<br />
H225<br />
AIRBUS HELICOPTERS<br />
EC135P2<br />
EC135T2<br />
EC145<br />
EC155B<br />
H155<br />
The above chart provides a visual representation of the Supply / Demand Ratio of each aircraft model relative to the overall market, resulting in a<br />
‘Marketability’ calculation of each particular model based on the following four market indicators:<br />
1. The percentage of aircraft for sale relative to its fleet size.<br />
2. The number of aircraft sold relative to the average number for sale.<br />
3. The average days for sale relative to the overall market average.<br />
4. The momentum of the marketplace (represented by the trend towards supply and demand market equilibrium portrayed earlier).<br />
Source: JETNET & ASG<br />
FOURTH QUARTER 2018 — ASIAN SKY QUARTERLY | 41
INTERVIEW:<br />
MATTHIEU GUISOLPHE,<br />
ASG ROTARY PROGRAM MANAGER<br />
SERVING VIP OPERATIONS IN<br />
SOUTHEAST ASIA<br />
Interview by Roderick Li<br />
Matthieu Guisolphe is the latest addition at Asian Sky Group. As Rotary Program Manager, Matthieu<br />
is based in Kuala Lumpur, Malaysia and now covers the Southeast Asia market. He most recently<br />
worked for Airbus Helicopters, offering sales support on maintenance and repair requests, retrofits<br />
and ensuring clients had all the necessary tools and know-how for their operations. Moving forward with<br />
Asian Sky Group, Matthieu sees the potential for the rotary market in Southeast Asia, particularly in the VIP/<br />
Corporate segment.<br />
What is the outlook on the rotary market in<br />
Southeast Asia?<br />
The rotary market in this region has posted limited growth in the<br />
past few years, with most countries only increasing their fleet sizes<br />
by just a few helicopters. When compared to a market like Mainland<br />
China this is minimal, however there’s still a steady demand. The<br />
main reason for this is that the primary market driver in the past<br />
years has been the oil and gas (O&G) industry. With the downturn<br />
in O&G, several operators in the region have looked to diversify their<br />
fleets. The multi-mission segment is growing and, additionally, these<br />
markets are now utilizing helicopters for VIP and corporate use.<br />
Which markets have the most potential for<br />
the VIP/corporate segment?<br />
Southeast Asia is home to some of the fastest-growing economies,<br />
which is bringing new industries to respective countries. As some<br />
manufacturing moves away from Mainland China, Vietnam and other<br />
Southeast Asian countries have presented themselves as viable<br />
alternatives. While the infrastructure in most of these countries<br />
isn’t quite there yet, a solution for factory owners and entrepreneurs<br />
entering other industries could be helicopters that would transfer<br />
these VIPs from city centers to remote areas of the country.<br />
Indonesia is also an interesting market. As one of the largest<br />
economies in Southeast Asia, Indonesia is home to a growing number<br />
of wealthy individuals. Considering the country’s notorious traffic<br />
issues, particularly in Jakarta and Bandung in West Java, the use of<br />
helicopters makes sense for VIPs hoping to maximize their time and<br />
avoid the congestion. For now, aside from private owners, there are<br />
very few operators dedicated to providing this service in the city but<br />
there are also notable companies — Uber, Grab and Ascent, expressing<br />
interest in providing this service. There’s certainly a lot of potential<br />
there.<br />
Malaysia has one of the strongest economies and is home to one of<br />
the largest VIP/corporate fleets in the region. Successful entrepreneurs<br />
and royal families are accustomed to flying across the country to save<br />
time and reduce the hassle. Major OEMs, such as Airbus Helicopters<br />
and Leonardo, have clearly identified Malaysia as such and have<br />
established MRO Centres to support these VIP Customers.<br />
What drives demand for this mission<br />
segment in Southeast Asia?<br />
The driver for VIP/corporate use varies from country to country, just<br />
as their economies and geography varies. In places like the Philippines<br />
and Indonesia, which are both made up of thousands of smaller<br />
islands, the use of helicopters for charter makes travel to and from<br />
remote places easier and quicker. Growing industries in Vietnam, and<br />
42 | ASIAN SKY QUARTERLY — FOURTH QUARTER 2018
INDUSTRY INSIDER<br />
even Cambodia and Laos, drive the need for quicker and more efficient<br />
transport in places where there is little infrastructure in place. In<br />
Malaysia, helicopter is the fastest alternative to very often congested<br />
roads and access to isolated areas.<br />
Overall, many countries in this region are experiencing economic<br />
growth, which has consequently created a need for helicopter charter<br />
for many reasons.<br />
Is there a model or manufacturer doing<br />
particularly well in this region?<br />
Airbus Helicopters is the dominant manufacturer in most countries<br />
of Southeast Asia. For example, in Airbus Helicopters’ Dolphin family,<br />
I expect the H160 to be a successful product, especially for those<br />
owners looking to get an upgraded and more modern helicopter.<br />
Leonardo has been a ferocious competitor to Airbus Helicopters in this<br />
segment and has been strongly marketing their brand as a very good<br />
alternative.<br />
windfarms, I don’t see Southeast Asia as a mature enough market for<br />
such segment just yet.<br />
Bell Helicopter also does notably well. A lot of manufacturers are now<br />
seeing the potential in this market. Traditional OEMs have positioned<br />
themselves to further support and grow the industries in this region.<br />
Russian Helicopters have recently shown increased interest in growing<br />
their business in Southeast Asia.<br />
What are your expectations for the rotary<br />
industry in Southeast Asia, across all<br />
mission segments?<br />
While the O&G market recovers, there may be potential for helicopters<br />
for further O&G exploration in the future. 2019 will be a decisive year<br />
for this market segment and should give more visibility to O&G players<br />
in the region.<br />
There’s also the potential for helicopters used for alternative sources<br />
of energy, such as wind farms — although this may be a long way<br />
off. As China and Northeast Asia look like a promising market for<br />
I expect a lot of operators in this region will focus on helicopters<br />
operations in multi-mission segments, which can include cargo<br />
lifting, forestry, firefighting, aerial photography and more. A lot of<br />
government entities are also focusing on emergency medical services,<br />
which will take time and money to get developed and implemented<br />
in the region. However, we can see such operations are starting to<br />
take place in various countries, most recently in Malaysia, as well. I<br />
expect these mission segments to grow over the next couple of years.<br />
And, of course, there will be stable opportunities in the VIP/corporate<br />
and charter segments, which is seemingly becoming necessary for<br />
operators in this region to provide.<br />
While there may not be growth similar to what is seen in other regions<br />
in Asia, I do believe there will continue to be steady growth over the<br />
years, boosted by these growing economies.<br />
www.asianskygroup.com<br />
FOURTH QUARTER 2018 — ASIAN SKY QUARTERLY | 43
ADS<br />
China Heli Expo<br />
44 | ASIAN SKY QUARTERLY — FOURTH QUARTER 2018
AIRCRAFT SPOTLIGHT<br />
AIRBUS H160<br />
Airbus has always described the H160 as “the game-changer”. Its design,<br />
with multiple “firsts” on a helicopter and endowing Airbus with 68 patents<br />
alone, makes the medium-sized aircraft lighter and safer than ever, hence<br />
should not be deemed as “revolutionary” but “evolutionary” in the history of<br />
utility helicopters.<br />
FOURTH QUARTER 2018 — ASIAN SKY QUARTERLY | 45
Previously developed as X4, a successor to the Eurocopter lineage, the<br />
H160 was later rebranded into H160 to originate the company’s “H”<br />
heredity. With a capacity for up to 12 passengers, a range exceeding 460<br />
NM and a fast cruise speed of 155kts (285 km/h), the aircraft falls into the<br />
medium category joining fellow aircraft, including the Leonardo AW139,<br />
Sikorsky S-76 and Bell 412. To stand out from these competitors, this<br />
ambitious, long-awaited Airbus newcomer entails some groundbreaking<br />
innovations that are set to threaten AW139’s position in the market.<br />
The H160 is engineered to enhance both performance and passenger<br />
comfort. On the top is the five-bladed Blue Edge rotor with hockeystick-shaped<br />
tips. This double-swept shape design effectively reduces<br />
blade-vortex interactions (BVI), thereby mitigating 50% of the noise<br />
generated. These state-of-the-art blades allow an additional useful load<br />
of 100kg per blade, compared to a helicopter equipped with ‘’traditional”<br />
blades. The anti-torque tail rotor — featuring a shrouded Fenestron,<br />
which slants 12 degrees — is the first such design that alone grants the<br />
aircraft 40kg more lift capability.<br />
SPECS<br />
MAIN CHARACTERISTICS<br />
Capacity<br />
Maximum Takeoff Weight (MTOW)<br />
Max Cargo Sling<br />
Fuel Tank<br />
1 or 2 pilots + up to 12 passengers<br />
5,670 kg 12,500 lb<br />
1,600 kg 3,527 lb<br />
1,120 kg 2,470 lb<br />
<strong>EN</strong>GINES<br />
Model<br />
2 x Safran Helicopter ARRANO 1A Engine<br />
PERFORMANC<br />
Takeoff Power - Single Engine<br />
Fast cruise speed<br />
HOGE<br />
Range<br />
899 kW 1,205 shp<br />
285 km/h 155 kts<br />
2,743 m 9,000 ft<br />
850 km 460 nm<br />
46 | ASIAN SKY QUARTERLY — FOURTH QUARTER 2018
UPCOMING AIRCRAFT<br />
These two features, along with the separation of the gearbox from the<br />
main structure, spare the H160 from installing heavy active vibration<br />
control systems and make the model lighter than any other. This world’s<br />
first full carbon composite civil helicopter further maximizes weight<br />
savings by adopting an electrical landing gear and braking systems<br />
(manufactured by Messier-Bugatti-Dowty), making it completely free<br />
from any hydraulic components, thus enabling up to 120NM radius of<br />
action with more than one ton of payload. The dual 1,300-horsepower<br />
Safran Arrano turboshaft engines provide sufficient power output for<br />
such outstanding performance, while using 10 to 15% less fuel burn.<br />
As per the avionics, the H160 will use Airbus Helicopters’ Helionix,<br />
already implemented on the latest H135, H145 and H175. The Helionix<br />
system was tailor-made by and for Airbus helicopters, with four 6in<br />
by 8in (15cm x 20cm) multi-functional displays. Covered by the highvisibility<br />
canopy, pilots now have unimpaired situational awareness,<br />
and in the event of alarming movements, they can simply double-tap<br />
the red button on the yoke to compel the shuddering or jerking aircraft<br />
to revert to a stable, straight up position, thanks to the always-on<br />
autopilot system.<br />
The H160 assures both passengers and pilots the smoothest ride.<br />
Equipped with the novel Biplane horizontal stabilizer under the tail<br />
boom, the H160 not only gains another 40kg payload capability, but also<br />
benefits from superb low-speed stability by diminishing the influence<br />
of the main rotor downwash. There is also a redundant backup for the<br />
gearbox lubrication system as a precaution against primary failure.<br />
The H160 is a multi-mission<br />
helicopter, configurable for<br />
EMS and SAR purposes,<br />
offshore transportation and<br />
VIP transport.<br />
The H160 is a multi-mission helicopter, configurable for EMS and<br />
SAR purposes, offshore transportation and VIP transport. With the<br />
largest cabin in its class along with wide-opening, sliding doors and<br />
roll-in stretcher capacity, the H160 provides ample room ideal for long<br />
distances, critical patient or incubator transport. Useful for SAR and<br />
EMS operations, the H160 offers a hovering out of ground effect that<br />
can be maintained at up to 5,000 feet. Its range reaches 450NM, with<br />
a 20-minute reserve. The H160 also makes the perfect choice to carry<br />
out offshore missions with the ability to ferry up to 12 oil rig crew and to<br />
offer performance class 1 takeoff with a hefty payload capability.<br />
As for VIP services, the ACH160 — the corporate version of the<br />
model — capitalizes on the upgraded noise and vibration reduction<br />
technology and promises a business jet-like passenger experience.<br />
Enabling comfortable seating for eight passengers, the extra-wide<br />
cabin features electric footstep, hinged doors, and is upholstered in<br />
the finest leatherwork with wood and metal accents which complete<br />
the exclusive, sports-car-like supreme interior.<br />
Originally planned to be delivered in 2018, the H160 has undergone a<br />
number of modifications since 2015 when the prototype was unveiled to<br />
the public. It is now expected to attain European certification by the end<br />
of 2019, and to enter into service before May 2020, with its launching<br />
customer UK-based operator Babcock. Orders for the H160 had been<br />
signed in the UK, North America and Brazil by April 2018. In December<br />
2018, the first serial H160 to roll off the brand-new assembly line in<br />
Marignane, France performed a flight demonstration in front of the H160<br />
team in an end-of-the-year celebration of the programme’s achievement.<br />
www.airbus.com/helicopters<br />
FOURTH QUARTER 2018 — ASIAN SKY QUARTERLY | 47
REGISTER FOR THE PREMIER<br />
BUSINESS AVIATION EV<strong>EN</strong>T IN ASIA<br />
Join thousands of top business aviation leaders, entrepreneurs,<br />
and other aircraft-purchase decision makers for the Asian<br />
Business Aviation Conference & Exhibition (ABACE2019)<br />
in Shanghai. Save the date and visit the ABACE website<br />
to learn more.<br />
REGISTER NOW | www.abace.aero<br />
48 | ASIAN SKY QUARTERLY — FOURTH QUARTER 2018
AIRCRAFT POSITIONING - BUSINESS JET<br />
AIRCRAFT ACQUISITION VS. MAX RANGE<br />
CORP. AIRLINER<br />
LONG RANGE<br />
LARGE<br />
MEDIUM<br />
LIGHT<br />
VERY LIGHT<br />
ACJ321 BBJ3<br />
BBJ2<br />
ACJ320<br />
ACJ319<br />
BBJ<br />
ACJ318 G650ER<br />
G650<br />
GLOBAL 6000<br />
G550<br />
LINEAGE 1000E<br />
F8X<br />
GLOBAL 5000<br />
G500<br />
F7X<br />
G450<br />
F900LX<br />
24<br />
23<br />
22<br />
21<br />
20<br />
19<br />
18<br />
17<br />
16<br />
15<br />
14<br />
13<br />
12<br />
11<br />
10<br />
9<br />
8<br />
CIT. M2<br />
CIT. CJ1+<br />
CIT. CJ1<br />
PREMIER 1A<br />
HONDAJET<br />
CIT. XLS+<br />
CIT. XLS<br />
CIT. CJ3+<br />
CIT. SOVEREIGN+<br />
L75<br />
L70<br />
CIT. VII<br />
CIT. CJ4<br />
CIT. EXCEL<br />
CIT. CJ2+ CIT. CJ3<br />
DIAMOND 1A<br />
CIT. <strong>EN</strong>CORE+<br />
LEGACY 500<br />
LEGACY 600<br />
LEGACY 450<br />
CIT. SOVEREIGN<br />
H850XP<br />
NEXTANT 400XTI<br />
CIT. <strong>EN</strong>CORE CIT. ULTRA<br />
BEECHJET 400<br />
CIT. CJ2<br />
H400XP<br />
PH<strong>EN</strong>OM 100E<br />
CL850<br />
CIT. LATITUDE<br />
LEGACY 650<br />
CIT. X+<br />
CIT. X<br />
CL300<br />
H4000<br />
ASTRA SP<br />
CL350<br />
G350<br />
H900XP<br />
H800 H800XP<br />
PH<strong>EN</strong>OM 300<br />
L45XR L60XR<br />
L40XR<br />
G100<br />
CIT. BRAVO<br />
CL605<br />
F50EX<br />
G200<br />
GLOBAL EXPRESS XRS<br />
F2000LXS<br />
CL650<br />
F2000S<br />
GLOBAL EXPRESS<br />
G280<br />
F2000LX<br />
G-IVSP<br />
F900EX EASY<br />
F2000DX F900EX<br />
G-IV<br />
F2000<br />
G300 F2000EX<br />
G150<br />
CL604<br />
G600<br />
G-V<br />
7<br />
6<br />
4<br />
3<br />
2<br />
TOTAL ANNUAL COST (MILLION USD/YEAR)<br />
CIT. MUSTANG<br />
ECLIPSE 550<br />
500<br />
1,000<br />
1,500<br />
2,000<br />
2,500<br />
3,000<br />
3,500<br />
4,000<br />
4,500<br />
5,000<br />
5,500<br />
6,000<br />
6,500<br />
7,000<br />
7,500<br />
8,000<br />
1<br />
MAX RANGE (N.M.)<br />
* The estimated total yearly cost is based on aircraft ownership cost for 10 years including financing, plus annual operating costs and regional adjustments.<br />
Source: Conklin & de Decker 2017<br />
FOURTH QUARTER 2018 — ASIAN SKY QUARTERLY | 49
AIRBUS<br />
0+4+0 0+0+0 4+0 0+0+0 0+5+0 1+0+0 5+0 5+0 0+ 0+0+0 5+0 4+0 0+0+0 5+0 0+0+0 1+0+0 5+0 0+5+0 0+0+0 5+0+<br />
5+0 0+0+0 0+0+0<br />
MARKET SUMMARY -- JETS<br />
ACJ318<br />
Average Asking Price<br />
$30.3<br />
SPECS<br />
$29.3<br />
Max Range<br />
Max Speed<br />
Typ. Passengers<br />
$28.5 FOR SALE<br />
For Sale vs. Sold<br />
No. for Sale<br />
Avg Asking Price<br />
5 5 5 5 5 5 5 5 5 5<br />
Avg Days on Market<br />
4 4<br />
4<br />
1<br />
1<br />
SOLD<br />
Past 12 Months<br />
Dec Mar Jun Sep Dec<br />
2017 2018<br />
Past 3 Months<br />
For Sale Sold<br />
MARKET SUMMARY PER MODEL — BUSINESS JETS<br />
INV<strong>EN</strong>TORY LEVEL, PRICE TR<strong>EN</strong>D & TRANSACTIONS<br />
• There were five Airbus ACJ318s available for sale in Q4 2016, three on-market<br />
and two off-market; unchanged from Q 2018 and representing 25% of<br />
the 20 aircraft in operation. Q4 saw 0 transactions. Average days on market<br />
dropped to 806 days. Current asking prices range from US$33.5M for a 2008<br />
model with 3,150 hours to US$23.5M for a 2009 model with around 3,002 total<br />
hours. Total average asking price of Q4 2018 dropped to US$28.5M.<br />
4,253 N.M. / 7,877 km (with ACTs)<br />
Mach 0.82<br />
19<br />
2018 Q4 2018 Q3<br />
5 (25.0%)<br />
28.5M USD<br />
806<br />
2<br />
0<br />
5 (25.0%)<br />
30.3M USD<br />
1,097<br />
2018 Q4 2018 Q3<br />
2<br />
0<br />
ACJ319<br />
0+14+0 0+0+0 14+0+<br />
14+0 0+0+0 14+0 2+0+0 0+14+0 18+0+0+0 20+0 0+16+0 0+0+0 20+0 0+0+0 0+18+0 0+0+0 20+0 22+0 0+0+0 0+0+0<br />
0+0+0<br />
$39.3<br />
Average Asking Price<br />
For Sale vs. Sold<br />
7 7 7 7 7<br />
1<br />
9<br />
$51.4<br />
$50.8<br />
10 10 10<br />
9 9<br />
8<br />
$49.5<br />
Dec Mar Jun Sep Dec<br />
2017 2018<br />
Sold<br />
For Sale<br />
11<br />
• There were 11 Airbus ACJ319s available for sale in Q4, seven on-market and<br />
four off-market; increasing from nine in Q3 2018 and representing 15.7% of<br />
the total 70 aircraft in service. Q4 saw no transactions. The average days on<br />
market in Q4 2018 was 386, after two aircraft entered the market. Current<br />
asking prices range from US$70M for a 2011 model which entered service<br />
in 2018 to US$18M for a 1999 model with 8,678 total hours. Average asking<br />
price dropped to US$49.5M in Q4.<br />
SPECS<br />
Max Range<br />
Max Speed<br />
Typ. Passengers<br />
FOR SALE<br />
No. for Sale<br />
Avg Asking Price<br />
Avg Days on Market<br />
SOLD<br />
Past 12 Months<br />
Past 3 Months<br />
6,000 N.M. /11,112 km<br />
Mach 0.82<br />
19<br />
2018 Q4<br />
11 (15.7%)<br />
49.5M USD<br />
386<br />
2018 Q4<br />
1<br />
0<br />
2017 Q3<br />
9 (12.9%)<br />
50.8M USD<br />
354<br />
2017 Q3<br />
2<br />
0<br />
50 | ASIAN SKY QUARTERLY — FOURTH QUARTER 2018<br />
Source: JETNET & ASG
MARKET SUMMARY -- JETS<br />
BBJ<br />
• There were 17 BBJs for sale, representing approximately 12.9% of the 132<br />
aircraft in service; increasing from 15 in Q3, with three aircraft entering the<br />
market and one sold. There was one BBJ transaction in Q4; a 1998 model<br />
with an asking price of US$24.95M. Average days on market dropped from<br />
819 days in Q3 to 758 days in Q4. Current asking prices range from US$92.5M<br />
for a 2011 model with only ferry hours to US$19.5M for a 1999 model with<br />
10,115 total hours.<br />
BOEING<br />
SPECS<br />
Max Range<br />
Max Speed<br />
Typ. Passengers<br />
FOR SALE<br />
No. for Sale<br />
Avg Asking Price<br />
Avg Days on Market<br />
6,235 N.M. / 11,547 km (with 9 ACTs)<br />
Mach 0.82<br />
19<br />
2018 Q4 2018 Q3<br />
17(12.9%)<br />
45.6M USD<br />
758<br />
15(11.1%)<br />
39.3M USD<br />
819<br />
2+0+00+0+00+0+03+0+01+0+0 0+0+0 1+0+0+0+0 1+0+00+0+0<br />
$37.3<br />
Average Asking Price<br />
$33.8<br />
For Sale vs. Sold<br />
$39.3<br />
$45.6<br />
18 18 18 18 17 18<br />
16 16 16 17<br />
15 15 15<br />
0+16+0 0+15+0 0+15+0 0+16+00+18+00+17+0<br />
0+18+0 0+18+0 0+18+0<br />
0+17+0<br />
SOLD<br />
2018 Q4 2018 Q3<br />
2 3<br />
1 1 1<br />
Past 12 Months<br />
Past 3 Months<br />
6<br />
1<br />
7<br />
1<br />
Dec Mar Jun Sep Dec<br />
2017 2018<br />
Sold<br />
For Sale<br />
BBJ2<br />
• There were four on-market BBJ2s for sale in Q4, representing 17.4% of the<br />
22 BBJ2s in operation; of which over 50% are based in the Middle East and<br />
22% are based in Asia. There were no transactions in Q4 and only one transaction<br />
in the past 12 months. The average asking price remained unchanged<br />
from Q3, at US$58M.<br />
SPECS<br />
Max Range<br />
Max Speed<br />
Typ. Passengers<br />
FOR SALE<br />
No. for Sale<br />
Avg Asking Price<br />
Avg Days on Market<br />
5,620 N.M. / 10,408 km (with 7 ACTs)<br />
Mach 0.82<br />
19<br />
2018 Q4<br />
4 (17.4%)<br />
58.0M USD<br />
778<br />
2018 Q3<br />
4 (18.2%)<br />
58.0M USD<br />
687<br />
0+16+0+16+0 0+0+0 0+0+0 0+16+0 0+0+0 0+16+0 0+20+0 4+0+0 0+16+0+0+0 0+0+0 0+16+0+16+0+16+0 0+0+0 0+0+0 0+16+0+0+0<br />
$69.0<br />
Average Asking Price<br />
For Sale vs. Sold<br />
$58.0<br />
5<br />
4 4 4 4 4 4 4 4 4 4 4 4<br />
$58.0<br />
SOLD<br />
Past 12 Months<br />
Past 3 Months<br />
2018 Q4<br />
1<br />
0<br />
2018 Q3<br />
1<br />
0<br />
1<br />
Dec Mar Jun Sep Dec<br />
2017 2018<br />
Sold<br />
For Sale<br />
Source: JETNET & ASG<br />
FOURTH QUARTER 2018 — ASIAN SKY QUARTERLY | 51
MARKET SUMMARY -- JETS<br />
CHALL<strong>EN</strong>GER 604/605<br />
BOMBARDIER<br />
$12.6<br />
0+50+0<br />
7+0+0<br />
50 52<br />
49 47<br />
9<br />
$12.7<br />
CL605<br />
$5.1<br />
CL604<br />
36<br />
39<br />
34<br />
30 28 28 29<br />
23 23<br />
8+0+09+0+0<br />
5+0+08+0+0 13+0+0 7+0+02+0+08+0+0<br />
3+0+07+0+08+0+0<br />
0+34+00+23+00+23+0<br />
0+29+00+28+00+28+0<br />
0+30+00+39+00+36+0<br />
0+47+00+49+00+52+0<br />
3+0+0<br />
7 8 7<br />
13<br />
8 7 8 9 8<br />
3 5<br />
2<br />
3<br />
10<br />
10<br />
10<br />
11 12 11 11<br />
0+10+0 0+10+0 0+10+0<br />
1+0+0 1+0+0 0+8+0 9+0 0+0+0<br />
0+0+0 0+0+0 0+0+0<br />
0+0+0 0+0+0 1+0+0<br />
11+0 0+11+0 0+12+0 0+11+0<br />
2+0+0<br />
1+0+00+0+0<br />
0+6+0 0+6+0 0+6+0 0+0+0<br />
0+9+0<br />
2<br />
52 | ASIAN SKY QUARTERLY — FOURTH QUARTER 2018<br />
9<br />
$12.3<br />
8<br />
$11.3<br />
$4.9<br />
$5.2<br />
$11.0<br />
$5.1<br />
CHALL<strong>EN</strong>GER 850<br />
$7.2<br />
Average Asking Price<br />
• There were 20 Challenger 604s on the market in Q4 2018, increasing 5%<br />
from Q3 2018; representing 5.6% of the entire 360 fleet in operation. By the<br />
end of Q4, average days on market dropped 24% from Q3; 313 to 238, attributed<br />
to nine aircraft being introduced to the market. The average asking price<br />
has rose from US$5.2M (Q3) to US$5.4M (Q4) Of the 59 transactions executed<br />
over the past 12 months – 11 took place in Q4. This accounts for a smaller<br />
proportion compared with transactions completed in Q3 and the 12 months<br />
prior to Q3, 15 and 58 respectively.<br />
• There were 14 pre-owned Challenger 605s on the market in Q4, increasing<br />
40% compared with the previous quarter; representing 4.9% of the entire<br />
fleet of 286 Challenger 605s in operation. By the end of Q4, average days on<br />
market had fallen significantly; 76% from Q3 — 429 to 105. This is attributed<br />
to the sale of a 2007 Challenger 605, sold after being listed for over three<br />
years. Average asking prices fell from US$12.4M (Q3) to US$11.6M (Q4). Of<br />
the 45 transactions executed over the past 12 months nine took place in Q4,<br />
down from 14 in Q3 and 12 months prior to Q3, 14 and 45 respectively.<br />
For Sale vs. Sold<br />
SPECS<br />
Max Range<br />
Max Speed<br />
Typ. Passengers<br />
FOR SALE<br />
No. for Sale<br />
Avg Asking Price<br />
Avg Days on Market<br />
CL604<br />
4,027 N.M. / 7,458 km<br />
Mach 0.82<br />
9<br />
2018 Q4 2018 Q3<br />
20 (5.6%)<br />
5.1M USD<br />
238<br />
19 (5.3%)<br />
5.2M USD<br />
313<br />
CL605<br />
4,000 N.M. / 7,408 km<br />
Mach 0.82<br />
9<br />
2018 Q4<br />
14 (3.5%)<br />
11.3M USD 12.3M USD<br />
105<br />
2018 Q3<br />
10 (3.5%)<br />
429<br />
Dec Mar Jun Sep Dec<br />
2017 2018<br />
For Sale Sold<br />
SOLD<br />
Past 12 Months<br />
Past 3 Months<br />
2018 Q4 2018 Q3<br />
59 58<br />
11<br />
15<br />
2018 Q4<br />
45<br />
9<br />
2018 Q3<br />
45<br />
14<br />
Average Asking Price<br />
For Sale vs. Sold<br />
$8.6 $8.6<br />
• There were six pre-owned Challenger 850s on the market in Q4 2018,<br />
decreasing 25% from Q3. The number of aircraft for sale represents 8.5% of<br />
all 71 850s in operation.<br />
• There was one sold transaction in Q4 2018 (on market for 250 days); a<br />
decrease of 50% from the two sold transactions in Q3 2018.<br />
• The average days on market for a Challenger 850 has increased to 757 days<br />
in Q4 2018 from 599 days in Q3 2018, an increase of 26.4%. Younger models<br />
with lower days on market are more attractive to buyers, while aircraft with<br />
higher days on market experience less movement.<br />
• Average asking price rose from US$8.5M in Q3 2018 to US$8.6M Q4 2018.<br />
SPECS<br />
Max Range<br />
Max Speed<br />
Typ. Passengers<br />
FOR SALE<br />
No. for Sale<br />
Avg Asking Price<br />
Avg Days on Market<br />
2,811 N.M. / 5,206 km<br />
Mach 0.80<br />
14<br />
2018 Q4<br />
6 (8.5%)<br />
8.6M USD<br />
757<br />
2018 Q3<br />
8 (11.3 %)<br />
8.6M USD<br />
599<br />
6 6 6<br />
1 1 1<br />
1<br />
Dec Mar Jun Sep Dec<br />
2017 2018<br />
Sold<br />
For Sale<br />
SOLD<br />
Past 12 Months<br />
Past 3 Months<br />
2018 Q4<br />
4<br />
1<br />
2018 Q3<br />
5<br />
2<br />
Source: JETNET & ASG
MARKET SUMMARY -- JETS<br />
GLOBAL 5000<br />
• There were 23 pre-owned Global 5000s on the market in Q4, increasing 35%<br />
compared with the previous quarter; representing 10.3% of the 223 in operation.<br />
Between Q3 and Q4, the average days on market dropped 35%, from 286<br />
to 185. This is attributed to the addition of 10 Global 5000s on the market –<br />
accounting for just under 50% of the 23 Global 5000s for sale. Average asking<br />
price rose from US$15.7M (Q3) to US$17.1M (Q4). More than half the aircraft<br />
listed for sale indicate ‘Make Offer’, implying that sellers may find it hard to<br />
gauge the current market conditions. Still, of the 24 transactions over the<br />
past 12 months, seven took place in Q4.<br />
SPECS<br />
Max Range<br />
Max Speed<br />
Typ. Passengers<br />
FOR SALE<br />
No. for Sale<br />
Avg Asking Price<br />
Avg Days on Market<br />
5,200 N.M. / 9,630 km<br />
Mach 0.89<br />
13<br />
2018 Q4<br />
23 (10.3%)<br />
18.3M USD<br />
185<br />
2018 Q3<br />
17 (7.7%)<br />
14.3M USD<br />
286<br />
$17.8<br />
16<br />
1<br />
18<br />
Average Asking Price<br />
3+0+0 1+0+0 3+0+0<br />
$13.9<br />
For Sale vs. Sold<br />
$15.4<br />
0+14+0 0+15+0 0+18+0<br />
0+14+0 0+14+0 0+13+0<br />
2+0+0 2+0+0 4+0+0<br />
0+17+0 0+14+0 0+14+0<br />
1+0+0 0+0+0 1+0+0<br />
$18.3<br />
BOMBARDIER<br />
4+0+01+0+0<br />
0+0+01+0+00+0+0<br />
0+8+00+7+00+9+0<br />
0+10+00+11+00+12+0<br />
0+0+0<br />
0+0+0<br />
0+10+0<br />
3+0+02+0+0<br />
0+23+00+20+00+15+0<br />
2+0+0<br />
1+0+0<br />
0+16+0<br />
17<br />
15 14 15<br />
13 14 14 14 14<br />
20<br />
23<br />
SOLD<br />
Past 12 Months<br />
Past 3 Months<br />
2018 Q4<br />
24<br />
7<br />
2018 Q3<br />
22<br />
2<br />
3 3<br />
1<br />
3 4<br />
2 2 1 1 2 2<br />
Dec Mar Jun Sep Dec<br />
2017 2018<br />
Sold<br />
For Sale<br />
GLOBAL 6000<br />
• There were eight pre-owned Global 6000s on the market in Q4, decreasing<br />
20% compared with the previous quarter; representing 2.8% of the 282 in<br />
operation. Between Q3 and Q4, the average days on market increased by<br />
24%, from 275 to 340. The average asking price rose from US$37.1M (Q3) to<br />
US$37.5M (Q4), with five transactions taking place in Q4.<br />
SPECS<br />
Max Range<br />
Max Speed<br />
Typ. Passengers<br />
FOR SALE<br />
No. for Sale<br />
Avg Asking Price<br />
Avg Days on Market<br />
6,000 N.M. / 11,112 km<br />
Mach 0.88<br />
13<br />
2018 Q4 2018 Q3<br />
8 (2.8%) 10 (3.6%)<br />
38.3M USD 38.1M USD<br />
340 275<br />
$29.8<br />
$36.3<br />
0+0+0 1+0+00+0+00+0+0<br />
0+14+00+15+00+16+0<br />
0+15+0 0+15+00+10+0<br />
0+0+0<br />
SOLD<br />
Past 12 Months<br />
Past 3 Months<br />
$38<br />
Average Asking Price<br />
For Sale vs. Sold<br />
15 15<br />
16<br />
15<br />
14<br />
$37.0<br />
$38.3<br />
2018 Q4<br />
17<br />
5<br />
2018 Q3<br />
14<br />
3<br />
12<br />
10 10 11 10 9<br />
1<br />
1 1 1<br />
7<br />
4<br />
Dec Mar Jun Sep Dec<br />
2017 2018<br />
Sold<br />
For Sale<br />
8<br />
Source: JETNET & ASG<br />
FOURTH QUARTER 2018 — ASIAN SKY QUARTERLY | 53
MARKET SUMMARY -- JETS<br />
FALCON 900DX/EX/EX EASy/LX<br />
Average Asking Price<br />
• There were 19 Falcon 900EX/EX EASy/DX aircraft for sale in Q4 2018, decreasing<br />
by 17.4% from Q3. There were 12 Falcon 900EX/EX EASy/LX transactions in Q4,<br />
a dramatic increase in sales activity compared with Q3, which had only two sold<br />
transactions. The Falcon 900DX pre-owned market was stagnant in both Q4 and<br />
Q3 with zero transactions completed over the six-month period. Average days on<br />
market for a Falcon 900DX, Falcon 900EX and Falcon 900EX EASy increased by<br />
13.1%, 5.4% and 2.2%, respectively. The average asking price for a Falcon 900DX,<br />
Falcon 900EX and Falcon 900EX EASy in Q4 was around US$12.9M, US$7.2M and<br />
US$15.9M, respectively.<br />
DASSAULT<br />
0+24+00+25+0+26+0 0+26+0+23+0 0+24+0 0+24+0 0+24+0 0+22+0+23+0<br />
0+21+00+19+0<br />
$21.0<br />
$18.3<br />
$11.5<br />
$6.3<br />
F900LX<br />
F900EX EASy<br />
F900DX<br />
F900EX<br />
For Sale vs. Sold<br />
$22.2<br />
2+0+0<br />
0+0+0 1+0+0 2+0+0<br />
$12.9<br />
$18.5 $18.5<br />
$16.4<br />
$7.0 $7.2<br />
26 26 26<br />
24 25<br />
24 23 24 24 23 22 21<br />
$15.9<br />
$12.9 $12.9<br />
19<br />
SPECS<br />
Max Range<br />
6+0+0 2+0+00+0+00+0+0<br />
4+0+06+0+03+0+0<br />
4+0+0<br />
Max Speed<br />
Typ. Passengers<br />
FOR SALE<br />
No. for Sale<br />
Avg Asking Price<br />
Avg Days on Market<br />
F900DX<br />
4,100 N.M. / 4,500 N.M. / 4,500 N.M. / 4,750 N.M. /<br />
7,593 km 8,334 km 8,334 km 8,800 km<br />
Mach 0.83<br />
12<br />
Reporting quarter vs. Previous quarter<br />
Q4 | Q3<br />
3 | 2<br />
12.9M USD |<br />
12.9M USD<br />
173 | 153<br />
F900EX<br />
Mach 0.83<br />
12<br />
Q4 | Q3<br />
7 | 10<br />
7.2M USD |<br />
7.0M USD<br />
354 | 336<br />
F900EX EASy<br />
Mach 0.83<br />
12<br />
Q4 | Q3<br />
9 | 10<br />
15.9M USD |<br />
16.4M USD<br />
326 | 319<br />
F900LX<br />
Mach 0.83<br />
12<br />
Q4 | Q3<br />
0 | 1<br />
18.5M USD |<br />
18.5M USD<br />
0 | 250<br />
6 6<br />
4 4<br />
2 2 3<br />
1<br />
2 2<br />
Dec Mar Jun Sep Dec<br />
2017 2018<br />
Sold<br />
For Sale<br />
SOLD<br />
Past 12 Months<br />
Past 3 Months<br />
Reporting quarter vs. Previous quarter<br />
Q4 | Q3<br />
1 | 1<br />
0 | 0<br />
Q4 | Q3<br />
12 | 14<br />
3| 1<br />
Q4 | Q3<br />
12 | 5<br />
7 | 1<br />
Q4 | Q3<br />
5 | 5<br />
2 | 0<br />
FALCON 2000LX/LXS/S<br />
$27.9<br />
$19.0<br />
$13.4<br />
Average Asking Price<br />
For Sale vs. Sold<br />
$25.0<br />
FALCON 2000LXS<br />
FALCON 2000S<br />
FALCON 2000LX<br />
$17.5<br />
$16.5<br />
$14.5<br />
10 11 10<br />
8<br />
9 9<br />
7 8 7 7 8<br />
5 6<br />
4<br />
1 1 1 2 1 1 1 2<br />
$25.0<br />
$16.0<br />
$15.3<br />
Dec Mar Jun Sep Dec<br />
2017 2018<br />
Sold<br />
For Sale<br />
4+0+0 0+0+02+0+01+0+0<br />
0+0+01+0+01+0+0<br />
0+8+00+7+00+7+0<br />
0+6+00+5+00+8+0<br />
0+7+00+9+00+9+0<br />
0+0+0<br />
2+0+0 1+0+0 1+0+0 1+0+0<br />
• There were eight Falcon 2000LX/LXS/S aircraft for sale in Q4 2018, increasing by<br />
33.3% since Q3 2018. There were four Falcon 2000LX/LXS/S transactions in Q4,<br />
compared with three transactions in Q3. Average days on market for a Falcon<br />
2000LX, Falcon 2000LXS and Falcon 2000S decreased by 20.7%, 17.8% and 29.6%,<br />
respectively. The average asking price for a Falcon 2000LX, Falcon 2000LXS and<br />
Falcon 2000S in Q4 was around US$15.3M, US$25M and US$16M, respectively.<br />
SPECS<br />
Max Range<br />
Max Speed<br />
Typ. Passengers<br />
FOR SALE<br />
No. for sale<br />
Avg Asking Price<br />
Avg Days on Market<br />
SOLD<br />
Past 12 Months<br />
Past 3 Months<br />
2000LX<br />
4,000 N.M. /<br />
Mach 0.83<br />
10<br />
Reporting quarter vs. Previous quarter<br />
Q4 | Q3<br />
2 | 3<br />
15.3M USD |<br />
14.5M USD<br />
169 | 213<br />
Reporting quarter vs. Previous quarter<br />
Q4 | Q3<br />
Q4 | Q3<br />
6 | 11<br />
1 | 1<br />
2000LXS<br />
4,000 N.M. /<br />
Q4 | Q3<br />
2 | 2<br />
25.0M USD |<br />
25.0M USD<br />
37 | 45<br />
4 | 3<br />
1 | 1<br />
2000S<br />
3,350 N.M. /<br />
7,408 km 7,408 km 6,208 km<br />
Mach 0.83<br />
10<br />
Mach 0.83<br />
10<br />
Q4 | Q3<br />
2 | 2<br />
16.0M USD |<br />
16.5M USD<br />
117 | 243<br />
Q4 | Q3<br />
3 | 1<br />
2 | 1<br />
0+10+0 0+11+0 0+10+0 0+8+0<br />
Source: JETNET & ASG<br />
54 | ASIAN SKY QUARTERLY — FOURTH QUARTER 2018
MARKET SUMMARY -- JETS<br />
FALCON 7X<br />
• There were 11 Falcon 7X aircraft for sale in Q4 2018, decreasing by 50% since<br />
Q3 2018. There were six Falcon 7X transactions in Q4. The pre-owned market<br />
activity has been consistent with 12 aircraft sold in both halves of the year.<br />
Average days on market for a Falcon 7X have increased by 6.7% — from 255<br />
in Q3 to Q4. The average asking price for a Falcon 7X in Q4 2018 was around<br />
US$23.3M, a decrease of 10% from Q3.<br />
SPECS<br />
Max Range<br />
Max Speed<br />
Typ. Passengers<br />
FOR SALE<br />
No. for Sale<br />
Avg Asking Price<br />
Avg Days on Market<br />
5,950 N.M. / 11,018 km<br />
Mach 0.90<br />
12<br />
2018 Q4<br />
11 (3.9%)<br />
23.3M USD<br />
272<br />
2018 Q3<br />
22 (7.9%)<br />
25.9M USD<br />
255<br />
$26.6<br />
25 24 25<br />
Average Asking Price<br />
For Sale vs. Sold<br />
$26.9<br />
22 23<br />
21 21 21 22<br />
19<br />
$25.9<br />
2+0+03+0+0<br />
0+0+01+0+03+0+0<br />
2+0+0 2+0+04+0+0<br />
0+22+00+21+00+21+0<br />
0+23+00+21+00+19+0<br />
0+22+00+25+00+24+0<br />
1+0+0<br />
$20.9<br />
$23.3<br />
DASSAULT<br />
1+0+02+0+0<br />
0+11+00+8+00+11+0<br />
3+0+0<br />
0+25+0 1+0+0<br />
SOLD<br />
Past 12 Months<br />
Past 3 Months<br />
2018 Q4<br />
24<br />
6<br />
2018 Q3<br />
25<br />
6<br />
11 11<br />
8<br />
4<br />
2 2 3 3 2 2 3<br />
1 1<br />
1 1<br />
Dec Mar Jun Sep Dec<br />
2017 2018<br />
Sold<br />
For Sale<br />
Source: JETNET & ASG<br />
FOURTH QUARTER 2018 — ASIAN SKY QUARTERLY | 55
MARKET SUMMARY -- JETS<br />
LINEAGE 1000/E<br />
• There were six Lineage 1000/1000E aircraft on market in Q4 2018, unchanged<br />
from Q3 2018. The Lineage 1000/1000E market has remained stagnant over<br />
the last six months with zero transactions completed since Q2. The average<br />
age of the aircraft for sale was seven years in Q4, representing an older<br />
market compared with Q3, which had an average age of five years. Average<br />
days on market for a Lineage 1000/1000E has increased to 627 days in Q4<br />
from 623 days in Q3. The average asking price for a Lineage 1000 in Q4 was<br />
around US$22.5M, decreasing 26.7% from US$30.7M in Q3. The decrease in<br />
the prices can be attributed to the average age of the aircraft on the market<br />
gradually increasing since the end of Q3.<br />
8<br />
7 7 7<br />
EMBRAER<br />
$27.4<br />
7<br />
Average Asking Price<br />
For Sale vs. Sold<br />
1<br />
4<br />
$30.7<br />
0+21+0 0+24+0 0+21+0<br />
0+15+0 0+12+0 0+21+0<br />
6 6 6<br />
5 5<br />
6 6<br />
Dec Mar Jun Sep Dec<br />
$22.5<br />
2017 2018<br />
For Sale Sold<br />
SPECS<br />
Max Range<br />
Max Speed<br />
Typ. Passengers<br />
FOR SALE<br />
No. for Sale<br />
Avg Asking Price<br />
Avg Days on Market<br />
Lineage 1000<br />
4,400 N.M. / 8,149 km<br />
Mach 0.82<br />
19<br />
2018 Q4<br />
6 (20.7%)<br />
32.5M USD<br />
627<br />
2018 Q3<br />
6 (20.7%)<br />
30.7M USD<br />
623<br />
Lineage 1000E<br />
4,600 N.M. / 8,520 km<br />
Mach 0.82<br />
19<br />
0+0+0 0+0+0 0+0+0 0+0+0 0+0+0 0+0+0 0+0+0 0+0+0 0+0+0 0+<br />
0+ 15+0 0+18+0 0+18+0 0+18+0 0+18+0<br />
0+0+0 3+0+0 0+0+0<br />
0+21+0<br />
SOLD<br />
Past 12 Months<br />
Past 3 Months<br />
2018 Q4<br />
1<br />
0<br />
2018 Q3<br />
1<br />
0<br />
LEGACY 600/650<br />
• There were 18 Legacy 600/650 aircraft for sale in Q4 2018, decreasing by 10%<br />
from Q3 2018. There were 11 Legacy 600 aircraft sold in Q4, an increase compared<br />
with Q3, which had only one Legacy 600 transaction. The Legacy 650 pre-owned<br />
market was stagnant in both Q4 and Q3 with zero transactions completed over the<br />
six-month period. Average days on market for a Legacy 600 decreased to 377 days<br />
in Q4 from 470 days in Q3 — around 19.8%. Average days on market for a Legacy<br />
650 increased to 174 days in Q4 from 136 days in Q3 — around 27.9 %. The average<br />
asking price for a Legacy 600 and Legacy 650 in Q4 was US$6.6M and US$13.4M,<br />
respectively.<br />
$12.0<br />
Average Asking Price<br />
$7.1<br />
22 22<br />
5<br />
5+0+0<br />
24<br />
1<br />
$11.5<br />
Legacy 650<br />
$12.8<br />
$13.4<br />
0+22+0+22+0<br />
For Sale vs. Sold<br />
Legacy 600<br />
2+0+0 1+0+0 0+0+0<br />
$7.3<br />
$6.2<br />
20 20 20 19 18<br />
15 15<br />
17 17<br />
15<br />
4<br />
6 6<br />
2 1 2<br />
$6.6<br />
Dec Mar Jun Sep Dec<br />
2017 2018<br />
For Sale Sold<br />
3<br />
2+0+06+0+0<br />
0+0+0 0+0+01+0+0<br />
0+0+06+0+04+0+0<br />
0+18+00+19+00+15+0<br />
0+20+0 0+20+0 0+17+00+15+00+15+0<br />
0+20+00+24+0<br />
3+0+0<br />
SPECS<br />
Max Range<br />
Max Speed<br />
Typ. Passengers<br />
FOR SALE<br />
No. for Sale<br />
Avg Asking Price<br />
Avg Days on Market<br />
SOLD<br />
Past 12 Months<br />
Past 3 Months<br />
Legacy 600<br />
3,400 N.M. / 6,297 km<br />
Mach 0.80<br />
13<br />
2018 Q4 2018 Q3<br />
10 (5.7%) 14 (8.0%)<br />
6.6M USD 7.3M USD<br />
377 470<br />
2018 Q4 2018 Q3<br />
18<br />
11<br />
15<br />
1<br />
Legacy 650<br />
3,640 N.M. / 7,112 km<br />
Mach 0.80<br />
13<br />
2018 Q4 2018 Q3<br />
8 (8.2%) 6 (6.3%)<br />
13.4M USD 12.8M USD<br />
174 136<br />
2018 Q4 2018 Q3<br />
7 8<br />
0 0<br />
Source: JETNET & ASG<br />
56 | ASIAN SKY QUARTERLY — FOURTH QUARTER 2018
MARKET SUMMARY -- JETS<br />
G200 & G280<br />
• There were 32 G200/G280 aircraft on market in Q4 2018, increasing by 39.1% from Q3<br />
2018. There were seven G200 and no G280 transactions in Q4. With a total of seven<br />
G200/G280 transactions, the pre-owned market saw a decrease in sales activity by<br />
36.4% compared with 11 G200/G280 transactions in Q3. Average days on market for<br />
a G200, decreased by 58.6% to 150 days in Q4 from 362 days in Q3. Average days on<br />
market for a G280 decreased around 8%, to 46 days in Q4 from 50 days in Q3. The<br />
average asking price for a G200 and G280 aircraft in Q4 was around US$4.5M and<br />
US$16.8M, respectively.<br />
SPECS<br />
Max Range<br />
Max Speed<br />
Typ. Passengers<br />
FOR SALE<br />
No. for Sale<br />
Avg Asking Price<br />
Avg Days on Market<br />
SOLD<br />
Past 12 Months<br />
Past 3 Months<br />
G200<br />
3,050 N.M. / 5,651km<br />
Mach 0.81<br />
8<br />
2018 Q4 2018 Q3<br />
29 (7.7%)<br />
4.5M USD<br />
150<br />
2018 Q4 2018 Q3<br />
36 36<br />
7<br />
21 (8.5%)<br />
4.5M USD<br />
362<br />
11<br />
G280<br />
3,600 N.M. / 6,667 km<br />
Mach 0.84<br />
8<br />
2018 Q4<br />
3 (2.0%)<br />
16.8M USD 17.0M USD<br />
46<br />
2018 Q4<br />
4<br />
0<br />
2018 Q3<br />
1 (0.7%)<br />
50<br />
2018 Q3<br />
4<br />
0<br />
$16.0<br />
$4.9<br />
34<br />
Average Asking Price<br />
$12.5<br />
For Sale vs. Sold<br />
40<br />
33 34<br />
G280<br />
G200<br />
6 5 6<br />
1 1 2 2<br />
$18.3<br />
$17.0<br />
$16.8<br />
$4.5 $3.7 $4.5<br />
32 32 32<br />
30<br />
21 22 21<br />
20<br />
25<br />
4<br />
2 2 3 2<br />
Dec Mar Jun Sep Dec<br />
2017 2018<br />
Sold<br />
For Sale<br />
5<br />
3+0+02+0+0<br />
4+0+02+0+05+0+0<br />
6+0+02+0+05+0+0<br />
2+0+01+0+06+0+0<br />
0+32+00+25+00+20+0<br />
0+21+00+22+00+21+0<br />
0+30+00+32+00+32+0<br />
0+34+00+40+00+33+0<br />
2+0+0<br />
G450<br />
• There were 20 G450 aircraft on market in Q4 2018, decreasing 9.1% from<br />
Q3 2018. There were 14 transactions in Q4, compared with eight in Q3 —<br />
an increase of 75% in sales activity. Average days on market for a G450<br />
decreased 12.9% — down to 269 days in Q4 from 309 days in Q3. The average<br />
asking price for a G450 in Q4 was around US$16.3M, increasing 16.4% from<br />
US$14M from Q3. Additionally, the average age of the aircraft on the market<br />
has been gradually decreasing since the end of Q3, with younger G450 models<br />
entering the market.<br />
GULFSTREAM<br />
SPECS<br />
Max Range<br />
Max Speed<br />
Typ. Passengers<br />
FOR SALE<br />
No. for Sale<br />
Avg Asking Price<br />
Avg Days on Market<br />
4,350 N.M. / 8,056 km<br />
Mach 0.85<br />
13<br />
2018 Q4 2018 Q3<br />
20 (6.2%)<br />
16.3M USD 14.0M USD<br />
269<br />
22 (6.2%)<br />
309<br />
$13.8<br />
24<br />
27<br />
Average Asking Price<br />
$15.2<br />
For Sale vs. Sold<br />
21 21 21 21<br />
4+0+0 3+0+04+0+02+0+0<br />
0+26+00+21+0 0+21+0 0+21+00+28+0<br />
0+24+0 2+0+0<br />
23 23 22 22<br />
19 20<br />
4+0+0 4+0+0 0+20+00+22+00+19+0<br />
6+0+0<br />
SOLD<br />
Past 12 Months<br />
Past 3 Months<br />
2018 Q4 2018 Q3<br />
41<br />
14<br />
33<br />
8<br />
3 4 4 4 4 4<br />
2 3<br />
2 3 2 3<br />
26<br />
$15.0<br />
$14.0<br />
$16.3<br />
Dec Mar Jun Sep Dec<br />
2017 2018<br />
Sold<br />
For Sale<br />
6<br />
2+0+03+0+0<br />
0+22+00+23+00+23+0<br />
3+0+0<br />
Source: JETNET & ASG<br />
FOURTH QUARTER 2018 — ASIAN SKY QUARTERLY | 57
MARKET SUMMARY -- JETS<br />
G550<br />
• There were 28 G550s on market in Q4 2018, increasing by 7.7% from Q3 2018.<br />
There were eight G550 transactions in Q4, decreasing 27.3% from the 11 sold<br />
in Q3. The average age of aircraft sold in Q4 was six years old. Average days<br />
on market for a G550 increased 9.7% — 181 days in Q4 from 165 days in Q3.<br />
The average asking price for a G550 in Q4 was around US$26.5M - a decrease<br />
of 9.2% from US$29.2M in Q3, attributed to the average age of aircraft for sale<br />
gradually increasing since the end of Q3, with younger models being sold and<br />
older models remaining on market.<br />
$23.9<br />
$22.8<br />
Average Asking Price<br />
For Sale vs. Sold<br />
$29.2<br />
29<br />
27 27 28<br />
26<br />
24 24 24<br />
24<br />
22 21<br />
19<br />
17<br />
0+28+0 0+27+0 0+24+0<br />
$26.5<br />
SPECS<br />
Max Range<br />
Max Speed<br />
Typ. Passengers<br />
FOR SALE<br />
No. for Sale<br />
Avg Asking Price<br />
Avg Days on Market<br />
6,750 N.M. / 12,501 km<br />
Mach 0.87<br />
18<br />
2018 Q4 2018 Q3<br />
28 (5.0%)<br />
26.5M USD 29.2M USD<br />
181<br />
26 (4.7%)<br />
165<br />
1+0+0 3+0+0 4+0+0<br />
4 4 4 4 5<br />
2 3 3 3<br />
4<br />
2<br />
3<br />
Dec Mar Jun Sep Dec<br />
2017 2018<br />
Sold<br />
For Sale<br />
1<br />
SOLD<br />
Past 12 Months<br />
Past 3 Months<br />
2018 Q4 2018 Q3<br />
38<br />
8<br />
44<br />
11<br />
GULFSTREAM<br />
0+24+0<br />
4+0+0<br />
G650 & G650 ER<br />
0+19+0 0+17+0 0+22+0<br />
4+0+0 2+0+0 2+0+0<br />
5+0+0 3+0+04+0+04+0+0<br />
0+26+00+27+00+24+0<br />
0+29+00+24+00+21+0<br />
3+0+0<br />
• There were 12 G650/650ER aircraft on market in Q4 2018, decreasing 20%<br />
from Q3 2018. Additionally, there was a 7.2% fleet increase of aircraft in operation,<br />
from 205 G650s and 102 G650ERs in Q3 to 220 G650s and 109 G650ERs<br />
in Q4. There were two G650 and three G650ER transactions in Q4. The overall<br />
650/650ER pre-owned market saw a decrease in sales activity by 28.6% compared<br />
with Q3. Average days on market for a G650 and G650ER in Q4 was 199<br />
and 163, respectively; a 15.7% from 236 days for a G650 and an increase of<br />
29.4% from 126 days for G650ER in Q3. Average asking prices for a G650 and<br />
G650ER were around US$52.4M and US$61.9M, respectively.<br />
$65.2<br />
$56.6<br />
17<br />
Average Asking Price<br />
0+17+0<br />
1+0+0<br />
0+12+0 0+12+0 0+15+0<br />
3+0+0 2+0+0 2+0+0<br />
$58.2<br />
For Sale vs. Sold<br />
$55.1<br />
$53.4<br />
$51.7<br />
$61.9<br />
$55.1<br />
$52.4<br />
20<br />
18<br />
15 16 16<br />
15<br />
12 12 13<br />
14<br />
11<br />
12<br />
1+0+0 1+0+0 2+0+03+0+0 2+0+0 2+0+00+0+0<br />
0+12+00+14+00+18+0<br />
0+15+00+11+00+13+0<br />
0+16+00+20+00+16+0<br />
3+0+0<br />
SPECS<br />
Max Range<br />
Max Speed<br />
Typ. Passengers<br />
FOR SALE<br />
No. for Sale<br />
Avg Asking Price<br />
Avg Days on Market<br />
G650<br />
7,000 N.M. / 12,964 km<br />
Mach 0.90<br />
18<br />
2018 Q4 2018 Q3<br />
8 (3.6%)<br />
61.9M USD 55.1M USD<br />
199<br />
9 (4.4%)<br />
236<br />
G650ER<br />
7,500 N.M. / 13,890 km<br />
Mach 0.90<br />
18<br />
2018 Q4<br />
4 (3.7%)<br />
52.4M USD<br />
163<br />
2018 Q3<br />
6 (5.9%)<br />
56.0M USD<br />
126<br />
2 2 3 2 2 2 3 2<br />
3<br />
1 1 1<br />
Dec Mar Jun Sep Dec<br />
2017 2018<br />
Sold<br />
For Sale<br />
SOLD<br />
Past 12 Months<br />
Past 3 Months<br />
2018 Q4 2018 Q3<br />
14<br />
2<br />
17<br />
4<br />
2018 Q4<br />
9<br />
3<br />
2018 Q3<br />
6<br />
3<br />
Source: JETNET & ASG<br />
58 | ASIAN SKY QUARTERLY — FOURTH QUARTER 2018
AIRCRAFT POSITIONING - CIVIL HELICOPTERS<br />
AIRCRAFT ACQUISITION VS. MAX RANGE<br />
8.00<br />
HEAVY<br />
(SUPER) MEDIUM<br />
LIGHT TWIN<br />
SINGLE TURBINE<br />
PISTON<br />
AC313*<br />
S-92<br />
H225<br />
AS332 L1E<br />
4.00<br />
AW189<br />
H175<br />
BELL 412EPI<br />
AW139<br />
S-76C++<br />
S-76D<br />
H155<br />
AC312*<br />
MD 520N<br />
MD 530F<br />
H145<br />
MD 902<br />
H135(T3)<br />
H130<br />
BELL 407<br />
BELL 206L4<br />
MD 500E<br />
BELL 430<br />
AW169<br />
BELL 429<br />
H135(P3)<br />
BELL 407GXP<br />
H125<br />
AC311*<br />
H120<br />
MD 600N<br />
EC145<br />
AW 109 GN<br />
AW109 POWER<br />
AW119KX<br />
2.00<br />
1.00<br />
AIRCRAFT ACQUISITION PRICE (MILLION USD)<br />
S-333<br />
0.50<br />
0.25<br />
200<br />
250<br />
300<br />
350<br />
400<br />
450<br />
500<br />
550<br />
600<br />
650<br />
700<br />
750<br />
<strong>EN</strong>480B<br />
R66<br />
R44 RAV<strong>EN</strong> II<br />
R22 BETA II<br />
MAX RANGE (N.M.)<br />
* The estimated total yearly cost is based on aircraft ownership cost for 10 years including financing, plus yearly operating cost and regional adjustments.<br />
Source: JETNET & ASG<br />
FOURTH QUARTER 2018 — ASIAN SKY QUARTERLY | 59
SUMMARY -- HELICOPTERS<br />
MARKET SUMMARY PER MODEL — CIVIL HELICOPTERS<br />
INV<strong>EN</strong>TORY LEVEL, PRICE TR<strong>EN</strong>D & TRANSACTIONS<br />
EC135T2 & P2<br />
$2.7<br />
$2.3<br />
Average Asking Price<br />
$3.1<br />
EC135P2<br />
EC135T2<br />
For Sale vs. Sold<br />
$2.5<br />
$2.4<br />
$2.7<br />
17 18 18 18<br />
14 15 15<br />
14 14 14<br />
12 13<br />
11<br />
1 1 1 1 2 2<br />
Dec Mar Jun Sep Dec<br />
2017 2018<br />
Sold<br />
For Sale<br />
$1.8<br />
EC135T2<br />
0+0+0 0+0+02+0+02+0+0<br />
0+0+01+0+01+0+01+0+00+0+01+0+0<br />
0+11+00+13+00+12+0<br />
0+14+0 0+14+0 0+14+0 0+18+0 0+18+0 0+18+0<br />
0+0+0<br />
• There were four EC135T2s for sale in Q4 2018, decreasing 33.3% since Q3<br />
2018 and accounting for 2.8% of the 144 in operation. There were no transactions<br />
in Q4, compared with three in the previous quarter. Average days on<br />
market decreased 44.2% — from 702 days in Q3 to 392 days in Q4. The lower<br />
days on market can be attributed to the two helicopters that were removed<br />
from market in Q4. Average asking price decreased to US$1.8M in Q4 from<br />
US$2.4M in Q3.<br />
EC135P2<br />
• There were seven EC135P2s for sale in Q4 2018, decreasing 12.5% from Q3<br />
2018 and accounting for 4.6% of the 153 in operation. There were no transactions<br />
in Q4, compared with one in Q3. Average days on market increased by<br />
15.3% — from 1,111 days in Q3 to 1,281 days in Q4. The average asking price<br />
increased to US$2.7M in Q4 from US$2.5M in Q3.<br />
SPECS<br />
Max Range<br />
Max Speed<br />
Typ. Passengers<br />
FOR SALE<br />
No. for Sale<br />
Avg Asking Price<br />
Avg Days on Market<br />
SOLD<br />
Past 12 Months<br />
Past 3 Months<br />
EC135T2<br />
332 N.M. / 614 km<br />
127 Knots<br />
6<br />
2018 Q4 2018 Q3<br />
4 (2.8%)<br />
2.7M USD<br />
392<br />
2018 Q4 2018 Q3<br />
6<br />
3<br />
6 (4.2%)<br />
2.4M USD<br />
702<br />
6<br />
3<br />
EC135P2<br />
332 N.M. / 614 km<br />
127 Knots<br />
6<br />
2018 Q4<br />
7 (4.6%)<br />
2.7M USD<br />
1281<br />
2018 Q4<br />
2<br />
0<br />
2018 Q3<br />
8 (5.2%)<br />
2.5M USD<br />
1111<br />
2018 Q3<br />
2<br />
1<br />
0+14+0<br />
AS332L1 & H225<br />
0+17+0 0+15+0 0+15+0<br />
AIRBUS<br />
$22.0<br />
$8.5<br />
0+18+0<br />
Average Asking Price<br />
H225<br />
AS332L1<br />
For Sale vs. Sold<br />
0+18+0 0+19+0 0+18+0<br />
$8.8 $8.8<br />
$4.0 $4.0<br />
20<br />
18 18 19 18 18 18 18 18 18 18<br />
17<br />
18<br />
0+0+0 1+0+0 0+0+0 0+0+0 0+0+0 0+0+0<br />
1+0+02+0+0<br />
0+0+02+0+00+0+0<br />
0+18+00+17+0 0+18+0 0+18+00+20+0<br />
0+18+0 0+18+0<br />
0+0+0<br />
AS332L1<br />
• There were two AS332L1s for sale in Q4 2018, unchanged from Q3 2018;<br />
accounting for 3% of the overall 67 in operation. Q4 saw no transaction, compared<br />
with one in the previous quarter. The average days on market increased<br />
by 6.8% — from 1,347 days in Q3 to 1,438 days in Q4. The average asking price<br />
has not changed since Q3 remaining at US$4M in Q4.<br />
H225<br />
• There were 16 H225s for sale in Q4 2018, unchanged from Q3 2018; accounting<br />
for 9.5% of the 169 in operation. Q4 saw three transactions, compared<br />
with two in the previous quarter. The average days on market decreased by<br />
2.6% — from 569 days in Q3 to 554 days in Q4. The average asking price has<br />
not changed since Q3 remaining at US$8.8M in Q4.<br />
SPECS<br />
Max Range<br />
Max Speed<br />
Typ. Passengers<br />
FOR SALE<br />
No. for Sale<br />
Avg Asking Price<br />
Avg Days on Market<br />
AS332L1<br />
452 N.M. / 837 km<br />
142 Knots<br />
19<br />
2018 Q4 2018 Q3<br />
2 (3.0%)<br />
4.0M USD<br />
1438<br />
2 (3.0%)<br />
4.0M USD<br />
1347<br />
H225<br />
452 N.M. / 837 km<br />
142 Knots<br />
19<br />
2018 Q4<br />
16 (9.5%)<br />
8.8M USD<br />
554<br />
2018 Q3<br />
16 (9.5%)<br />
8.8M USD<br />
569<br />
1<br />
2 2<br />
Dec Mar Jun Sep Dec<br />
2017 2018<br />
Sold<br />
For Sale<br />
1<br />
SOLD<br />
Past 12 Months<br />
Past 3 Months<br />
2018 Q4 2018 Q3<br />
3 3<br />
0<br />
1<br />
2018 Q4<br />
6<br />
3<br />
2018 Q3<br />
3<br />
2<br />
Source: JETNET & ASG<br />
60 | ASIAN SKY QUARTERLY — FOURTH QUARTER 2018
MARKET SUMMARY -- HELICOPTERS<br />
EC145<br />
• There were 14 EC145s for sale in Q4 2018, increasing 27.3% since Q3 2018<br />
and accounting for 1.5% of the 962 in operation. There were four transactions<br />
in Q4, compared with three in Q3. Average days on market increased by 6%<br />
— from 251 days in Q3 to 266 days in Q4. The average asking price decreased<br />
to US$3.5M in Q4 from US$3.6M in Q3.<br />
SPECS<br />
Max Range<br />
Max Speed<br />
Typ. Passengers<br />
FOR SALE<br />
No. for Sale<br />
Avg Asking Price<br />
Avg Days on Market<br />
461 N.M. / 855 km<br />
131 Knots<br />
9<br />
2018 Q4 2018 Q3<br />
14 (1.2%) 11 (1.0%)<br />
3.5M USD 3.6M USD<br />
266 251<br />
SOLD<br />
Past 12 Months<br />
Past 3 Months<br />
2018 Q4<br />
23<br />
4<br />
2018 Q3<br />
19<br />
3<br />
$5.0<br />
$3.9<br />
Average Asking Price<br />
For Sale vs. Sold<br />
EC155B & H155<br />
0+9+0 0+0+0<br />
9 8 9 8<br />
$4.2<br />
10<br />
10<br />
8<br />
8<br />
$4.0<br />
$3.6<br />
0+0+0 0+0+0 3+0+02+0+02+0+0<br />
1+0+02+0+06+0+0<br />
0+11+00+8+0 0+8+00+10+00+10+0<br />
0+8+00+9+00+8+0<br />
3+0+0<br />
11 10<br />
14<br />
$3.5<br />
14<br />
6<br />
2<br />
1 2 2<br />
8<br />
3 3 2 2<br />
Dec Mar Jun Sep Dec<br />
2017 2018<br />
Sold<br />
For Sale<br />
2+0+00+0+0<br />
0+14+0 0+14+00+10+0<br />
2+0+0<br />
EC155B<br />
• There were six EC155Bs for sale in Q4 2018, decreasing 14.3% from Q3 2018<br />
and accounting for 21.4% of the overall 28 in operation. There was one transaction<br />
in Q4 compared with zero in Q3. Average days on market increased by<br />
23% — from 1,007 days in Q3 to 1,239 days in Q4. Average asking price has<br />
not changed from Q3, remaining at US$2M in Q4.<br />
H155<br />
• There were nine H155s for sale in Q4 2018, decreasing 10% since Q3 2018<br />
and accounting for 6.2% of the 146 in operation. There were five sold transactions<br />
in Q4, compared with two in Q3. Average days on market increased<br />
by 0.3% — from 860 days in Q3 to 863 days in Q4. The average asking price<br />
increased to US$7.5M in Q4 2018 from US$5.6M in Q3 2018.<br />
SPECS<br />
Max Range<br />
Max Speed<br />
Typ. Passengers<br />
FOR SALE<br />
No. for Sale<br />
Avg Asking Price<br />
Avg Days on Market<br />
EC155B<br />
516 N.M. / 955 km<br />
135 Knots<br />
13<br />
2018 Q4 2018 Q3<br />
6 (21.4%)<br />
2.0M USD<br />
1239<br />
7 (25.0%)<br />
2.0M USD<br />
1007<br />
H155<br />
516 N.M. / 955 km<br />
150 Knots<br />
13<br />
2018 Q4<br />
9 (6.2%)<br />
7.5M USD<br />
863<br />
2018 Q3<br />
10 (6.8%)<br />
5.6M USD<br />
860<br />
0+24+0<br />
1+0+0 2+0+00+0+01+0+00+0+00+0+00+0+00+0+0<br />
0+17+00+18+00+20+0<br />
0+21+00+22+00+21+0<br />
0+20+00+22+00+23+0<br />
0+0+0<br />
AIRBUS<br />
SOLD<br />
Past 12 Months<br />
Past 3 Months<br />
2018 Q4 2018 Q3<br />
2 1<br />
1<br />
0<br />
2018 Q4<br />
9<br />
5<br />
2018 Q3<br />
5<br />
2<br />
$4.8<br />
$3.3<br />
24<br />
Average Asking Price<br />
23 22<br />
H155<br />
EC155B<br />
For Sale vs. Sold<br />
21 22<br />
20 21 20<br />
$5.6<br />
$2.0<br />
18 17 17<br />
15 15<br />
$7.5<br />
$2.0<br />
1 2 1 1 2 3<br />
1<br />
Dec Mar Jun Sep Dec<br />
2017 2018<br />
Sold<br />
For Sale<br />
3+0+02+0+0<br />
0+15+0 0+15+00+17+0<br />
1+0+0<br />
Source: JETNET & ASG<br />
FOURTH QUARTER 2018 — ASIAN SKY QUARTERLY | 61
MARKET SUMMARY -- HELICOPTERS<br />
BELL 412EP/412HP<br />
Bell 412EP<br />
• There were 32 Bell 412EPs for sale in Q4 2018, decreasing 5.9% since Q3<br />
2018 and accounting for 5.8% of 551 in operation. There was only one sold<br />
transaction in Q4, compared with three in Q3. Average days on market<br />
increased by 19.5% — from 549 days in Q3 to 656 days in Q4 2018. The average<br />
asking price has not changed since Q3, remaining at US$4.2M in Q4.<br />
Bell 412HP<br />
• There were six Bell 412HPs for sale in Q4 2018, increasing by 20% since<br />
Q3 2018 and accounting for 9.8% of the 61 in operation. There was only one<br />
transaction in Q4, compared with three in Q3 2018. Average days on market<br />
increased by 19.2% — from 239 days in Q3 to 285 days in Q4. The average<br />
asking price was unchanged, remaining at US$3M in Q4.<br />
$5.2<br />
$3.0<br />
Average Asking Price<br />
0+33+0<br />
2+0+0<br />
BELL 412EP<br />
BELL 412HP<br />
For Sale vs. Sold<br />
33 33 33 32<br />
+0+0 6+0+0 2+0+0<br />
35 35<br />
30<br />
$4.0<br />
0+32+0 0+33+0 0+33+0<br />
3+0+0 3+0+00<br />
0+35+00+30+00+35+0<br />
2+0+0<br />
$4.2<br />
$2.8 $3.0<br />
$4.2<br />
$3.0<br />
38 39<br />
37 38 38 38<br />
1+0+0 1+0+0 1+0+04+0+0<br />
0+38+0 0+38+0 0+38+0 0+0+0<br />
SPECS<br />
Max Range<br />
Max Speed<br />
Typ. Passengers<br />
FOR SALE<br />
No. for Sale<br />
Avg Asking Price<br />
Avg Days on Market<br />
Bell 412EP<br />
356 N.M. / 659 km<br />
140 Knots<br />
9<br />
2018 Q4 2018 Q3<br />
32 (5.8%)<br />
4.2M USD<br />
656<br />
34 (6.2%)<br />
4.2M USD<br />
549<br />
Bell 412HP<br />
349 N.M. / 646 km<br />
133 Knots<br />
14<br />
2018 Q4<br />
6 (9.8%)<br />
3.0M USD<br />
285<br />
2018 Q3<br />
5 (8.2%)<br />
3.0M USD<br />
239<br />
0+39+0 0+37+0 0+38+0<br />
6<br />
2 2 3 3 4<br />
2 1 1 1 1<br />
Dec Mar Jun Sep Dec<br />
2017 2018<br />
Sold<br />
For Sale<br />
SOLD<br />
Past 12 Months<br />
Past 3 Months<br />
2018 Q4 2018 Q3<br />
14 21<br />
1<br />
3<br />
2018 Q4<br />
10<br />
1<br />
2018 Q3<br />
10<br />
3<br />
BELL 429<br />
• There were 17 Bell 429s for sale in Q4 2018, increasing 13.3% from Q3 2018<br />
and accounting for 5.3% of the 323 in operation. There was only one transaction<br />
in Q4 compared with four in Q3. The average days on market decreased<br />
by 12.1% - from 439 days in Q3 to 386 days in Q4. The lower days on market<br />
can be attributed to the four helicopters that were added into the market<br />
during this quarter. The average asking price increased to US$5.7M in Q4<br />
from US$5.5M in Q3.<br />
BELL<br />
$5.3<br />
0+17+0<br />
0+0+0<br />
Average Asking Price<br />
For Sale vs. Sold<br />
0+16+0 0+15+0 0+16+0<br />
0+0+0 3+0+0 1+0+0<br />
$5.5<br />
$5.7<br />
19 19 19<br />
17 16 15 16<br />
17<br />
18<br />
15 15 16 17<br />
1+0+0 0+0+02+0+02+0+0<br />
0+0+0 0+0+0<br />
0+17+00+18+00+16+0<br />
0+15+0 0+15+00+17+0<br />
0+19+0 0+19+0 0+19+0<br />
0+0+0<br />
SPECS<br />
Max Range<br />
Max Speed<br />
Typ. Passengers<br />
FOR SALE<br />
No. for Sale<br />
Avg Asking Price<br />
Avg Days on Market<br />
368 N.M. / 681 km<br />
130 Knots<br />
7<br />
2018 Q4<br />
17 (5.3%)<br />
5.7M USD<br />
386<br />
2018 Q3<br />
15 (4.7%)<br />
5.5M USD<br />
439<br />
3<br />
1 2 2<br />
1<br />
Dec Mar Jun Sep Dec<br />
2017 2018<br />
Sold<br />
For Sale<br />
SOLD<br />
Past 12 Months<br />
Past 3 Months<br />
2018 Q4<br />
9<br />
1<br />
2018 Q3<br />
8<br />
4<br />
Source: JETNET & ASG<br />
62 | ASIAN SKY QUARTERLY — FOURTH QUARTER 2018
MARKET SUMMARY -- HELICOPTERS<br />
A109E POWER/A109SP GRANDNEW<br />
A109E Power<br />
• There were 46 A109E Powers for sale in Q4 2018, decreasing by 8% from<br />
Q3 2018 and accounting for 12.4% of the 372 in operation. There were three<br />
transactions in Q4, same as in Q3. Average days on market increased by 1.3%<br />
— from 698 days in Q3 to 707 days in Q4. The average asking price has not<br />
changed from Q3, remaining at US$1.7M in Q4.<br />
A109SP Grandnew<br />
• There were six A109SP Grandnews for sale in Q4 2018, decreasing by 25%<br />
since Q3 2018 and accounting for 3.8% of the 160 in operation. There were<br />
five transactions in Q4, compared with four in Q3. Average days on market<br />
decreased by 10.5% — from 210 days in Q3 to 188 days in Q4. The average<br />
asking price increased to US$4.8M in Q4 from US$4.6M in Q3.<br />
$4.3<br />
Average Asking Price<br />
A109SP GRANDNEW<br />
$4.6<br />
$6.0<br />
$4.8<br />
SPECS<br />
Max Range<br />
A109E Power<br />
353 N.M. / 654 km<br />
A109SP Grandnew<br />
480 N.M. / 889 km<br />
$1.9 $1.7 $1.7<br />
A109E Power<br />
Max Speed<br />
Typ. Passengers<br />
FOR SALE<br />
No. for Sale<br />
Avg Asking Price<br />
Avg Days on Market<br />
139 Knots<br />
7<br />
2018 Q4 2018 Q3<br />
46 (12.4%) 50 (13.4%)<br />
1.7M USD 1.7M USD<br />
707 698<br />
130 Knots<br />
7<br />
2018 Q4<br />
6 (3.8%)<br />
4.8M USD<br />
188<br />
2018 Q3<br />
8 (5.1%)<br />
4.6M USD<br />
210<br />
69<br />
3+0+0<br />
For Sale vs. Sold<br />
69<br />
65<br />
63 63 64<br />
62 62 60 58 55 53 52<br />
5+0+02+0+0<br />
4+0+01+0+0 2+0+05+0+06+0+0<br />
5+0+03+0+01+0+0<br />
0+52+00+53+00+55+0<br />
0+58+00+60+00+62+0<br />
0+64+00+63+00+62+0<br />
0+63+00+65+00+69+00+69+0<br />
1+0+0<br />
SOLD<br />
Past 12 Months<br />
Past 3 Months<br />
2018 Q4 2018 Q3<br />
13 11<br />
3 3<br />
2018 Q4<br />
24<br />
5<br />
2018 Q33<br />
22<br />
4<br />
3 1 3 5 6 5<br />
2 2 1<br />
4 2<br />
5<br />
1<br />
Dec Mar Jun Sep Dec<br />
2017 2018<br />
For Sale Sold<br />
AW139<br />
• There were 24 AW139s for sale in Q4 2018, decreasing by 4% since Q3 2018<br />
and accounting for 2.7% of the 875 in operation. There were five transactions<br />
in Q4, compared with two in Q3. The average days on market increased by<br />
6.9% — from 481 days in Q3 to 514 days in Q4. The average asking price<br />
decreased to US$7.7M in Q4 from US$7.9M in Q3.<br />
SPECS<br />
Max Range<br />
Max Speed<br />
Typ. Passengers<br />
FOR SALE<br />
No. for Sale<br />
Avg Asking Price<br />
Avg Days on Market<br />
568 N.M. / 1,052 km<br />
140 Knots<br />
15<br />
2018 Q4 2018 Q3<br />
24 (2.7%) 25 (2.9%)<br />
7.7M USD 7.9M USD<br />
514 481<br />
$7.8<br />
Average Asking Price<br />
For Sale vs. Sold<br />
$7.9<br />
$7.7<br />
29<br />
28 27 28<br />
26 26<br />
24 23 24 25 25<br />
23 24<br />
3+0+0 0+0+0 0+0+02+0+0<br />
0+0+0 1+0+00+0+02+0+0<br />
0+24+00+23+0 0+25+00+26+00+26+0<br />
0+28+00+27+00+28+0<br />
0+29+00+24+00+23+0<br />
0+24+0<br />
2+0+0<br />
LEONARDO<br />
SOLD<br />
Past 12 Months<br />
Past 3 Months<br />
2018 Q4<br />
11<br />
5<br />
2018 Q3<br />
7<br />
2<br />
1<br />
2 3<br />
1 1<br />
2 2<br />
Dec Mar Jun Sep Dec<br />
2017 2018<br />
Sold<br />
For Sale<br />
Source: JETNET & ASG<br />
FOURTH QUARTER 2018 — ASIAN SKY QUARTERLY | 63
MARKET SUMMARY -- HELICOPTERS<br />
S-76C+ / S-76C++<br />
$4.9<br />
S76C+<br />
• There were 21 S-76C+ for sale in Q4 2018, decreasing by 4.5% since Q3<br />
2018 and accounting for 14.4% of the 146 in operation. There were four sold<br />
transactions in Q4, compared with only one in Q3. Average days on market<br />
increased by 8% — from 981 days in Q3 to 1,059 days in Q4. The average<br />
asking price has not changed since Q3, remaining at US$2M in Q4.<br />
Average Asking Price<br />
$6.8<br />
S76C++<br />
• There were 23 S-76C++ for sale in Q4 2018, decreasing by 4.2% since Q3 2018<br />
and accounting for 11% of the 209 in operation. There were three sold transactions<br />
this quarter, compared with only one the previous quarter. Average<br />
days on market increased by 9.9% — from 645 days in Q3 to 709 days in Q4.<br />
The average asking price has not changed since Q3, remaining at US$5.4M<br />
in Q4.<br />
$3.1<br />
S-76C++<br />
0+56+0<br />
0+0+0<br />
S-76C+<br />
$5.4<br />
$5.4<br />
For Sale vs. Sold<br />
56<br />
52 54 53 54 55<br />
0+0+0 0+0+02+0+05+0+0<br />
0+49+00+55+00+54+0<br />
0+53+00+54+00+52+0<br />
0+0+0<br />
49<br />
$2.0<br />
47 47 46 44 43 44<br />
$2.0<br />
SPECS<br />
Max Range<br />
Max Speed<br />
Typ. Passengers<br />
FOR SALE<br />
No. for Sale<br />
Avg Asking Price<br />
Avg Days on Market<br />
S-76C+<br />
335 N.M. / 620 km<br />
155 Knots<br />
12<br />
2018 Q4 2018 Q3<br />
21 (14.4%)<br />
2.0M USD<br />
1059<br />
22 (15.1%)<br />
2.0M USD<br />
981<br />
S-76C++<br />
335 N.M. / 620 km<br />
155 Knots<br />
12<br />
2018 Q4<br />
23 (11.0%)<br />
5.4M USD<br />
709<br />
2018 Q3<br />
24 (11.5%)<br />
5.4M USD<br />
645<br />
SOLD<br />
Past 12 Months<br />
Past 3 Months<br />
2018 Q4 2018 Q3<br />
14<br />
4<br />
11<br />
1<br />
2018 Q4<br />
9<br />
3<br />
2018 Q3<br />
7<br />
1<br />
0+7+0 0+7+0 0+9+0<br />
1+0+0 0+0+0 0+0+0 0+0+0 0+0+0 0+0+0<br />
0+0+0 0+0+0 0+0+0<br />
0+9+0+9+0+9+0+9+0 0+8+0 0+8+0<br />
1+0+0 0+0+0 0+0+0<br />
SIKORSKY<br />
2+0+03+0+0<br />
1+0+00+0+01+0+0<br />
0+44+00+43+00+44+0<br />
0+46+00+47+00+47+0<br />
2+0+0<br />
5<br />
2 1 1<br />
3 2 2<br />
Dec Mar Jun Sep Dec<br />
2017 2018<br />
For Sale Sold<br />
S-92<br />
0+9+0 0+9+0 0+8+0<br />
0+8+0<br />
• There were nine S-92s for sale in Q4 2018, unchanged since Q3 2018 and<br />
accounting for 3.2% of the 285 in operation. There was one sold transaction<br />
in Q4, compared with zero in Q3. Average days on market increased by<br />
15.2% — from 597 days in Q3 to 688 days in Q4. The average asking price has<br />
decreased to US$13.2M in Q4 from US$15.4M in Q3..<br />
$16.9<br />
Average Asking Price<br />
For Sale vs. Sold<br />
$15.4<br />
$13.2<br />
SPECS<br />
Max Range<br />
Max Speed<br />
Typ. Passengers<br />
FOR SALE<br />
No. for Sale<br />
Avg Asking Price<br />
Avg Days on Market<br />
474 N.M. / 877 km<br />
155 Knots<br />
19<br />
2018 Q4 2018 Q3<br />
9 (3.2%) 9 (3.2%)<br />
15.4M USD 15.4M USD<br />
688 597<br />
8 8 9 9 9<br />
7 8 8 9 9 9 9<br />
7<br />
1 1<br />
Dec Mar Jun Sep Dec<br />
2017 2018<br />
Sold<br />
For Sale<br />
SOLD<br />
Past 12 Months<br />
Past 3 Months<br />
2018 Q4<br />
2<br />
1<br />
2018 Q3<br />
1<br />
0<br />
Source: JETNET & ASG<br />
64 | ASIAN SKY QUARTERLY — FOURTH QUARTER 2018
LEADING YOU TO SUCCESSFUL<br />
AVIATION DECISIONS<br />
SALES & ACQUISTIONS | TRANSACTIONAL ADVISORY | OPERATION OVERSIGHT | SPECIAL PROJECTS<br />
LUXURY TRAVEL SERVICES| MARKET RESEARCH | COMPLETION MANAGEM<strong>EN</strong>T<br />
2013 ACJ320<br />
• 30 Passengers VIP Configuration<br />
• One Owner Since New<br />
• ADS-B Out, TCAS 7.1 & 8.33 khz Channel Spacing<br />
• Equipped with Two Auxiliary Fuel Tanks<br />
2008 BOEING 737-800<br />
• ADS-B Activation System<br />
• Upgraded TCAS 7.0 to TCAS 7.1<br />
• Second FMC - Boeing SB 34-2918<br />
• IFE WiFi System, Skyconnect System<br />
1998 BOEING 737-500<br />
• Total 117 Passenger Seats<br />
• Equipped with ADS-B Out<br />
• Total 32,347 Hours Since New<br />
2012 LINEAGE 1000<br />
• 881 Hours Since New, One Owner Since New<br />
• 19 Passenger - 5 Zones Cabin Configuration<br />
• High Speed Data & Cabin Wi-fi<br />
• TCAS,EFB,ELT,EGPWS,Windshear Detection<br />
2012 LINEAGE 1000<br />
•<br />
• Engines Enrolled on GE On-Point Solutions Program<br />
• One Owner Since New<br />
• Five-Zone Executive Layout w/ 19 Passengers<br />
• TCAS 7.1, TAWS, LASEREF V IRS & ADS-B Out<br />
•<br />
2011 GLOBAL EXPRESS XRS<br />
• 15 Passengers Configuration, Forward Gally & Crew Rest Area<br />
• One Owner Since New, No Damage History<br />
• RRCC, Honeywell MSP, Smartparts & CAMP<br />
• Swift Broadband High Speed Internet & Cabin Wifi<br />
2011 GULFSTREAM G550<br />
• N-Reg Aircraft<br />
• 16 Pax Configuration, No Damage History<br />
• Aft Galley, Forward Crew Rest<br />
• RRCC, MSP Gold<br />
2009 GULFSTREAM G550<br />
• One Owner Since New<br />
• FAA Part 135 Compliant, EU-OPS Certification<br />
• 16 Passenger Configuration, Fwd Galley & Aft Lavatory<br />
• RRCC, MSP<br />
2013 GULFSTREAM G550<br />
• Low 900 Hours Since New, One Owner Since New<br />
• Executive 12 Passengers Configuration<br />
• Forward Galley with Crew Rest<br />
• RRCC, MSP<br />
2013 LEGACY 650<br />
• 13 Pax Configuration w/ Fwd Galley<br />
• Engines Enrolled on RRCC<br />
• XM Weather Capability<br />
• Swift Broadband High-Speed Internet<br />
2013 DASSAULT FALCON 7X<br />
• Low Hours, One Owner Since New , No Damage Record<br />
• EASy II Avionics System Upgrade, CPDLC, ADS-B Out<br />
• Stunning BMW Interior<br />
• Engines enrolled on ESP Gold<br />
1986 BELL 206 L3<br />
• Manufacturing Year: 1986<br />
• Total Hours: 5,082 Since New<br />
• 7 Pax Configuration<br />
1987 BELL 206 L3<br />
• Manufacturing Year: 1987<br />
• Total Hours: 8,621 Since New<br />
• 7 Pax Configuration<br />
2017 AIRBUS H130<br />
• Very Low Hours<br />
• Utility Configuration<br />
• Air Condition<br />
2014 CESSNA 208<br />
• 9 Passenger Configroution<br />
• Single/Dual Pilot IFR<br />
• Increased Gross Weight Compliant<br />
• GWX-68 Color Weather Radar<br />
CONTACT US<br />
EMAIL: SALES@ASIANSKYGROUP.COM TEL: +852 2235 9222<br />
WWW.ASIANSKYGROUP.COM/AIRCRAFT-LISTING/<br />
FOURTH QUARTER 2018 — ASIAN SKY QUARTERLY | 65