September/October 2017

Create successful ePaper yourself
Turn your PDF publications into a flip-book with our unique Google optimized e-Paper software.
Figure 3 (pg. 26) perfectly illustrates<br />
the insufficiency of using the classic ECe<br />
threshold concept as the main driver for<br />
tree growth and yield decline. The Area<br />
1 tree has almost double the canopy volume<br />
of Area 4, but the average rootzone<br />
ECe from 2014-16 is actually higher<br />
for Area 1 (12.9 dS/m) compared to<br />
Area 4 of the same field with an average<br />
rootzone ECe of 9.0 dS/m. Whoa—that<br />
makes no sense—the tree with less salt<br />
is smaller?! What the lab ECe salinity<br />
does not take into account is the high<br />
pH, bad sodic silty clay structure that<br />
makes Area 4 prone to water-logging.<br />
We used a somewhat novel approach<br />
taking EM38 measurements right at the<br />
single-line drip hose and 30 inches away<br />
from the hose to get a larger snapshot<br />
of the rootzone. We then summed the<br />
resulting four horizontal and vertical<br />
EMa readings for a “summed” conductance.<br />
Doing this we find Area 1 has a<br />
summed EMa of 241 mS/cm and Area 4<br />
was 877 mS/cm—fully 360 percent higher<br />
conductance for Area 4 compared to<br />
Area 1, and higher conductance means<br />
more salt and water logging. Thus, the<br />
EM38 provided a superior integration of<br />
the combined impact of salinity and soil<br />
structure on final tree growth.<br />
hundreds of measurements per hour as<br />
opposed to three to four soil cores—and<br />
it’s integration of excessive water logging<br />
problems.<br />
Blake L Sanden, Farm Advisor<br />
UCCE Kern County<br />
1031 South Mount Vernon Avenue<br />
Bakersfield, CA 93307, USA<br />
(661) 868-6218<br />
blsanden@ucdavis.edu<br />
Louise Ferguson, Pomology Extension<br />
Specialist<br />
Department of Plant Sciences<br />
3045 Wickson Hall<br />
Davis, CA 95616<br />
530-752-0507<br />
lferguson@ucdavis.edu<br />
Craig E. Kallsen, Farm Advisor<br />
UCCE Kern County<br />
1031 South Mount Vernon Avenue<br />
Bakersfield, CA 93307, USA<br />
(661) 868-6221<br />
blsanden@ucdavis.edu<br />
Comments about this article? We want<br />
to hear from you. Feel free to email us at<br />
article@jcsmarketinginc.com<br />
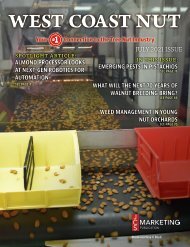
Figure 4 illustrates the three-year<br />
summed yield decline as a function of<br />
rootzone ECe to a depth of five feet. The<br />
trend is highly significant, and similar<br />
to the 10 year field trial preceding this<br />
survey: resulting in a yield reduction<br />
of 144 to 351 lb/ac (three year cumulative<br />
inshell yield) for every unit ECe ><br />
6.5 dS/m. Definitely a lower yield loss<br />
salinity “threshold” then we published<br />
13 years ago, but the scatter under the<br />
curve is large (R2 = 0.107)—indicating<br />
the multiple other factors affecting tree<br />
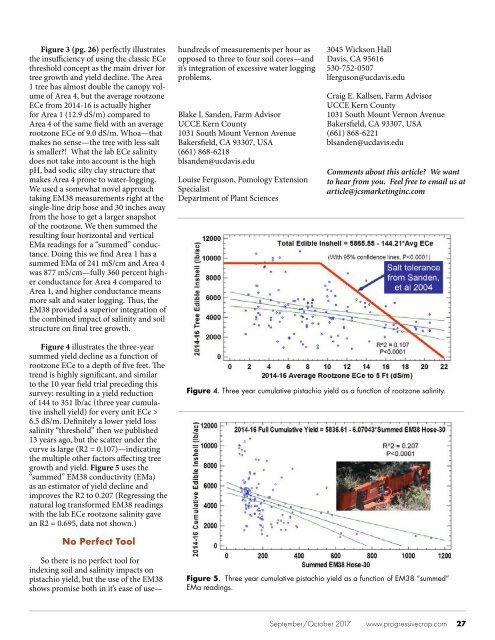
growth and yield. Figure 5 uses the<br />
“summed” EM38 conductivity (EMa)<br />
as an estimator of yield decline and<br />
improves the R2 to 0.207 (Regressing the<br />
natural log transformed EM38 readings<br />
with the lab ECe rootzone salinity gave<br />
an R2 = 0.695, data not shown.)<br />
Figure 4. Three year cumulative pistachio yield as a function of rootzone salinity.<br />
No Perfect Tool<br />
So there is no perfect tool for<br />
indexing soil and salinity impacts on<br />
pistachio yield, but the use of the EM38<br />
shows promise both in it’s ease of use—<br />
Figure 5. Three year cumulative pistachio yield as a function of EM38 “summed”<br />
EMa readings.<br />
<strong>September</strong>/<strong>October</strong> <strong>2017</strong><br />
www.progressivecrop.com<br />
27