Management Sciences for Health <strong>of</strong> the equation is equally important. Without the capacity to deliver services—including adequate staff—facilities will be unable to meet the rising demand. Impact on Health Outcomes The ultimate goal <strong>of</strong> increasing the health workforce is to improve a country’s health status. Several studies have been undertaken in other countries linking health worker density to health outcomes. For example, there is a strong association between health worker density and maternal mortality 97 as well as increased levels <strong>of</strong> vaccination coverage. 98 In another study, a dynamic regression model was developed to evaluate the short and long term impact <strong>of</strong> changes in number <strong>of</strong> physicians per capita. 99 Using a data set <strong>of</strong> 99 countries, the regression model showed that increasing the number <strong>of</strong> physicians by one per 1,000 population resulted in a decrease in infant mortality <strong>of</strong> 15% within five years, and by 45% in the long run (half <strong>of</strong> which would be achieved in fifteen years). Impact on health outcomes is analysed in this evaluation by assessing the changes in service delivery, and thereby health outcomes, from the baseline year <strong>of</strong> the EHRP to 2009, with the assumption that the increased staff played a significant role in these health outcomes. The impact on health outcomes is measured by approximating the number <strong>of</strong> lives saved and morbidity averted as a result <strong>of</strong> the increased service utilisation described in the section above. At the completion <strong>of</strong> the upcoming DHS for Malawi in 2011, outcomes in terms <strong>of</strong> maternal, infant, neonatal, and child mortality rates can also be measured. The estimation <strong>of</strong> morbidity and mortality averted by increased service utilisation was made using the Lives Saved Tool (LiST) from the Spectrum suite <strong>of</strong> tools. 100 The changes in coverage for the HMIS indicators discussed in the previous section (antenatal care, trained deliveries, PMTCT, and immunisation) were input into the LiST tool for the span <strong>of</strong> the EHRP (2004 to 2009). Table 17 on the following page shows the interventions, percentage coverage in 2004 and 2009, and the resulting lives saved or infections averted based on the modeling (for complete results, see Annex S). 101 Note that OPD attendance is not included in this analysis because this is not a specific intervention and therefore cannot be used to calculate lives saved using LiST. 97 Lincoln Chen et al. <strong>Human</strong> <strong>Resources</strong> for Health: Overcoming the Crisis. The Lancet, Vol 364, November 27, 2004. pp. 1984 – 1990. 98 Sudhir Anand, Till Barnighausen; Health Workers and Vaccination Coverage in Developing Countries: AnEconometric Analysis. The Lancet. Vol 369, April 14, 2007. pp. 1277 – 1284. 99 Mansour Farahani et al. The Effect <strong>of</strong> Changes in Health Sector <strong>Resources</strong> on Infant Mortality in the Short-Run and Long Run; a longitudinal Econometric Analysis. Social Science and Medicine, No. 68, 2009; pp 1918-1925. 100 The Spectrum suite <strong>of</strong> tools, developed by Futures Institute, is accessible online at http://www.futuresinstitute.org/Pages/Spectrum.aspx. 101 Note that impact presented in Table 17 represents an approximation based on pre-determined effectiveness coefficients for each intervention and using all default parameters for Malawi that are preloaded in the LiST tool and assuming 12% HIV prevalence for adults. An outcome assessment should be performed when information from upcoming DHS 2011 is made available. EHRP <strong>Evaluation</strong> Final Report Page 64
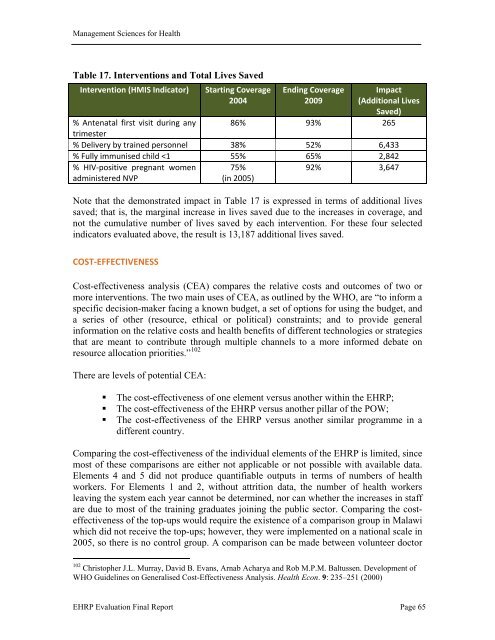
Management Sciences for Health Table 17. Interventions and Total Lives Saved Intervention (HMIS Indicator) Starting Coverage 2004 Ending Coverage 2009 Impact (Additional Lives Saved) % Antenatal first visit during any trimester 86% 93% 265 % Delivery by trained personnel 38% 52% 6,433 % Fully immunised child