Identification of dry and rainy periods using telecommunication ...
Identification of dry and rainy periods using telecommunication ...
Identification of dry and rainy periods using telecommunication ...

Create successful ePaper yourself
Turn your PDF publications into a flip-book with our unique Google optimized e-Paper software.
12 nd International Conference on Urban Drainage, Porto Alegre/Brazil, 10-15 September 2011<br />
�<br />
�<br />
RSL(t)<br />
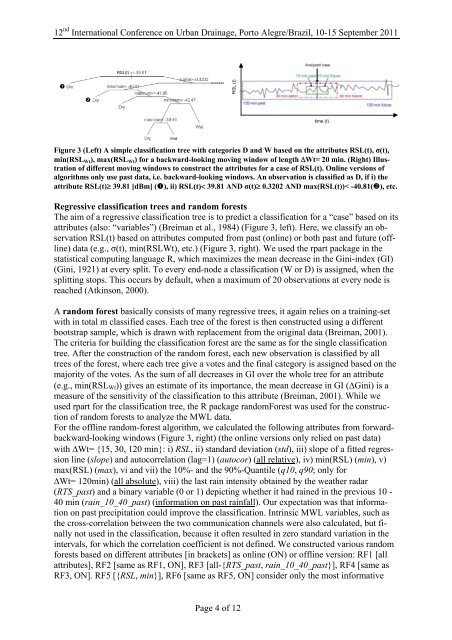
Figure 3 (Left) A simple classification tree with categories D <strong>and</strong> W based on the attributes RSL(t), σ(t),<br />
min(RSLWt), max(RSLWt) for a backward-looking moving window <strong>of</strong> length �Wt= 20 min. (Right) Illustration<br />
<strong>of</strong> different moving windows to construct the attributes for a case <strong>of</strong> RSL(t). Online versions <strong>of</strong><br />
algorithms only use past data, i.e. backward-looking windows. An observation is classified as D, if i) the<br />
attribute RSL(t)� 39.81 [dBm] (�), ii) RSL(t)� 39.81 AND σ(t)� 0.3202 AND max(RSL(t))< -40.81(�), etc.<br />
Regressive classification trees <strong>and</strong> r<strong>and</strong>om forests<br />
The aim <strong>of</strong> a regressive classification tree is to predict a classification for a “case” based on its<br />
attributes (also: “variables”) (Breiman et al., 1984) (Figure 3, left). Here, we classify an observation<br />
RSL(t) based on attributes computed from past (online) or both past <strong>and</strong> future (<strong>of</strong>fline)<br />
data (e.g., σ(t), min(RSLWt), etc.) (Figure 3, right). We used the rpart package in the<br />
statistical computing language R, which maximizes the mean decrease in the Gini-index (GI)<br />
(Gini, 1921) at every split. To every end-node a classification (W or D) is assigned, when the<br />
splitting stops. This occurs by default, when a maximum <strong>of</strong> 20 observations at every node is<br />
reached (Atkinson, 2000).<br />
A r<strong>and</strong>om forest basically consists <strong>of</strong> many regressive trees, it again relies on a training-set<br />
with in total m classified cases. Each tree <strong>of</strong> the forest is then constructed <strong>using</strong> a different<br />
bootstrap sample, which is drawn with replacement from the original data (Breiman, 2001).<br />
The criteria for building the classification forest are the same as for the single classification<br />
tree. After the construction <strong>of</strong> the r<strong>and</strong>om forest, each new observation is classified by all<br />
trees <strong>of</strong> the forest, where each tree give a votes <strong>and</strong> the final category is assigned based on the<br />
majority <strong>of</strong> the votes. As the sum <strong>of</strong> all decreases in GI over the whole tree for an attribute<br />
(e.g., min(RSLWt)) gives an estimate <strong>of</strong> its importance, the mean decrease in GI (�Gini) is a<br />
measure <strong>of</strong> the sensitivity <strong>of</strong> the classification to this attribute (Breiman, 2001). While we<br />
used rpart for the classification tree, the R package r<strong>and</strong>omForest was used for the construction<br />
<strong>of</strong> r<strong>and</strong>om forests to analyze the MWL data.<br />
For the <strong>of</strong>fline r<strong>and</strong>om-forest algorithm, we calculated the following attributes from forwardbackward-looking<br />
windows (Figure 3, right) (the online versions only relied on past data)<br />
with �Wt= {15, 30, 120 min}: i) RSL, ii) st<strong>and</strong>ard deviation (std), iii) slope <strong>of</strong> a fitted regression<br />
line (slope) <strong>and</strong> autocorrelation (lag=1) (autocor) (all relative), iv) min(RSL) (min), v)<br />
max(RSL) (max), vi <strong>and</strong> vii) the 10%- <strong>and</strong> the 90%-Quantile (q10, q90; only for<br />
�Wt= 120min) (all absolute), viii) the last rain intensity obtained by the weather radar<br />
(RTS_past) <strong>and</strong> a binary variable (0 or 1) depicting whether it had rained in the previous 10 -<br />
40 min (rain_10_40_past) (information on past rainfall). Our expectation was that information<br />
on past precipitation could improve the classification. Intrinsic MWL variables, such as<br />
the cross-correlation between the two communication channels were also calculated, but finally<br />
not used in the classification, because it <strong>of</strong>ten resulted in zero st<strong>and</strong>ard variation in the<br />
intervals, for which the correlation coefficient is not defined. We constructed various r<strong>and</strong>om<br />
forests based on different attributes [in brackets] as online (ON) or <strong>of</strong>fline version: RF1 [all<br />
attributes], RF2 [same as RF1, ON], RF3 [all-{RTS_past, rain_10_40_past}], RF4 [same as<br />
RF3, ON]. RF5 [{RSL, min}], RF6 [same as RF5, ON] consider only the most informative<br />
RSL (t)<br />
Page 4 <strong>of</strong> 12<br />
time (t)