2008 Scientific Report

Create successful ePaper yourself
Turn your PDF publications into a flip-book with our unique Google optimized e-Paper software.
VARI | <strong>2008</strong><br />
The key to developing improved markers is the ability to reproducibly measure specific glycans on specific proteins. Many of<br />
the carbohydrate structures on proteins in normal and cancer tissues have been characterized using mass spectrometry and<br />
enzymatic methods. Those methods are valuable for defining structures, but they do not have the precision or throughput<br />
necessary to look at changes in levels between samples, which is necessary to assess biomarker potential. A new method<br />
developed in our laboratory provides the means to obtain more detailed information on glycan variation. We use lectins—<br />
proteins that bind specific glycan structures—and glycan-binding antibodies to probe the levels of particular glycans on the<br />
proteins captured by antibody arrays. This method provides the important feature of allowing comparison between samples of<br />
the levels of particular glycans on specific proteins so that we can assess their diagnostic potential. A product based on this<br />
technology is now available from GenTel Biosciences (Madison, WI).<br />
The class of proteins called mucins shows particularly high levels of glycan alteration in pancreatic cancer. Mucins are longchain,<br />
heavily glycosylated proteins on epithelial cell surfaces that have roles in cell protection, interaction with the extracellular<br />
space, and regulation of extracellular signaling. Altered carbohydrates on mucins can affect critical processes in cancer such<br />
as cell migration or extracellular signaling to the immune system. We have extensively characterized the glycan variations on<br />
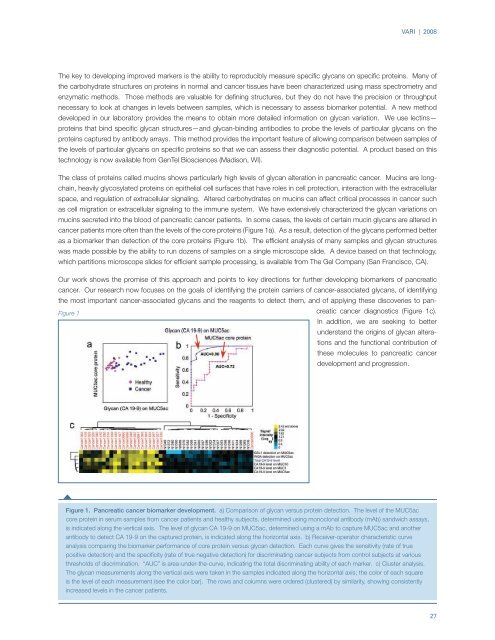
mucins secreted into the blood of pancreatic cancer patients. In some cases, the levels of certain mucin glycans are altered in<br />
cancer patients more often than the levels of the core proteins (Figure 1a). As a result, detection of the glycans performed better<br />
as a biomarker than detection of the core proteins (Figure 1b). The efficient analysis of many samples and glycan structures<br />
was made possible by the ability to run dozens of samples on a single microscope slide. A device based on that technology,<br />
which partitions microscope slides for efficient sample processing, is available from The Gel Company (San Francisco, CA).<br />
Our work shows the promise of this approach and points to key directions for further developing biomarkers of pancreatic<br />
cancer. Our research now focuses on the goals of identifying the protein carriers of cancer-associated glycans, of identifying<br />
the most important cancer-associated glycans and the reagents to detect them, and of applying these discoveries to pancreatic<br />
cancer diagnostics (Figure 1c).<br />
Figure 1<br />
In addition, we are seeking to better<br />
understand the origins of glycan alterations<br />
and the functional contribution of<br />
these molecules to pancreatic cancer<br />
development and progression.<br />
Figure 1. Pancreatic cancer biomarker development. a) Comparison of glycan versus protein detection. The level of the MUC5ac<br />
core protein in serum samples from cancer patients and healthy subjects, determined using monoclonal antibody (mAb) sandwich assays,<br />
is indicated along the vertical axis. The level of glycan CA 19-9 on MUC5ac, determined using a mAb to capture MUC5ac and another<br />
antibody to detect CA 19-9 on the captured protein, is indicated along the horizontal axis. b) Receiver-operator characteristic curve<br />
analysis comparing the biomarker performance of core protein versus glycan detection. Each curve gives the sensitivity (rate of true<br />
positive detection) and the specificity (rate of true negative detection) for discriminating cancer subjects from control subjects at various<br />
thresholds of discrimination. “AUC” is area-under-the-curve, indicating the total discriminating ability of each marker. c) Cluster analysis.<br />
The glycan measurements along the vertical axis were taken in the samples indicated along the horizontal axis; the color of each square<br />
is the level of each measurement (see the color bar). The rows and columns were ordered (clustered) by similarity, showing consistently<br />
increased levels in the cancer patients.<br />
27