
You also want an ePaper? Increase the reach of your titles
YUMPU automatically turns print PDFs into web optimized ePapers that Google loves.
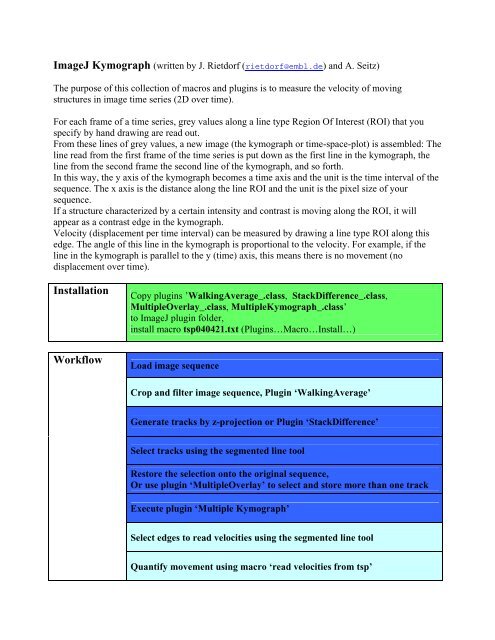
<strong>ImageJ</strong> <strong>Kymograph</strong> (written by J. Rietdorf (rietdorf@embl.de) and A. Seitz)<br />
The purpose of this collection of macros and plugins is to measure the velocity of moving<br />
structures in image time series (2D over time).<br />
For each frame of a time series, grey values along a line type Region Of Interest (ROI) that you<br />
specify by hand drawing are read out.<br />
From these lines of grey values, a new image (the kymograph or time-space-plot) is assembled: The<br />
line read from the first frame of the time series is put down as the first line in the kymograph, the<br />
line from the second frame the second line of the kymograph, and so forth.<br />
In this way, the y axis of the kymograph becomes a time axis and the unit is the time interval of the<br />
sequence. The x axis is the distance along the line ROI and the unit is the pixel size of your<br />
sequence.<br />
If a structure characterized by a certain intensity and contrast is moving along the ROI, it will<br />
appear as a contrast edge in the kymograph.<br />
Velocity (displacement per time interval) can be measured by drawing a line type ROI along this<br />
edge. The angle of this line in the kymograph is proportional to the velocity. For example, if the<br />
line in the kymograph is parallel to the y (time) axis, this means there is no movement (no<br />
displacement over time).<br />
Installation<br />
Workflow<br />
Copy plugins ’WalkingAverage_.class, StackDifference_.class,<br />
MultipleOverlay_.class, Multiple<strong>Kymograph</strong>_.class’<br />
to <strong>ImageJ</strong> plugin folder,<br />
install macro tsp040421.txt (Plugins…Macro…Install…)<br />
Load image sequence<br />
Crop and filter image sequence, Plugin ‘WalkingAverage’<br />
Generate tracks by z-projection or Plugin ‘StackDifference’<br />
Select tracks using the segmented line tool<br />
Restore the selection onto the original sequence,<br />
Or use plugin ‘MultipleOverlay’ to select and store more than one track<br />
Execute plugin ‘Multiple <strong>Kymograph</strong>’<br />
Select edges to read velocities using the segmented line tool<br />
Quantify movement using macro ‘read velocities from tsp’
Step by step procedure:<br />
• For the installation of <strong>ImageJ</strong> please refer to the instructions at<br />
http://rsb.info.nih.gov/ij/download.html<br />
• Copy ’WalkingAverage_.class, StackDifference_.class, MultipleOverlay_.class,<br />
Multiple<strong>Kymograph</strong>_.class’ to plugin folder. Install ‘tsp040421.txt’ (<strong>ImageJ</strong> Menu<br />
Plugins…Macro…Install…)<br />
• Start <strong>ImageJ</strong><br />
• Load a time series<br />
• Optional: Smooth the sequence by Median filtering or using the plugin<br />
‘WalkingAverage’.<br />
• Generate tracks by maximum or average projection or by using the<br />
StackDifference plugin which generates a stack of subtraction images and a<br />
projection of this stack.
maximum Z-projection of the sample image sequence<br />
average Z-projection of the sample image sequence<br />
• Select a segmented line ROI along one of the tracks in the image (example image<br />
inverted for better visualization of the ROI).<br />
inverted Z-projection ROI selection (yellow line)
• After selection using the segmented line tool, select the image window containing the<br />
original time sequence and restore the segmented line ROI.<br />
• Alternatively, use the plugin ‘MultipleOverlay’ to store the selected ROI in an overlay<br />
image and select further segmented lines in case you want to read out multiple tracks from<br />
one sequence.<br />
• Start the ‘Multiple<strong>Kymograph</strong>’ plugin. It will generate kymographs for all selections.
• Select a (segmented) line ROI along the structure of interest.<br />
• To read the velocities from the kymographs use either the LineAnalyzer plugin from the<br />
<strong>ImageJ</strong> homepage or use the ‘read velocities from tsp’ macro in tsp040221.txt. (This txtfile<br />
contains a selection of macros that offer a functionality similar to the plugins described<br />
above, installation: <strong>ImageJ</strong> Menu Plugins…Macro…Install…).<br />
• For each line interval of the segmented line selection the actual displacement in x<br />
(space) and y (time) direction, the sum of displacement in x (space) and y (time) direction,<br />
the actual and the average speed are plotted.