

Status and Future Directions of the - US Environmental Protection ...
Status and Future Directions of the - US Environmental Protection ...
Status and Future Directions of the - US Environmental Protection ...

Create successful ePaper yourself
Turn your PDF publications into a flip-book with our unique Google optimized e-Paper software.
41<br />
Percent<br />
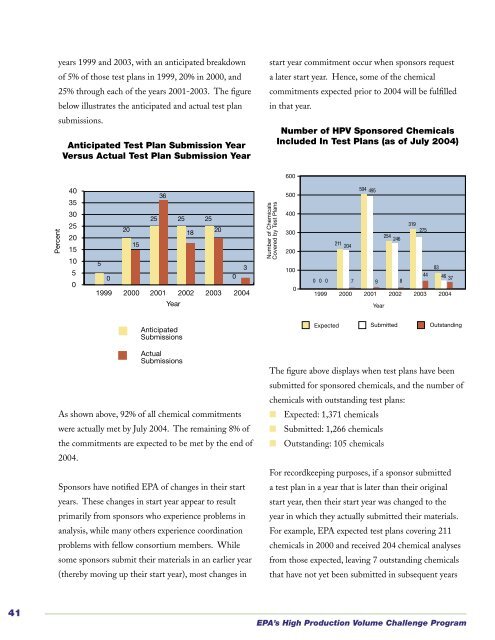
years 1999 <strong>and</strong> 2003, with an anticipated breakdown<br />
<strong>of</strong> 5% <strong>of</strong> those test plans in 1999, 20% in 2000, <strong>and</strong><br />
25% through each <strong>of</strong> <strong>the</strong> years 2001-2003. The figure<br />
below illustrates <strong>the</strong> anticipated <strong>and</strong> actual test plan<br />
submissions.<br />
Anticipated Test Plan Submission Year<br />
Versus Anticipated Actual Test Plan Plan Submission Submission Year Versus Year<br />
Actual Test Plan Submission Year<br />
40<br />
35<br />
30<br />
25<br />
20<br />
15<br />
10<br />
5<br />
0<br />
As shown above, 92% <strong>of</strong> all chemical commitments<br />
were actually met by July 2004. The remaining 8% <strong>of</strong><br />
<strong>the</strong> commitments are expected to be met by <strong>the</strong> end <strong>of</strong><br />
2004.<br />
5<br />
0<br />
20<br />
15<br />
Sponsors have notified EPA <strong>of</strong> changes in <strong>the</strong>ir start<br />
years. These changes in start year appear to result<br />
primarily from sponsors who experience problems in<br />
analysis, while many o<strong>the</strong>rs experience coordination<br />
problems with fellow consortium members. While<br />
25<br />
some sponsors submit <strong>the</strong>ir materials in an earlier year<br />
(<strong>the</strong>reby moving up <strong>the</strong>ir start year), most changes in<br />
36<br />
1999 2000 2001 2002 2003 2004<br />
Year<br />
25<br />
Anticipated<br />
Submissions<br />
Actual<br />
Submissions<br />
18<br />
25<br />
20<br />
0<br />
3<br />
start year commitment occur when sponsors request<br />
a later start year. Hence, some <strong>of</strong> <strong>the</strong> chemical<br />
commitments expected prior to 2004 will be fulfilled<br />
in that year.<br />
Number <strong>of</strong> Chemicals<br />
Covered by Test Plans<br />
Number <strong>of</strong> HPV Sponsored Chemicals<br />
Included In Test Plans (as <strong>of</strong> July 2004)<br />
600<br />
500<br />
400<br />
300<br />
200<br />
100<br />
0<br />
0 0 0<br />
The figure above displays when test plans have been<br />
submitted for sponsored chemicals, <strong>and</strong> <strong>the</strong> number <strong>of</strong><br />
chemicals with outst<strong>and</strong>ing test plans:<br />
■ Expected: 1,371 chemicals<br />
Number <strong>of</strong> HPV Sponsored Chemicals<br />
Included In Test Plans (as <strong>of</strong> July 2004)<br />
1999 2000 2001 2002 2003 2004<br />
Expected<br />
211 204<br />
■ Submitted: 1,266 chemicals<br />
■ Outst<strong>and</strong>ing: 105 chemicals<br />
7<br />
504 495<br />
For recordkeeping purposes, if a sponsor submitted<br />
a test plan in a year that is later than <strong>the</strong>ir original<br />
start year, <strong>the</strong>n <strong>the</strong>ir start year was changed to <strong>the</strong><br />
year in which <strong>the</strong>y actually submitted <strong>the</strong>ir materials.<br />
For example, EPA expected test plans covering 211<br />
chemicals in 2000 <strong>and</strong> received 204 chemical analyses<br />
from those expected, leaving 7 outst<strong>and</strong>ing chemicals<br />
that have not yet been submitted in subsequent years<br />
EPA’s High Production Volume Challenge Program<br />
9<br />
Year<br />
254 246<br />
Submitted<br />
8<br />
319<br />
275<br />
44<br />
83<br />
46 37<br />
Outst<strong>and</strong>ing<br />
– <strong>the</strong> start year for <strong>the</strong>se chemicals will be changed<br />
to reflect <strong>the</strong> year in which actual submissions occur.<br />
As <strong>the</strong> chart reflects, <strong>the</strong> largest number <strong>of</strong> chemicals<br />
expected <strong>and</strong> received occurred in 2001, with 504<br />
chemicals expected <strong>and</strong> 495 chemicals received.<br />
Since <strong>the</strong>re are a total <strong>of</strong> 105 outst<strong>and</strong>ing chemicals,<br />
it is anticipated that many <strong>of</strong> <strong>the</strong> sponsors <strong>of</strong> <strong>the</strong>se<br />
chemicals will submit materials by <strong>the</strong> end <strong>of</strong> 2004.<br />
Sponsors <strong>of</strong> late chemicals have been notified that<br />
test plans <strong>and</strong> robust summaries for <strong>the</strong>se chemicals<br />
have passed <strong>the</strong> start year to which <strong>the</strong> sponsor had<br />
committed.<br />
Data Submitted to <strong>the</strong> HPV Challenge Program in<br />
Test Plans<br />
As discussed earlier, <strong>the</strong> primary impetus for <strong>the</strong><br />
HPV Challenge Program was <strong>the</strong> consistent results <strong>of</strong><br />
reports from <strong>Environmental</strong> Defense, <strong>the</strong> American<br />
Chemistry Council, <strong>and</strong> EPA that publicly available<br />
hazard data were lacking on a majority <strong>of</strong> <strong>the</strong> 2,782<br />
1990 HPV chemicals. Following EPA’s guidance,<br />
sponsors identify existing data on HPV chemicals <strong>and</strong><br />
submit <strong>the</strong>se data in <strong>the</strong> form <strong>of</strong> robust summaries <strong>and</strong><br />
test plans. To determine <strong>the</strong> source <strong>of</strong> existing data<br />
included in test plan submissions (that is, published<br />
<strong>and</strong> publicly available at some level, or unpublished<br />
data), each test plan posted on <strong>the</strong> HPV website,<br />
for which comments were due through June 2004,<br />
was examined – accounting for 344 test plans. This<br />
examination revealed that an extremely large amount<br />
<strong>of</strong> previously unavailable data has been submitted in<br />
test plans <strong>and</strong> robust summaries <strong>and</strong> is now publicly<br />
available. The figure to <strong>the</strong> right illustrates <strong>the</strong> number<br />
<strong>of</strong> studies that were published <strong>and</strong> unpublished.<br />
<strong>Status</strong> <strong>and</strong> <strong>Future</strong> <strong>Directions</strong><br />
Sources <strong>of</strong> Existing Data Submitted in<br />
Test Plans (as <strong>of</strong> June 2004)<br />
4,800<br />
6,801<br />
Published Studies<br />
(4,800) (41%)<br />
Unpublished Studies<br />
(6,801) (59%)<br />
The table on <strong>the</strong> following page shows <strong>the</strong> numbers<br />
<strong>of</strong> published <strong>and</strong> unpublished studies broken down by<br />
ecological <strong>and</strong> human health endpoints, <strong>and</strong> selected<br />
physicochemical <strong>and</strong> environmental fate endpoints;<br />
some endpoints are routinely determined with<br />
estimation techniques. The numbers <strong>of</strong> published<br />
<strong>and</strong> unpublished studies documented in <strong>the</strong> robust<br />
summaries prepared for each SIDS endpoint are listed.<br />
42


