Gotthard base tunnel rock burst phenomena in a fault zone ...
Gotthard base tunnel rock burst phenomena in a fault zone ...
Gotthard base tunnel rock burst phenomena in a fault zone ...

You also want an ePaper? Increase the reach of your titles
YUMPU automatically turns print PDFs into web optimized ePapers that Google loves.
5.3 Specification of the model design load<strong>in</strong>g wave<br />
The work group ‘Micro Tremors’ decided to<br />
consider the M2.4 micro tremor of 25 March 2006<br />
as the decisive design – tremor. For the seismic<br />
model load<strong>in</strong>g of the <strong>in</strong>put wave correspond<strong>in</strong>g to<br />
the design tremor had first to be specified. With this<br />
decision a conservative dynamic load was selected<br />
<strong>in</strong> order to control the safety and stability of the<br />
<strong>tunnel</strong>s under operation <strong>in</strong> case of a micro tremor <strong>in</strong><br />
the area of the <strong>tunnel</strong>s. The emitted wave at the<br />
tremor’s source first had to pass the <strong>tunnel</strong> system<br />
and the <strong>fault</strong> <strong>zone</strong> prior to arrive at measur<strong>in</strong>g<br />
station MFS-A. To determ<strong>in</strong>e the waves attenuation<br />
10 times amplified measured particle velocities<br />
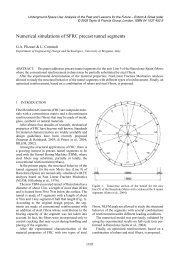
Figure 11. 2D – Model1 and Model 2 with 2 and 1 layers of kakirite <strong>in</strong> the <strong>fault</strong>’s kernel<br />
Figure 12. Left: 3D Model. Right: Vx Horizontal cut through the model with po<strong>in</strong>t P41 simulat<strong>in</strong>g approximately<br />
the MFS-A. The curves refer to the Vx <strong>in</strong>put particle velocity and the Vx at P41. ∆t is the<br />
wave’s travel time from the model’s load boundary to Po<strong>in</strong>t P41.<br />
426<br />
were applied at the eastern boundary of the 3D<br />
model. With this load the particle velocities <strong>in</strong> a<br />
model po<strong>in</strong>t simulat<strong>in</strong>g the MFS-A were <strong>in</strong><br />
magnitude similar to those of the measured signal<br />
(Figure 12). The dynamic design load was therefore<br />
determ<strong>in</strong>ed as the 10 times amplified measured<br />
signal (Figure 10) with a peak Vx -velocity<br />
component of 0.23 m/s. This design load covers the<br />
strongest micro tremor identified s<strong>in</strong>ce start<strong>in</strong>g the<br />
extended seismic monitor<strong>in</strong>g <strong>in</strong> the MFS Faido<br />
(Figure 7) and is conservative. Figure 12 shows the<br />
3D model used. In the diagram the design load’s Vx<br />
particle velocity is compared to the signal received<br />
<strong>in</strong> model po<strong>in</strong>t P41 simulat<strong>in</strong>g the location of the<br />
MFS-A.