Gotthard base tunnel rock burst phenomena in a fault zone ...
Gotthard base tunnel rock burst phenomena in a fault zone ...
Gotthard base tunnel rock burst phenomena in a fault zone ...

You also want an ePaper? Increase the reach of your titles
YUMPU automatically turns print PDFs into web optimized ePapers that Google loves.
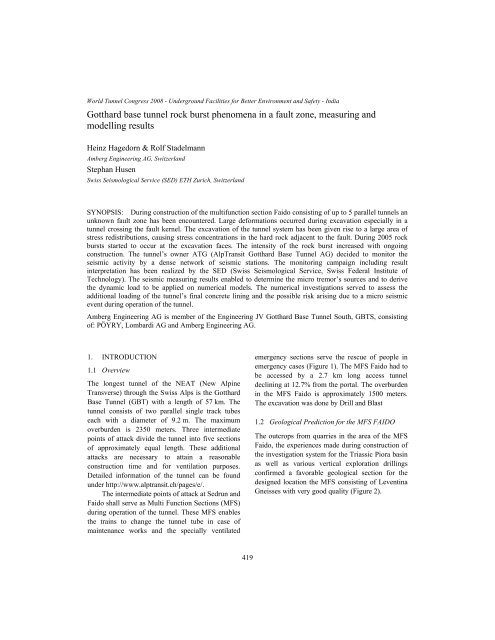
World Tunnel Congress 2008 - Underground Facilities for Better Environment and Safety - India<br />
<strong>Gotthard</strong> <strong>base</strong> <strong>tunnel</strong> <strong>rock</strong> <strong>burst</strong> <strong>phenomena</strong> <strong>in</strong> a <strong>fault</strong> <strong>zone</strong>, measur<strong>in</strong>g and<br />
modell<strong>in</strong>g results<br />
He<strong>in</strong>z Hagedorn & Rolf Stadelmann<br />
Amberg Eng<strong>in</strong>eer<strong>in</strong>g AG, Switzerland<br />
Stephan Husen<br />
Swiss Seismological Service (SED) ETH Zurich, Switzerland<br />
SYNOPSIS: Dur<strong>in</strong>g construction of the multifunction section Faido consist<strong>in</strong>g of up to 5 parallel <strong>tunnel</strong>s an<br />
unknown <strong>fault</strong> <strong>zone</strong> has been encountered. Large deformations occurred dur<strong>in</strong>g excavation especially <strong>in</strong> a<br />
<strong>tunnel</strong> cross<strong>in</strong>g the <strong>fault</strong> kernel. The excavation of the <strong>tunnel</strong> system has been given rise to a large area of<br />
stress redistributions, caus<strong>in</strong>g stress concentrations <strong>in</strong> the hard <strong>rock</strong> adjacent to the <strong>fault</strong>. Dur<strong>in</strong>g 2005 <strong>rock</strong><br />
<strong>burst</strong>s started to occur at the excavation faces. The <strong>in</strong>tensity of the <strong>rock</strong> <strong>burst</strong> <strong>in</strong>creased with ongo<strong>in</strong>g<br />
construction. The <strong>tunnel</strong>’s owner ATG (AlpTransit <strong>Gotthard</strong> Base Tunnel AG) decided to monitor the<br />
seismic activity by a dense network of seismic stations. The monitor<strong>in</strong>g campaign <strong>in</strong>clud<strong>in</strong>g result<br />
<strong>in</strong>terpretation has been realized by the SED (Swiss Seismological Service, Swiss Federal Institute of<br />
Technology). The seismic measur<strong>in</strong>g results enabled to determ<strong>in</strong>e the micro tremor’s sources and to derive<br />
the dynamic load to be applied on numerical models. The numerical <strong>in</strong>vestigations served to assess the<br />
additional load<strong>in</strong>g of the <strong>tunnel</strong>’s f<strong>in</strong>al concrete l<strong>in</strong><strong>in</strong>g and the possible risk aris<strong>in</strong>g due to a micro seismic<br />
event dur<strong>in</strong>g operation of the <strong>tunnel</strong>.<br />
Amberg Eng<strong>in</strong>eer<strong>in</strong>g AG is member of the Eng<strong>in</strong>eer<strong>in</strong>g JV <strong>Gotthard</strong> Base Tunnel South, GBTS, consist<strong>in</strong>g<br />
of: PÖYRY, Lombardi AG and Amberg Eng<strong>in</strong>eer<strong>in</strong>g AG.<br />
1. INTRODUCTION<br />
1.1 Overview<br />
The longest <strong>tunnel</strong> of the NEAT (New Alp<strong>in</strong>e<br />
Transverse) through the Swiss Alps is the <strong>Gotthard</strong><br />
Base Tunnel (GBT) with a length of 57 km. The<br />
<strong>tunnel</strong> consists of two parallel s<strong>in</strong>gle track tubes<br />
each with a diameter of 9.2 m. The maximum<br />
overburden is 2350 meters. Three <strong>in</strong>termediate<br />
po<strong>in</strong>ts of attack divide the <strong>tunnel</strong> <strong>in</strong>to five sections<br />
of approximately equal length. These additional<br />
attacks are necessary to atta<strong>in</strong> a reasonable<br />
construction time and for ventilation purposes.<br />
Detailed <strong>in</strong>formation of the <strong>tunnel</strong> can be found<br />
under http://www.alptransit.ch/pages/e/.<br />
The <strong>in</strong>termediate po<strong>in</strong>ts of attack at Sedrun and<br />
Faido shall serve as Multi Function Sections (MFS)<br />
dur<strong>in</strong>g operation of the <strong>tunnel</strong>. These MFS enables<br />
the tra<strong>in</strong>s to change the <strong>tunnel</strong> tube <strong>in</strong> case of<br />
ma<strong>in</strong>tenance works and the specially ventilated<br />
419<br />
emergency sections serve the rescue of people <strong>in</strong><br />
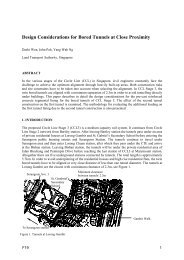
emergency cases (Figure 1). The MFS Faido had to<br />
be accessed by a 2.7 km long access <strong>tunnel</strong><br />
decl<strong>in</strong><strong>in</strong>g at 12.7% from the portal. The overburden<br />
<strong>in</strong> the MFS Faido is approximately 1500 meters.<br />
The excavation was done by Drill and Blast<br />
1.2 Geological Prediction for the MFS FAIDO<br />
The outcrops from quarries <strong>in</strong> the area of the MFS<br />
Faido, the experiences made dur<strong>in</strong>g construction of<br />
the <strong>in</strong>vestigation system for the Triassic Piora bas<strong>in</strong><br />
as well as various vertical exploration drill<strong>in</strong>gs<br />
confirmed a favorable geological section for the<br />
designed location the MFS consist<strong>in</strong>g of Levent<strong>in</strong>a<br />
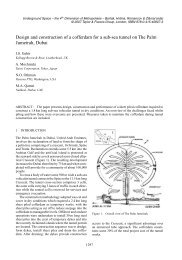
Gneisses with very good quality (Figure 2).
Cross cavern<br />
East Tube EON<br />
West Tube EWN<br />
Figure 1 Schematic orig<strong>in</strong>al layout of the multifunction section at Faido.<br />
0 km<br />
57 km<br />
420<br />
MFS Faido<br />
Figure 2. Geology along the <strong>Gotthard</strong> Base Tunnel consist<strong>in</strong>g ma<strong>in</strong>ly of gneiss and granite.<br />
MFS Faido is located <strong>in</strong> the Levent<strong>in</strong>a Gneiss of very good quality<br />
1.3 Actual Geology <strong>in</strong> the area of the MFS Faido<br />
Dur<strong>in</strong>g construction of the cross cavern (Figure 1) a<br />
break down of f<strong>in</strong>e gra<strong>in</strong>ed quartz occurred <strong>in</strong> the<br />
cavern’s roof form<strong>in</strong>g a cavity of 8 meters <strong>in</strong> height.<br />
The results of an extensive drill holes campaign<br />
together with seismic reflection measurements<br />
effectuated dur<strong>in</strong>g construction revealed an<br />
unknown large <strong>fault</strong> system <strong>in</strong> the area of the MFS<br />
Faido. The ma<strong>in</strong> kernel of this <strong>fault</strong> strikes at an<br />
average angle of about 15° to the <strong>tunnel</strong> axis and<br />
dips at about 80°. The <strong>fault</strong> system encountered<br />
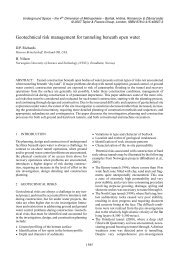
dur<strong>in</strong>g construction is shown <strong>in</strong> Figure 3. In the<br />
<strong>fault</strong>’s kernel, layers of partially completely<br />
decomposed <strong>rock</strong> (kakitrite) are embedded.<br />
Adjacent to the east of the <strong>fault</strong> hard and brittle<br />
Levent<strong>in</strong>a gneiss is located. To the west of the <strong>fault</strong><br />
the <strong>rock</strong> mass consists of hard but less brittle<br />
Lucomagno gneiss.<br />
2. DIFFICULTIES DURING CONSTRUCTION<br />
Dur<strong>in</strong>g the first rebuild<strong>in</strong>g of the EWN tube to the<br />
north of the cross cavern (Figure 1) a support<br />
consist<strong>in</strong>g of steel arches HEM 200 backfilled with<br />
40 cm concrete was <strong>in</strong>stalled immediately after each<br />
excavation step of 1 m. This rigid support was<br />
<strong>in</strong>tended to cater for the heavy pressure and<br />
especially to protect workforce from break outs at<br />
the face. In the rebuilt section, on a length of 250 m<br />
(Figure 3) the load<strong>in</strong>g of the support however gave<br />
rise to radial displacements of up to 1 m. Stra<strong>in</strong>
North<br />
EON tube<br />
EWN tube<br />
Area of <strong>in</strong>creased<br />
<strong>rock</strong> <strong>burst</strong>s<br />
800 m<br />
Cross section for<br />
2D model<strong>in</strong>g<br />
421<br />
Fault’s kernel<br />
Cross Cavern<br />
Access <strong>tunnel</strong><br />
East<br />
West<br />
Rescue Station<br />
South<br />
Figure 3. Actual geology recognized by January 2003. Fault’s kernel with <strong>in</strong>tensively jo<strong>in</strong>ted <strong>rock</strong> to both sides of the<br />
kernel. As a consequence the crossover has been shifted to the south (Figure 1).<br />
measurements revealed yield<strong>in</strong>g of the steel arches<br />
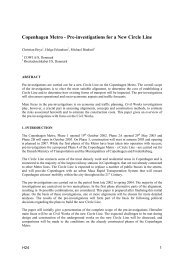
already Figure 4 days after backfill<strong>in</strong>g[1]. Severe<br />
damage of the support developed (Figure 4) and the<br />
critical section had aga<strong>in</strong> to be rebuilt with an<br />
enlarged excavation radius of 1.5 m to allow for<br />
additional displacements. A flexible support has<br />
been <strong>in</strong>stalled us<strong>in</strong>g TH profiles with slid<strong>in</strong>g<br />
connections. Shotcrete slots were left open for<br />
unh<strong>in</strong>dered slid<strong>in</strong>g of the arches and for avoid<strong>in</strong>g<br />
damage of the shorcrete l<strong>in</strong><strong>in</strong>g due to further<br />
movements (Figure 5).<br />
Figure 4. Sheared off steel arch <strong>in</strong> the <strong>in</strong>vert<br />
3. NUMERICAL SIMULATION OF THE<br />
STATIC LOAD CASE<br />
In order to better understand the failure mechanisms<br />
<strong>in</strong> the area around the <strong>tunnel</strong>s of the MFS numerical<br />
model<strong>in</strong>g was carried out. The model section is<br />
Figure 5. Rebuild<strong>in</strong>g of the critical section with enlarged<br />
profile and slots <strong>in</strong> the concrete l<strong>in</strong><strong>in</strong>g<br />
<strong>in</strong>dicated <strong>in</strong> Figure 3. From the known geology it<br />
was obvious that a discont<strong>in</strong>uum model with<br />
deformable blocks had to be used <strong>in</strong> order to<br />
recognize the <strong>in</strong>fluence of the discont<strong>in</strong>uities and<br />
the kakirite <strong>zone</strong>s on the stability of the <strong>tunnel</strong><br />
section. For this purpose the program UDEC,<br />
developed by ITASCA was used. The <strong>in</strong>vestigation<br />
was <strong>base</strong>d on a parametric study compris<strong>in</strong>g the<br />
variation of <strong>rock</strong> and jo<strong>in</strong>t properties. The model is<br />
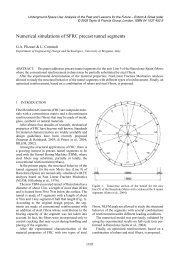
shown <strong>in</strong> Figure 6. The different <strong>fault</strong> regions <strong>in</strong> the<br />
model have been selected accord<strong>in</strong>g to the<br />
geologist’s f<strong>in</strong>d<strong>in</strong>gs <strong>base</strong>d on <strong>in</strong>terpretation of<br />
numerous borehole results. From overburden, <strong>rock</strong><br />
mass density and gravity a primary pr<strong>in</strong>cipal stress<br />
level of σyy=42 MPa and σxx = 21 MPa was<br />
def<strong>in</strong>ed at the top of the model. In Figure 6 the<br />
vertical stresses yy are represented. The results
clearly show a considerable extension of the stress<br />
redistribution due to the excavation of the <strong>tunnel</strong>s.<br />
In the area of the middle <strong>tunnel</strong> EWN both the σxx<br />
and σyy stresses decreased to approximately 10<br />
MPa. A general stress reduction occurred around all<br />
of the three <strong>tunnel</strong>s. To the east of the <strong>fault</strong> <strong>in</strong> the<br />
hard brittle gneiss a stress concentration is<br />
extend<strong>in</strong>g beneath the <strong>tunnel</strong> along the <strong>fault</strong>’s<br />
eastern boundary The stress concentration at <strong>tunnel</strong><br />
level amounts to yy = 60 to 80 MPa (Figure 6). The<br />
area of this stress is <strong>in</strong> accordance with the<br />
hypocenters of the micro tremors (Figure 8).<br />
Kernel Intensively<br />
jo<strong>in</strong>ted<br />
Hard <strong>rock</strong>, brittle<br />
Stress<br />
concentration<br />
West East<br />
Y Medium hard<br />
<strong>rock</strong><br />
X<br />
Figure 6. Static load case: Distribution of the<br />
vertical stresses σyy<br />
4. MICRO TREMORS<br />
4.1 Development of the seismic activity<br />
In this paper, we def<strong>in</strong>e micro tremors as a seismic<br />
event generally occurr<strong>in</strong>g at a larger distance from<br />
the <strong>tunnel</strong> (few hundred meters) whereas a <strong>rock</strong><br />
<strong>burst</strong> occurs <strong>in</strong> the direct vic<strong>in</strong>ity of the <strong>tunnel</strong>.<br />
Dur<strong>in</strong>g 2004 <strong>rock</strong> <strong>burst</strong>s took place ma<strong>in</strong>ly at the<br />
face of the EON (Figure 3) to the north of the cross<br />
cavern (Figure 1). Most of these <strong>burst</strong>s (ca. 75%)<br />
occurred approximately Figure 3 hours after<br />
blast<strong>in</strong>g. Dur<strong>in</strong>g 2005 <strong>in</strong>tensive <strong>rock</strong> <strong>burst</strong>s<br />
happened <strong>in</strong>dependently of the excavation <strong>in</strong> the<br />
back area of the eastern tube giv<strong>in</strong>g rise to partially<br />
severe damage of the support. Constructional<br />
adaptations of the support and exclud<strong>in</strong>g critical<br />
<strong>tunnel</strong> sections for access were required to provide<br />
for the safety of workforce and equipment [2].<br />
Between March 2004 and June 2005 the Swiss<br />
422<br />
Seismological Service (SED) recorded an<br />
accumulation of seismic activity <strong>in</strong> the area of the<br />
MFS Faido, a region which normally shows a very<br />
low seismicity. Dur<strong>in</strong>g the above mentioned period<br />
the permanently <strong>in</strong>stalled Swiss Digital Seismic<br />
Network (SDSNet) registered 10 seismic events<br />
with local magnitudes ML between 0.9 and 1.9.<br />
With the SDSNet located at the surface, the<br />
epicenters could be associated with the area of the<br />
MFS Faido with<strong>in</strong> an accuracy of one kilometer.<br />
Together with the M1.9 tremor of 1.6.2005 a strong<br />
<strong>rock</strong> <strong>burst</strong> could be associated. The same holds for<br />
two additional tremors of similar magnitude. On the<br />
other hand no relations to <strong>rock</strong> <strong>burst</strong>s could be<br />
identified for tremors dur<strong>in</strong>g the period March to<br />
April 2004. S<strong>in</strong>ce it could not be excluded that the<br />
accumulation of the tremors correlated with the<br />
construction of the MFS Faido the owner ATG<br />
decided <strong>in</strong> July 2005 to form a Work Group ’Micro<br />
tremors’ consist<strong>in</strong>g of representatives from the<br />
Swiss Seismological Service (SED), Geology,<br />
Eng<strong>in</strong>eer<strong>in</strong>g jo<strong>in</strong>t venture GBTS, Supervision and<br />
ATG, the owner of the <strong>tunnel</strong>. On March 25, 2006<br />
the strongest micro tremor of ML 2.4 was registered.<br />
This tremor was felt by the <strong>in</strong>habitants of the village<br />
Faido close to the jobsite. This tremor triggered a<br />
stress drop nearby the EON caus<strong>in</strong>g heav<strong>in</strong>g <strong>in</strong> the<br />
<strong>in</strong>vert.<br />
4.2 Additional seismic measur<strong>in</strong>g stations<br />
With first priority, additional seismic stations were<br />
<strong>in</strong>stalled at the surface and <strong>in</strong> the MFS Faido. For<br />
precise monitor<strong>in</strong>g and location of the seismic<br />
activity a special local seismic network consist<strong>in</strong>g<br />
of n<strong>in</strong>e stations at the surface, <strong>in</strong>clud<strong>in</strong>g one station<br />
from the SDSNet, were <strong>in</strong>stalled <strong>in</strong> a circular<br />
arrangement 10 to 15 km around the MFS Faido. In<br />
addition, two additional stations were <strong>in</strong>stalled at<br />
different locations <strong>in</strong> the <strong>tunnel</strong>s of the MFS Faido.<br />
The circular position of the seismic measur<strong>in</strong>g<br />
equipment allows a precise determ<strong>in</strong>ation of the<br />
epicenters whereas the measur<strong>in</strong>g stations directly<br />
above and <strong>in</strong>side the MFS Faido serve the<br />
evaluation of the depths of the micro tremors’<br />
sources. The read<strong>in</strong>gs of the measur<strong>in</strong>g stations<br />
were <strong>in</strong>tegrated <strong>in</strong> the SED’s data acquisition<br />
system. The real time transmission of the measur<strong>in</strong>g<br />
data guaranteed a cont<strong>in</strong>uous survey of the seismic<br />
activity allow<strong>in</strong>g for an immediate alert of the<br />
responsible organizations such as ATG, supervision<br />
and authorities <strong>in</strong> case of a strong tremor. This was
of particular importance <strong>in</strong> case of the M2.4 tremor<br />
occurr<strong>in</strong>g on 25.03.2006. Accurate seismic wave<br />
velocities required for the hypocenter’s<br />
determ<strong>in</strong>ations were derived from two calibration<br />
shots carried out <strong>in</strong> the MFS Faido. An average Pwave<br />
velocity of 5.33 km/s was calculated.<br />
4.3 Chronology of the seismic events<br />
Figure 7 shows the development of the recorded<br />
micro tremors’ number and magnitudes as functions<br />
of time. The highest seismic activity took place<br />
dur<strong>in</strong>g December 2005, March 2006 and Mai 2006.<br />
The highest magnitude of 2.4 occurred on 25 th<br />
March 2006. Dur<strong>in</strong>g the period from October 2005<br />
to February 2008 a total of 112 micro tremors were<br />
recorded. The magnitudes of most of the tremors<br />
were below 1.0. With term<strong>in</strong>ation of excavation <strong>in</strong><br />
the MFS Faido the micro tremors’ number and<br />
magnitudes decreased cont<strong>in</strong>uously. S<strong>in</strong>ce<br />
September 2007 no more micro tremors have been<br />
recorded above the measur<strong>in</strong>g threshold of M = -1.0<br />
<strong>in</strong> the area of the MFS Faido.<br />
Figure 7. Chronological development of number and magnitudes of the micro tremors (with courtesy form SED)<br />
423<br />
4.4 Epicenters<br />
The epicenters of all registered micro tremors<br />
dur<strong>in</strong>g Oct. 2005 to Feb. 2008 are depicted <strong>in</strong><br />
Figure 8. The micro tremors are concentrated <strong>in</strong> the<br />
<strong>rock</strong> mass to the north of the MFS Faido close to<br />
the eastern part of the <strong>tunnel</strong> system. The accuracy<br />
of the epicenters’ localization is less than 100 m and<br />
less than 250 m <strong>in</strong> focal depth as determ<strong>in</strong>ed by<br />
relocation of the calibration shots. With<strong>in</strong> the error<br />
ellipsoid the tremors’ sources are at <strong>tunnel</strong> level.<br />
4.5 Impacts of <strong>rock</strong> <strong>burst</strong>s on the <strong>tunnel</strong><br />
The <strong>rock</strong> <strong>burst</strong>’s damage potential is illustrated <strong>in</strong><br />
Figure.9. The picture to the left shows the damage<br />
of the support with a shotcrete plate ejected <strong>in</strong>to the<br />
EON. This <strong>rock</strong> <strong>burst</strong> occurred together with the<br />
M1.9 micro tremor of July 2005. The EON’s <strong>in</strong>vert<br />
heave <strong>in</strong> the picture to the right was caused by the<br />
M2.4 micro tremor of 25.03.2006. Due to the<br />
seismic impact the <strong>in</strong>vert heave was smaller than it<br />
is shown <strong>in</strong> the picture taken 2 days later.
4.6 Measured particle velocities V for the design<br />
micro tremor at station MFS-A<br />
In Figure 10 the measured particle velocities V<br />
registered at the station MFS-A (Figure 3 and<br />
Figure 8) for the M2.4 micro tremor on 25.03.2006<br />
are presented. In the diagram the velocity<br />
components Vx, Vy and Vz are shown. The<br />
orientations of the X-, Y-, and Z – coord<strong>in</strong>ates<br />
correspond to those of the model coord<strong>in</strong>ates. The<br />
maximum measured amplitude amount<strong>in</strong>g to 0.024<br />
m/s was <strong>in</strong> the horizontal X – direction normal to<br />
the <strong>tunnel</strong> axis. The total measur<strong>in</strong>g <strong>in</strong>terval was 1<br />
sec. The relevant vibration starts at 0.193 sec after<br />
the measurement’s trigger<strong>in</strong>g. The dynamic load for<br />
the model computations started at that same time to<br />
reduce computation time and amount of data.<br />
4.7 F<strong>in</strong>d<strong>in</strong>gs form the seismic measurements<br />
The micro tremors <strong>in</strong> the northern part of the MFS<br />
East tube, EON<br />
West tube, EWN<br />
M2.4<br />
Measur<strong>in</strong>g station MFS-B<br />
East<br />
Measur<strong>in</strong>g station MFS-A<br />
Figure 8. Epicenters of the micro tremors from Oct. 2005 to Feb. 2008 (with courtesy form SED)<br />
424<br />
tend to form clusters i.e. the sources of several<br />
tremors are located with<strong>in</strong> the same area.<br />
Consider<strong>in</strong>g the predom<strong>in</strong>ant steep west - east<br />
dipp<strong>in</strong>g jo<strong>in</strong>t system strik<strong>in</strong>g sub parallel to the<br />
<strong>tunnel</strong> axis (Figure 3 and Figure 6) shear failures<br />
along jo<strong>in</strong>ts are most likely. The micro tremor’s<br />
source locations <strong>in</strong> the hard Levent<strong>in</strong>a gneiss to the<br />
east of the <strong>fault</strong> corresponds to the location of the<br />
vertical stress concentrations result<strong>in</strong>g from the<br />
computations of the static load case <strong>in</strong> Figure 6.<br />
There is a general tendency of the micro tremors to<br />
move together with the excavation of the <strong>tunnel</strong>s<br />
form the cross cavern’s area to the north. Very few<br />
micro tremors occurred <strong>in</strong> the southern part of the<br />
MFS Faido; these events occurred outside the<br />
region shown <strong>in</strong> Figure 8. Many of the <strong>rock</strong> <strong>burst</strong>s<br />
caus<strong>in</strong>g the support’s damages <strong>in</strong> the <strong>tunnel</strong>s were<br />
triggered by the micro tremors.<br />
Date<br />
01.06.2005 25.03.2006/ Photo: 27.03.2006<br />
Figure 9. Left: Rock <strong>burst</strong> of 01.06.05: Damage of the support’s shotcrete, EON (on this date no seismic registration<br />
was <strong>in</strong>stalled). Right: M2.4 micro tremor of 25.03.2006: <strong>in</strong>vert – heave, EON.
5. DYNAMIC MODELLING<br />
5.1 Aims of modell<strong>in</strong>g<br />
The aim of the numerical model<strong>in</strong>g was to provide<br />
basic appraisals with respect to the structural safety<br />
and usability of the <strong>tunnel</strong>s dur<strong>in</strong>g and after a<br />
seismic event. The <strong>in</strong>vestigation’s result should<br />
furthermore disclose the residual risks to be<br />
accepted and its impact potential on the <strong>tunnel</strong>s<br />
concrete l<strong>in</strong><strong>in</strong>gs. The structural design has been<br />
completed prior to the occurrence of <strong>rock</strong> <strong>burst</strong>s.<br />
Therefore, it had to be controlled whether the l<strong>in</strong><strong>in</strong>g<br />
designed for the static load case still fulfills the<br />
<strong>tunnel</strong>s’ safety and usability requirements dur<strong>in</strong>g<br />
and after a micro tremor’s impact.<br />
5.2 Computational methods and models<br />
For the <strong>in</strong>vestigation 2D and 3D models were<br />
applied us<strong>in</strong>g the discont<strong>in</strong>uum codes UDEC and<br />
3DEC (ITASCA, [3]). Discont<strong>in</strong>uum models were<br />
used to consider block movements (rigid body<br />
movements) <strong>in</strong> the jo<strong>in</strong>ted <strong>rock</strong> mass. The blocks<br />
themselves are deformable. Due to the high<br />
computation time parametric studies were not<br />
possible with the 3D model. For parametric studies<br />
2D – models were used <strong>in</strong>stead. The results<br />
Particle Velocities V (m/sec)<br />
0.03<br />
0.02<br />
0.01<br />
0.00<br />
0.0 0.2 0.4 0.6 0.8 1.0<br />
-0.01<br />
-0.02<br />
-0.03<br />
Start of Computations<br />
Vy<br />
Vx<br />
Vz<br />
Time t (s)<br />
Figure 10.<br />
425<br />
presented refer solely to the dynamic load case. In a<br />
first step the static equilibrium of the supported<br />
<strong>tunnel</strong> system was computed. In a second step the<br />
f<strong>in</strong>al l<strong>in</strong><strong>in</strong>g was <strong>in</strong>serted <strong>in</strong> the model and the design<br />
micro tremor’s load superimposed to the static case.<br />
The properties for the <strong>rock</strong> and the two major jo<strong>in</strong>t<br />
systems were specified together with the geologists.<br />
A jo<strong>in</strong>t spac<strong>in</strong>g of 2 m was used for the <strong>fault</strong>’s<br />
kernel <strong>zone</strong>. The real jo<strong>in</strong>t spac<strong>in</strong>g <strong>in</strong> the kernel is<br />
much smaller which was accounted for by<br />
correspond<strong>in</strong>gly reduc<strong>in</strong>g the <strong>rock</strong>’s properties.<br />
Weak <strong>rock</strong> properties were assigned to the layers<br />
conta<strong>in</strong><strong>in</strong>g kakirites (Figure 11). For model<strong>in</strong>g<br />
support and f<strong>in</strong>al l<strong>in</strong><strong>in</strong>g <strong>in</strong> the 2D models block<br />
elements and structural bar elements were used.<br />
Special <strong>in</strong>vestigations have shown the deviation of<br />
seismic waves along weak <strong>rock</strong> formations.<br />
Therefore two different 2D models with one and<br />
with two kakirit layers (Figure 11), respectively,<br />
were <strong>in</strong>vestigated. The results from these models<br />
reveal the <strong>in</strong>fluence of a <strong>tunnel</strong>’s distance from a<br />
kakirite layer on the dynamic load<strong>in</strong>g of its l<strong>in</strong>er <strong>in</strong><br />
case of a micro tremor. With Model1 a stress drop<br />
<strong>in</strong> the vic<strong>in</strong>ity of the EON was <strong>in</strong>itiated. The results<br />
reveal the impact of such an event on the <strong>tunnel</strong><br />
l<strong>in</strong><strong>in</strong>g.<br />
Z<br />
Y<br />
X
5.3 Specification of the model design load<strong>in</strong>g wave<br />
The work group ‘Micro Tremors’ decided to<br />
consider the M2.4 micro tremor of 25 March 2006<br />
as the decisive design – tremor. For the seismic<br />
model load<strong>in</strong>g of the <strong>in</strong>put wave correspond<strong>in</strong>g to<br />
the design tremor had first to be specified. With this<br />
decision a conservative dynamic load was selected<br />
<strong>in</strong> order to control the safety and stability of the<br />
<strong>tunnel</strong>s under operation <strong>in</strong> case of a micro tremor <strong>in</strong><br />
the area of the <strong>tunnel</strong>s. The emitted wave at the<br />
tremor’s source first had to pass the <strong>tunnel</strong> system<br />
and the <strong>fault</strong> <strong>zone</strong> prior to arrive at measur<strong>in</strong>g<br />
station MFS-A. To determ<strong>in</strong>e the waves attenuation<br />
10 times amplified measured particle velocities<br />
Figure 11. 2D – Model1 and Model 2 with 2 and 1 layers of kakirite <strong>in</strong> the <strong>fault</strong>’s kernel<br />
Figure 12. Left: 3D Model. Right: Vx Horizontal cut through the model with po<strong>in</strong>t P41 simulat<strong>in</strong>g approximately<br />
the MFS-A. The curves refer to the Vx <strong>in</strong>put particle velocity and the Vx at P41. ∆t is the<br />
wave’s travel time from the model’s load boundary to Po<strong>in</strong>t P41.<br />
426<br />
were applied at the eastern boundary of the 3D<br />
model. With this load the particle velocities <strong>in</strong> a<br />
model po<strong>in</strong>t simulat<strong>in</strong>g the MFS-A were <strong>in</strong><br />
magnitude similar to those of the measured signal<br />
(Figure 12). The dynamic design load was therefore<br />
determ<strong>in</strong>ed as the 10 times amplified measured<br />
signal (Figure 10) with a peak Vx -velocity<br />
component of 0.23 m/s. This design load covers the<br />
strongest micro tremor identified s<strong>in</strong>ce start<strong>in</strong>g the<br />
extended seismic monitor<strong>in</strong>g <strong>in</strong> the MFS Faido<br />
(Figure 7) and is conservative. Figure 12 shows the<br />
3D model used. In the diagram the design load’s Vx<br />
particle velocity is compared to the signal received<br />
<strong>in</strong> model po<strong>in</strong>t P41 simulat<strong>in</strong>g the location of the<br />
MFS-A.
5.4 Results form 2D Modell<strong>in</strong>g<br />
The results presented refer to the dynamic design<br />
load only. Of particular <strong>in</strong>terest were the l<strong>in</strong>ers’<br />
concrete stresses and displacements as a function of<br />
time due to the dynamic load. For this purpose the<br />
correspond<strong>in</strong>g results <strong>in</strong> the EWN’s l<strong>in</strong>er were<br />
compared for Model_1 and Model_2. For the<br />
<strong>in</strong>terpretation a l<strong>in</strong>er segment at the eastern change<br />
from <strong>in</strong>vert to side wall was selected. The concrete<br />
l<strong>in</strong><strong>in</strong>g thickness of the EWN is 60 cm. Negative<br />
stress denotes compression. In Model 1 the EWN is<br />
embedded between two kakirite layers whereas <strong>in</strong><br />
Model 2 the location of the EWN is <strong>in</strong> front of a<br />
kakirite layer and exposed to the more or less<br />
undamped wave arriv<strong>in</strong>g from the right model side<br />
(East). The concrete stresses represented <strong>in</strong> Figure<br />
13 and Figure 14 clearly show the damp<strong>in</strong>g effect of<br />
the kakirite layer <strong>in</strong> front of the EWN (Figure 13).<br />
The concrete stresses due to the dynamic<br />
design load are small compared to those determ<strong>in</strong>ed<br />
for the static case. The stress peaks occur at high<br />
frequencies. The evaluation of the displacement’s<br />
corner frequencies revealed a displacement’s<br />
decrease approximately at 60 Hz. Figure 13 and<br />
Figure 14 conta<strong>in</strong> the low pass filtered stresses at 60<br />
Hz. From the curve of the filtered stresses can be<br />
deduced that the design stresses to be considered are<br />
considerably smaller than the stress peaks. Due to<br />
an irreversible shear movement along a jo<strong>in</strong>t <strong>in</strong> the<br />
<strong>tunnel</strong>’s vic<strong>in</strong>ity the l<strong>in</strong>er stresses for Model 2<br />
reveal a small permanent rema<strong>in</strong><strong>in</strong>g compression<br />
stress after the dynamic impact. The shear<br />
movement <strong>in</strong> the jo<strong>in</strong>t was caused by the<br />
unh<strong>in</strong>dered wave’s deviation towards the <strong>tunnel</strong><br />
along the weak kakirite layer. Figure 15 and Figure<br />
16 show the EWN’s displacements evaluated for the<br />
same case and at the same l<strong>in</strong>er location as used for<br />
the concrete stresses’ evaluation. In accordance<br />
with the stresses the deformations generally are<br />
small. Similar to the concrete stresses, the<br />
displacement of the EWN’s l<strong>in</strong>er embedded<br />
between two kakirite layers is smaller compared to<br />
the case of Model 2.<br />
427<br />
Concrete stress <strong>in</strong> l<strong>in</strong>er (MPa)<br />
Concrete stress <strong>in</strong> l<strong>in</strong>er (MPa)<br />
L<strong>in</strong>er displacements d (mm)<br />
2<br />
1<br />
0<br />
-1<br />
0.0 0.1 0.2 0.3 0.4 0.5<br />
-2<br />
-3<br />
-4<br />
-5<br />
Time t (s)<br />
EWN<br />
Kakirite <strong>zone</strong>s<br />
unfiltered<br />
60 Hz LP filter<br />
Figure 13 Concrete stresses (M+N) <strong>in</strong> l<strong>in</strong>er of <strong>tunnel</strong><br />
EWN for Mod_1 with 2 kakirite <strong>zone</strong>s<br />
2<br />
1<br />
0<br />
0.0<br />
-1<br />
-2<br />
-3<br />
-4<br />
-5<br />
0.1 0.2 0.3 0.4 0.5<br />
Time t (s)<br />
EWN<br />
Kakirite <strong>zone</strong><br />
unfiltered<br />
60 Hz LP filter<br />
Figure 14 Concrete stresses (M+N) <strong>in</strong> l<strong>in</strong>er of <strong>tunnel</strong><br />
EWN for Mod_2 with 1 kakirite <strong>zone</strong><br />
2<br />
1<br />
0<br />
0.0<br />
-1<br />
0.1 0.2 0.3 0.4 0.5<br />
-2<br />
-3<br />
-4<br />
Time t (s)<br />
Y<br />
dy<br />
dx<br />
X<br />
EWN<br />
Kakirite <strong>zone</strong>s<br />
Figure 15 L<strong>in</strong>er displacement of <strong>tunnel</strong> EWN for Mod_1<br />
with 2 kakirite <strong>zone</strong>s
Dur<strong>in</strong>g the dynamic computation with Model 1<br />
a ‘<strong>rock</strong> <strong>burst</strong>’ was triggered beneath the EON<br />
<strong>tunnel</strong>. This <strong>burst</strong> occurred due to a sudden stress<br />
drop <strong>in</strong> a jo<strong>in</strong>t. Figure 17 shows the stress drop’s<br />
L<strong>in</strong>er displacement d (mm)<br />
2<br />
1<br />
0<br />
0.0<br />
-1<br />
0.1 0.2 0.3 0.4 0.5<br />
-2<br />
-3<br />
-4<br />
Time t (s)<br />
Y<br />
EWN<br />
Kakirite <strong>zone</strong><br />
dy<br />
dx<br />
Figure 16 L<strong>in</strong>er displacement of <strong>tunnel</strong> EWN for Mod_2<br />
with 1 kakirite <strong>zone</strong><br />
development at different times represented by<br />
particle velocities’ Vx components. The disturbance<br />
X<br />
Figure Figure 2 Development 17 Development of a stress of a stress drop <strong>in</strong> drop the <strong>in</strong> vic<strong>in</strong>ity the vic<strong>in</strong>ity of <strong>tunnel</strong> of <strong>tunnel</strong> EON. EON. Represented Represented are the are particle the particle velocities velocities Vx. Vx –<br />
Vx. Vx Range: – Range: -0.2 ÷ -0.2 +0.2 ÷ +0.2 m/s. The m/s. represented The represented Vx - Vx <strong>in</strong>terval - <strong>in</strong>terval range range is 0.05 is 0.05 m/s. m/s.<br />
Figure Figure 2 Left: 18 Left: Development Development of Vx of around Vx around the stress the stress drop drop area. area. The The represented represented Vx - Vx <strong>in</strong>terval - <strong>in</strong>terval range range is 0.10 is 0.10 m/s. m/s. Right:<br />
Stress drop Right: of 17 Stress MPa drop <strong>in</strong> the of jo<strong>in</strong>t 17 MPa <strong>in</strong>dicated <strong>in</strong> the by jo<strong>in</strong>t the <strong>in</strong>dicated shear movement by the shear <strong>in</strong> the movement left hand picture. <strong>in</strong> the left The hand residual picture. shear stress<br />
The residual amounts shear stress to 14.5 amounts MPa. to 14.5 MPa.<br />
428<br />
trigger<strong>in</strong>g the drop was small amount<strong>in</strong>g to<br />
0 < Vx < 0.05 m/s and occurred prior to the arrival<br />
of the <strong>in</strong>put wave’s first Vx - peak. The drop’s shear<br />
direction and the magnitude of the drop’s stress<br />
release of 17 MPa are shown <strong>in</strong> Figure 18 Due to<br />
the stress drop, Vx <strong>in</strong> the <strong>tunnel</strong> area amounts to<br />
more than 0.40 m/s (Figure 18). The disturb<strong>in</strong>g<br />
<strong>in</strong>fluence of the stress drop on the <strong>in</strong>put wave is<br />
depicted <strong>in</strong> Figure 17, at time t = 0.1532 s i.e.<br />
0.0179 s after the stress drop’s trigger<strong>in</strong>g. From<br />
Figure 17 the above mentioned deviation of the<br />
<strong>in</strong>put’s Vx - peak along the eastern kakirite layer is<br />
obvious at t = 0.1532 s. The stress drop occurred<br />
only <strong>in</strong> Model 1 with two kakirite layers.<br />
The impact potential of the stress drop on the<br />
l<strong>in</strong><strong>in</strong>g was <strong>in</strong>vestigated us<strong>in</strong>g the particle velocities<br />
PV accord<strong>in</strong>g to 1) with the components aris<strong>in</strong>g at<br />
the same time t.<br />
...(1)<br />
In Figure 19 the PV’s for a po<strong>in</strong>t <strong>in</strong> the <strong>rock</strong><br />
near the l<strong>in</strong><strong>in</strong>g of the EON are plotted. Compared
are the PV’s for the cases with and without stress<br />
drop i.e. with Model 2 and Model 1. In case of the<br />
stress drop the peak PV <strong>in</strong> the <strong>rock</strong> near the l<strong>in</strong><strong>in</strong>g<br />
amounts to almost 900 mm/s. The dynamic load<strong>in</strong>g<br />
on the l<strong>in</strong><strong>in</strong>g <strong>in</strong> this case is similar to a shock impact<br />
[4], [5]. Without stress drop the correspond<strong>in</strong>g<br />
maximum PV amounts to 200 mm/s. The frequency<br />
of the stress drop <strong>in</strong>duced PV is bigger than 300 Hz<br />
whereas the frequency for the peak PV without<br />
stress drop is <strong>in</strong> the range of 50 to 60 Hz. The PV’s<br />
of the l<strong>in</strong><strong>in</strong>g segment under consideration are shown<br />
<strong>in</strong> Figure 20 for the cases with and without stress<br />
drop. In the models the seal<strong>in</strong>g membrane between<br />
<strong>rock</strong> and l<strong>in</strong><strong>in</strong>g was simulated by means of an<br />
<strong>in</strong>terface. The transmissibility of this <strong>in</strong>terface<br />
contributes to the vibration behavior of the l<strong>in</strong><strong>in</strong>g<br />
[6]. For the case with stress drop the damp<strong>in</strong>g of the<br />
l<strong>in</strong><strong>in</strong>g’s peak PV is obvious. However, due to the<br />
damp<strong>in</strong>g’s frequency reduction <strong>in</strong> both cases with<br />
and without stress drop a longer duration of high<br />
PV <strong>in</strong> the l<strong>in</strong><strong>in</strong>g can be derived from Figure 20.<br />
429<br />
Figure 21 and Figure 22 show the stresses <strong>in</strong><br />
the concrete l<strong>in</strong>er and the l<strong>in</strong>er’s dx – displacement<br />
respectively, both for the cases with and without<br />
stress drop. In the case of the stress drop the<br />
concrete stress amounts to more than 8 MPa and the<br />
l<strong>in</strong>er’s displacements to 6 mm. From the above<br />
mentioned results must be concluded, that <strong>in</strong> case of<br />
a stress drop as developed <strong>in</strong> Model 1 damage of the<br />
l<strong>in</strong><strong>in</strong>g cannot be excluded. The probability of the<br />
occurrence of the design micro tremor and the<br />
correspond<strong>in</strong>g trigger<strong>in</strong>g of a stress drop has been<br />
assessed by experts as very low. This assessment is<br />
<strong>base</strong>d on the fact that after term<strong>in</strong>ation of the<br />
excavation <strong>in</strong> the MFS no more micro tremors<br />
occurred and <strong>in</strong> addition a clear correlation between<br />
excavation activity and micro tremors was<br />
ascerta<strong>in</strong>ed. Furthermore the seismic activity <strong>in</strong> the<br />
area of the MFS Faido is very low. On 21.01.2008 a<br />
M4.0 earthquake occurred at a distance of<br />
approximately 50 km from the MFS Faido. This<br />
earthquake was recognized by the measur<strong>in</strong>g<br />
Figure 19 Particle velocities PV of a po<strong>in</strong>t <strong>in</strong> the <strong>rock</strong> Figure 20. Particle velocities PV of the l<strong>in</strong><strong>in</strong>g segment.<br />
mass near the l<strong>in</strong><strong>in</strong>g. With and without stress drop With and without stress drop<br />
Figure 21 L<strong>in</strong><strong>in</strong>g’s concrete stresses (M+N) of <strong>tunnel</strong> EON. Figure 22 L<strong>in</strong> <strong>in</strong>g displacements dx of <strong>tunnel</strong> EON.<br />
With and without stress drom With and without stress drop
stations <strong>in</strong> the MFS. No trigger<strong>in</strong>g of a micro tremor<br />
could be identified. Based on above mentioned<br />
aspects the case of a stress drop near a <strong>tunnel</strong> <strong>in</strong> the<br />
MFS Faido has been accepted as a residual risk.<br />
S<strong>in</strong>ce a residual risk cannot be completely excluded,<br />
the owner of the <strong>tunnel</strong>, ATG decided to <strong>in</strong>stall<br />
seismic measur<strong>in</strong>g equipments and vibration sensors<br />
<strong>in</strong> the l<strong>in</strong><strong>in</strong>gs of the <strong>tunnel</strong>s <strong>in</strong> the MFS Faido for a<br />
permanent seismic monitor<strong>in</strong>g dur<strong>in</strong>g operation.<br />
6. CONCLUSIONS<br />
Dur<strong>in</strong>g <strong>tunnel</strong><strong>in</strong>g at great depth <strong>in</strong> geological<br />
conditions as encountered <strong>in</strong> the MFS Faido micro<br />
tremors trigger<strong>in</strong>g <strong>rock</strong> <strong>burst</strong>s are likely to occur.<br />
The stress redistribution due to <strong>tunnel</strong><strong>in</strong>g and<br />
the stress concentration <strong>in</strong> hard <strong>rock</strong> <strong>in</strong> comb<strong>in</strong>ation<br />
with an exist<strong>in</strong>g <strong>zone</strong> of weakness (<strong>fault</strong>) favors the<br />
occurrence of micro tremors.<br />
The micro tremors did clearly correlate with the<br />
excavation activities. After term<strong>in</strong>at<strong>in</strong>g the excavation<br />
no more micro tremors have been identified.<br />
Micro tremors cannot be avoided. Dur<strong>in</strong>g<br />
construction precaution measures such as clos<strong>in</strong>g of<br />
critical sections and flexible support consist<strong>in</strong>g of<br />
flexible <strong>rock</strong> bolts and steel arches are to be applied.<br />
A seismic wave is deviated by a weak <strong>zone</strong>.<br />
With the orientation of the weak <strong>zone</strong>s <strong>in</strong> the MFS<br />
Faido a seismic wave is deviated towards the <strong>tunnel</strong>s.<br />
The dynamic impact on a l<strong>in</strong><strong>in</strong>g of a <strong>tunnel</strong> <strong>in</strong> front of<br />
a weak <strong>zone</strong> and exposed to a more or less unh<strong>in</strong>dered<br />
micro tremor’s wave is considerably higher compared to the<br />
impact on a l<strong>in</strong>er of a <strong>tunnel</strong> <strong>in</strong> the ‘shelter’ of a weak <strong>zone</strong>.<br />
The specification of the design micro tremor<br />
for the MFS Faido is conservative.<br />
Exclud<strong>in</strong>g the additional load<strong>in</strong>g due to a<br />
spontaneous ‘stress drop’ <strong>in</strong> the direct vic<strong>in</strong>ity of a<br />
<strong>tunnel</strong> there has been no need for improv<strong>in</strong>g<br />
(thickness, additional re<strong>in</strong>forc<strong>in</strong>g) the l<strong>in</strong><strong>in</strong>gs<br />
designed for the static load case <strong>in</strong> the MFS Faido.<br />
ACKNOWLEDGEMENT<br />
The authors thank the AlpTransit <strong>Gotthard</strong> for the<br />
permission to publish the paper.<br />
REFERENCES<br />
1. Hagedorn, H., Rehbock-Sander, M., Flury,<br />
S.,<strong>Gotthard</strong> Base Tunnel: State of the works and<br />
Special Aspects, Proc. Int. Symposium on<br />
430<br />
2.<br />
Construction and Operation of Long Tunnels,<br />
Taipei, Taiwan, 7. - 10.11.2005<br />
Rehbock-Sander, M., Rock Bursts Experience<br />
ga<strong>in</strong>ed <strong>in</strong> M<strong>in</strong>es and Deep Tunnels, Proc. 4 th Asian<br />
Rock Mechanics Symposium (ARMS 2006),<br />
S<strong>in</strong>gapore, 8.-10.11.2006<br />
3. ITASCA, UDEC – Manual, Theory and<br />
Background, Itasca Consult<strong>in</strong>g Group, Inc.<br />
M<strong>in</strong>neapolis, M<strong>in</strong>nesota, USA<br />
4. Kaiser, P.K., Vasak,P., Suor<strong>in</strong>emi, F.T. and<br />
Thibodeau, D. (2005). New dimensions <strong>in</strong> seismic<br />
data <strong>in</strong>terpretation with 3-D virtual reality<br />
5.<br />
visualization <strong>in</strong> <strong>burst</strong>-prone ground, RaSiM6, Perth,<br />
Australia, 33 – 47<br />
Heuze, F.E., Morris, J.P., Insights <strong>in</strong>to ground shock <strong>in</strong><br />
jo<strong>in</strong>ted <strong>rock</strong>s and the response of structures there-<strong>in</strong>, Int.<br />
Journal of Rock Mechanics & M<strong>in</strong><strong>in</strong>g Sciences 44 (2007)<br />
647-676<br />
6. Harris, C.M., Crede, E.C., Shock and Vibration<br />
Handbook, McGraw-Hill, Book Company, ISBN 0-<br />
07-026799-5<br />
BIOGRAPHICAL DETAILS OF THE AUTHORS<br />
He<strong>in</strong>z Hagedorn completed his study<br />
<strong>in</strong> civil eng<strong>in</strong>eer<strong>in</strong>g at the Swiss<br />
Federal Institute of Technology (ETH)<br />
with a M.Sc. degree <strong>in</strong> 1969. From<br />
1970 to 1979 he was work<strong>in</strong>g at ETH<br />
with the <strong>rock</strong> mechanics <strong>in</strong>stitute of<br />
Prof. K. Kovari. The activity consisted<br />
<strong>in</strong> develop<strong>in</strong>g a F<strong>in</strong>ite Element<br />
program designed for underground<br />
structures and research activity <strong>in</strong> material test<strong>in</strong>g and<br />
field measurement. S<strong>in</strong>ce 1979 he has been work<strong>in</strong>g with<br />
Amberg Eng<strong>in</strong>eer<strong>in</strong>g Ltd., Switzerland as a geotechnical<br />
expert. For numerous large underground constructions<br />
such as <strong>tunnel</strong>s, caverns etc. <strong>in</strong> Switzerland and abroad he<br />
provided geotechnical expertise and consult<strong>in</strong>g for design<br />
and dur<strong>in</strong>g construction.<br />
Rolf Stadelmann obta<strong>in</strong>ed his M. Sc <strong>in</strong><br />
Civil Eng<strong>in</strong>eer<strong>in</strong>g from the ETH<br />
Zurich, Switzerland <strong>in</strong> 1992. He<br />
specializes <strong>in</strong> general stability<br />
analyses, temporary & permanent<br />
excavation support systems, as well as<br />
<strong>in</strong> structural design of all types of<br />
<strong>tunnel</strong> l<strong>in</strong><strong>in</strong>g. His core competence is<br />
also <strong>in</strong> the quality management for<br />
geotechnical analyses as well as <strong>in</strong> the development of<br />
Contractor’s alternatives. He has <strong>in</strong>-depth experiences <strong>in</strong><br />
underground space design for all k<strong>in</strong>ds of <strong>rock</strong> conditions.<br />
S<strong>in</strong>ce 2003 he is Head of Geotechnical Department of<br />
Amberg Eng<strong>in</strong>eer<strong>in</strong>g Ltd <strong>in</strong> Switzerland.