Chocolate Chip Cookies as a Teaching Aid - University of California ...
Chocolate Chip Cookies as a Teaching Aid - University of California ...
Chocolate Chip Cookies as a Teaching Aid - University of California ...

You also want an ePaper? Increase the reach of your titles
YUMPU automatically turns print PDFs into web optimized ePapers that Google loves.
Herbert K. H. LEE<br />
Getting and retaining the attention <strong>of</strong> students in an introductory<br />
statistics course can be a challenge, and poor motivation or<br />
outright fear <strong>of</strong> mathematical concepts can hinder learning. By<br />
using an example <strong>as</strong> familiar and comforting <strong>as</strong> chocolate chip<br />
cookies, the instructor can make a variety <strong>of</strong> statistical concepts<br />
come to life for the students, greatly enhancing learning.<br />
KEY WORDS: Active learning; <strong>Teaching</strong> statistics; Variability.<br />
1. INTRODUCTION<br />
<strong>Teaching</strong> introductory statistics at a university can be a major<br />
challenge because most <strong>of</strong> the students in the cl<strong>as</strong>sroom do<br />
not want to be there, and are taking the course only because it<br />
is a requirement for their major or it fulfills a distributional requirement.<br />
Many students have already heard stories from their<br />
friends or even their parents about how hard and unple<strong>as</strong>ant<br />
statistics will be. The challenge is amplified when teaching in<br />
a larger lecture format, because <strong>of</strong> the limited opportunities for<br />
personal contact. So it is quite helpful to convince the students<br />
to buy in to the course, to get their interest and to connect the<br />
course to concepts that they are comfortable with (Singer and<br />
Willett 1990; Snee 1993). The use <strong>of</strong> hands-on activities to facilitate<br />
active learning h<strong>as</strong> been well established (Garfield and<br />
Ahlgren 1988; Gnanadesikan et al. 1997).<br />
Many introductory textbooks use examples from sports, biology,<br />
and economics in an attempt to relate the subject matter<br />
to are<strong>as</strong> <strong>of</strong> interest to the students, and discussions <strong>of</strong> the benefits<br />
are present in the literature (e.g., Kvam and Sokol 2004).<br />
However, I have found that none <strong>of</strong> these examples are <strong>of</strong> interest<br />
to the whole cl<strong>as</strong>s, <strong>of</strong>ten leaving one-third to one-half <strong>of</strong><br />
the cl<strong>as</strong>s uninterested in the examples and still uninterested in<br />
the course. Even worse, there can be gender bi<strong>as</strong>es in the relative<br />
interest in these examples. However, I have found that almost<br />
all students like chocolate chip cookies. Other instructors<br />
have also documented success in using snack food to motivate<br />
statistical education, including M&M’s (Dyck and Gee 1998),<br />
Reese’s Pieces (Rossman and Chance 1999), Hershey’s Kisses<br />
(Richardson and Haller 2002), and chewing gum (Richardson<br />
et al. 2005), although these tend to occur <strong>as</strong> isolated examples<br />
<strong>of</strong> specific concepts in a course. From a pedagogical standpoint,<br />
cookies can go beyond being a gimmick in a single cl<strong>as</strong>s to becoming<br />
a recurring theme that can demonstrate many <strong>of</strong> the key<br />
Herbert Lee is Associate Pr<strong>of</strong>essor, Department <strong>of</strong> Applied Mathematics<br />
and Statistics, <strong>University</strong> <strong>of</strong> <strong>California</strong>, Santa Cruz, 95064 (E-mail:<br />
herbie@ams.ucsc.edu). The author thanks Michele Di Pietro and the editor for<br />
their helpful comments which led to substantial improvements.<br />
<strong>Chocolate</strong> <strong>Chip</strong> <strong>Cookies</strong> <strong>as</strong> a <strong>Teaching</strong> <strong>Aid</strong><br />
concepts in a b<strong>as</strong>ic statistics course, allowing students to better<br />
see the connections between the different topics. The rest <strong>of</strong> this<br />
article will discuss how the following topics can all be related<br />
to cookies:<br />
• variability<br />
• inter-rater agreement and me<strong>as</strong>urement error<br />
• exploratory data analysis: displays <strong>of</strong> data, outliers<br />
• the Poisson distribution, empirical distributions, extreme<br />
values<br />
• sampling distributions<br />
• hypothesis testing: one-sample t tests, two-sample t tests,<br />
and analysis <strong>of</strong> variance<br />
• Bayesian statistics: prior elicitation and prior sensitivity<br />
2. BRINGING COOKIES INTO THE CLASSROOM<br />
By connecting statistical concepts directly to cookies, I have<br />
been able to gain the interest <strong>of</strong> students, even in larger cl<strong>as</strong>ses.<br />
Once the students have found a re<strong>as</strong>on to pay attention, subsequent<br />
teaching is much e<strong>as</strong>ier. In particular, what is needed is an<br />
eye-opening example that the students can relate to. What better<br />
than chocolate chip cookies? Consider a bag <strong>of</strong> m<strong>as</strong>s-produced<br />
cookies, such <strong>as</strong> the brand-name <strong>Chip</strong>s Ahoy or Keebler, or<br />
your favorite local store brand. These cookies are all produced<br />
to fairly high quality control standards. They are all about the<br />
same size. Most students expect that the cookies will all have<br />
about the same number <strong>of</strong> chips. That’s what m<strong>as</strong>s-production<br />
is all about, right?<br />
2.1 Exploring Variability<br />
Most statistics textbooks have a chapter on exploratory data<br />
analysis and graphical displays near the beginning <strong>of</strong> the book.<br />
This is a perfect time to bring in the cookies. I bring in enough<br />
cookies for everyone. We discuss the cookies and discuss variability,<br />
but the students consistently underestimate the variability.<br />
I then p<strong>as</strong>s around the cookies, telling them to each take one<br />
cookie and count the chips. Of course, you cannot see all <strong>of</strong> the<br />
chips from the outside, so you need to eat the cookie to find all<br />
<strong>of</strong> the chips.<br />
I have found that the students suddenly become engaged in<br />
the course. Almost everyone likes eating cookies. After they<br />
have had a chance to count, I have them tell me how many they<br />
found and I enter the numbers into my laptop. The students at<br />
first tend to think that this is just going to be a long boring process<br />
in a large cl<strong>as</strong>s, but they are soon surprised to hear the<br />
numbers coming from their cl<strong>as</strong>smates. The variability is far<br />
beyond what they expect. For example, in one cl<strong>as</strong>s we counted<br />
c○2007 American Statistical Association DOI: 10.1198/000313007X246905 The American Statistician, November 2007, Vol. 61, No. 4 1
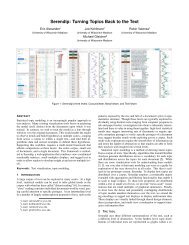
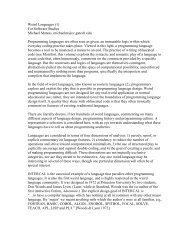
Figure 1. Histogram and boxplot <strong>of</strong> the number <strong>of</strong> chips in each <strong>of</strong> 101 cookies.<br />
101 cookies with the number <strong>of</strong> chips ranging from 14 to 42<br />
(see Figure 1). Until you stop and think about it, that seems like<br />
an awful lot <strong>of</strong> variability. But if you consider a large batch <strong>of</strong><br />
well-mixed dough, the number <strong>of</strong> chips per cookie should be<br />
approximately Poisson, so this amount <strong>of</strong> variability turns out<br />
to be re<strong>as</strong>onable, <strong>as</strong> further discussed in Section 2.4.<br />
This is a paradigm-shifting moment for most students. They<br />
think they understand cookies, yet suddenly realize that there<br />
is far more variability than they expected. They may call into<br />
question previous cookie-eating experiences. They may wonder<br />
if their friends have been getting more chips than they have.<br />
But they suddenly have a very tangible example <strong>of</strong> how variability<br />
can affect them personally. And now they have a re<strong>as</strong>on<br />
to care about their statistics cl<strong>as</strong>s. As documented by Sowey<br />
(2001), such a “striking demonstration” provokes excitement in<br />
the topic and facilitates learning. At this point I can impress<br />
upon them that statistics is the study <strong>of</strong> randomness and variability,<br />
and set the stage for many other topics in the course.<br />
2.2 Inter-rater Agreement and Me<strong>as</strong>urement Error<br />
During the counting <strong>of</strong> the chips, students <strong>of</strong>ten <strong>as</strong>k relevant<br />
questions. Two related categories <strong>of</strong> questions are those about<br />
inter-rater agreement and about me<strong>as</strong>urement error. Because <strong>of</strong><br />
the manufacturing processes, many cookies actually contain one<br />
or more broken chips, so students frequently <strong>as</strong>k “what counts<br />
<strong>as</strong> a chip?” We can discuss how two people might re<strong>as</strong>onably arrive<br />
at different chip counts because <strong>of</strong> how they count the fractions<br />
<strong>of</strong> chips. If time permits, we can have a cl<strong>as</strong>s discussion<br />
<strong>of</strong> the counting process, and how different counting techniques<br />
can lead to different results. In particular, some students will<br />
take larger or smaller bites out <strong>of</strong> the cookies, leading to different<br />
probabilities <strong>of</strong> missing chips. True to stereotype, I have<br />
found engineering students to be more methodical in counting,<br />
sometimes going to the extreme <strong>of</strong> first pulverizing the cookie<br />
and separating it into dough bits and chips to ensure a proper<br />
count. Thus there are a number <strong>of</strong> <strong>as</strong>pects <strong>of</strong> the process which<br />
e<strong>as</strong>ily lead into general learning about inter-rater variability.<br />
2 Teacher’s Corner<br />
In an introductory-level course, the discussion <strong>of</strong> me<strong>as</strong>urement<br />
error would typically be kept to a conceptual level, focusing<br />
on the ways that people might miss chips, or <strong>as</strong>sumptions<br />
made about fractions <strong>of</strong> chips with which other people<br />
might disagree. In a higher-level course, we can have deeper<br />
discussions about which probability distribution might be used<br />
to model the me<strong>as</strong>urement error. Although the normal distribution<br />
is the typical one for error, here we might want a discrete<br />
distribution if we are considering only whole numbers <strong>of</strong> chips,<br />
and we expect that people are more likely to fail to see chips<br />
(undercount) than to double-count (overcount). Thus we might<br />
want a skewed and/or truncated distribution. Prodding the students<br />
through a discussion <strong>of</strong> these concepts can be enlightening<br />
for them in learning to relate the theoretical concepts to reallife<br />
examples, rather than allowing them to apply rules such <strong>as</strong><br />
Gaussian me<strong>as</strong>urement error by rote standard.<br />
2.3 Exploratory Data Analysis<br />
In an introductory cl<strong>as</strong>s, this dat<strong>as</strong>et also serves <strong>as</strong> a good example<br />
for graphical displays such <strong>as</strong> histograms, stem-and-leaf<br />
diagrams, and boxplots. Histograms with different bin sizes can<br />
be compared. The dat<strong>as</strong>et <strong>of</strong>ten contains points that a standard<br />
statistical package will mark <strong>as</strong> potential outliers (see Figure 1),<br />
leading to a discussion <strong>of</strong> what it means to be an outlier and<br />
whether or not these points qualify.<br />
2.4 The Poisson Distribution, Empirical Distributions, and<br />
Extreme Values<br />
In a cl<strong>as</strong>s beyond the most introductory level, chip counts<br />
serve <strong>as</strong> a good example for studying the Poisson distribution.<br />
As mentioned earlier, the number <strong>of</strong> chips per cookie made from<br />
well-mixed dough should be approximately Poisson. A cookie<br />
can be seen <strong>as</strong> the observation <strong>of</strong> an interval <strong>of</strong> a Poisson process<br />
(picture the dough being extruded in segments onto the baking<br />
sheet) and we can discuss how closely the process meets or<br />
misses the <strong>as</strong>sumptions <strong>of</strong> a Poisson process. Questions such <strong>as</strong>
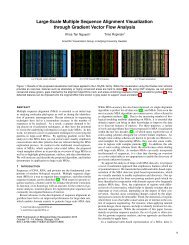
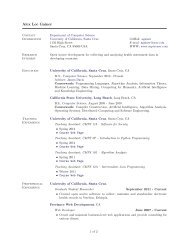
Figure 2. Quantile-quantile plot <strong>of</strong> chip counts versus theoretical quantiles from a Poisson distribution with the same mean, and a normal<br />
probability plot <strong>of</strong> chip counts.<br />
“If a cookie h<strong>as</strong> 25 chips on average, what is the probability it<br />
h<strong>as</strong> exactly 20 chips?” and (with the aid <strong>of</strong> a table or computer)<br />
“What is the probability it h<strong>as</strong> at le<strong>as</strong>t 20 chips?” can be <strong>as</strong>ked.<br />
Do the data really match a Poisson distribution? In a lowerlevel<br />
cl<strong>as</strong>s, I demonstrate by simulation that typically the observed<br />
histogram looks similar to what we might expect, generating<br />
a number <strong>of</strong> dat<strong>as</strong>ets from Poisson distributions with the<br />
same mean and observing their shapes and ranges. In a more<br />
advanced cl<strong>as</strong>s, one could make a quantile-quantile (Q-Q) plot<br />
to compare the empirical and theoretical distributions, or even<br />
do formal hypothesis tests to compare the distributions. The left<br />
panel <strong>of</strong> Figure 2 shows a Q-Q plot <strong>of</strong> the data against the theoretical<br />
quantiles <strong>of</strong> a Poisson distribution with mean 27.4, the<br />
mean <strong>of</strong> the observed data. The fit is not bad. The right panel<br />
<strong>of</strong> Figure 2 shows a normal probability plot, illustrating that the<br />
normal distribution is a good approximation to the Poisson for<br />
sufficiently large means (<strong>as</strong> in this c<strong>as</strong>e), which is just <strong>as</strong> predicted<br />
by the central limit theorem (thinking <strong>of</strong> a single draw<br />
from a Poisson <strong>as</strong> a sum <strong>of</strong> independent smaller Poisson draws).<br />
Given a Poisson model, how re<strong>as</strong>onable is the observed variability?<br />
Various <strong>as</strong>pects <strong>of</strong> the distribution can be explored. For<br />
example, the theoretical quantiles give an indication <strong>of</strong> what is a<br />
re<strong>as</strong>onable spread. A further step would be to explore the actual<br />
distribution <strong>of</strong> the maximum and minimum, either by deriving<br />
the distributions <strong>of</strong> the order statistics, or through simulation,<br />
depending on the level <strong>of</strong> the cl<strong>as</strong>s and the amount <strong>of</strong> cl<strong>as</strong>s time<br />
available.<br />
3. INFERENCE AND BEYOND WITH COOKIES<br />
The value <strong>of</strong> cookies continues into material on statistical inference.<br />
I <strong>as</strong>k the cl<strong>as</strong>s how they would decide if a manufacturer<br />
is putting enough chips in their cookies. If the manufacturer<br />
claims an average <strong>of</strong> 27 chips per cookie, how would they de-<br />
cide if the manufacturer is truthful, using only a highly variable<br />
sample <strong>of</strong> cookies? Next we can consider comparing brands.<br />
Given how much difference there is in the counts for a single<br />
brand, how could we possibly hope to say if one brand <strong>of</strong> cookies<br />
h<strong>as</strong> more chips than another? The answer, <strong>as</strong> we know, is<br />
that we need statistical methodology.<br />
3.1 Sampling Distributions<br />
The concept <strong>of</strong> a sampling distribution can be difficult for the<br />
students to gr<strong>as</strong>p until they have a live example (Gourgey 2000),<br />
and the cookies work wonderfully. After personally counting<br />
cookies from one bag, the students can e<strong>as</strong>ily envision that a different<br />
bag would have different counts, even if it came from the<br />
same population. Indeed, in a larger cl<strong>as</strong>s, more than one bag is<br />
necessary for everyone to get a cookie (bags typically have between<br />
30 and 40 cookies), so by clearly marking the bags, the<br />
data can be recorded by bag and the cl<strong>as</strong>s can see directly that<br />
not only do the bags have different averages, but that the variability<br />
<strong>of</strong> the bag averages is much smaller than the variability<br />
<strong>of</strong> the individual cookies. In a smaller cl<strong>as</strong>s, the <strong>Chip</strong>s Ahoy<br />
brand packages can be useful here because the package contains<br />
two inner bags, each with half <strong>of</strong> the cookies, so the two<br />
inner bag averages can be compared. The difference between<br />
the variability among individual cookies and <strong>of</strong> bag averages<br />
becomes tangible to the students because <strong>of</strong> the hands-on experience.<br />
This facilitates the ensuing standard lessons on sampling<br />
distributions.<br />
3.2 Hypothesis Tests<br />
The data are clearly relevant when we get to one-sample t<br />
tests. The students now understand that it is not re<strong>as</strong>onable to<br />
expect a bag <strong>of</strong> cookies to contain an exact number <strong>of</strong> chips,<br />
but that a certain amount <strong>of</strong> variability is natural. Thus we use<br />
The American Statistician, November 2007, Vol. 61, No. 4 3
a t test to see if the observed difference is large relative to the<br />
observed variability.<br />
When we get to two-sample t tests, I bring in a different brand<br />
<strong>of</strong> cookies. Again confronted with the natural variability, the<br />
students understand that without statistical tools, they have no<br />
way to decide if a difference in means between brands is just<br />
random variability or if it is a real difference. Thus they can<br />
see why the t test is necessary, and they can relate the cookie<br />
data to the parts <strong>of</strong> the t statistic, comparing variability between<br />
the brands to variability among individual cookies. We can also<br />
discuss whether or not the <strong>as</strong>sumption <strong>of</strong> equal variance <strong>of</strong> the<br />
brands makes sense.<br />
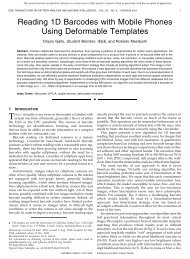
The running example goes further. I bring in a third brand to<br />
introduce one-way ANOVA. By having a continuing example,<br />
it makes the fact that ANOVA is a generalization <strong>of</strong> a t test more<br />
tangible for the students. And by now, the concept <strong>of</strong> comparing<br />
variability within brands to variability across brands is familiar<br />
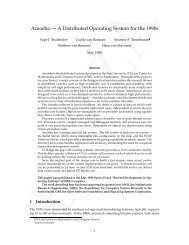
to the students. An example <strong>of</strong> such an analysis is shown in<br />
Figure 3, with side-by-side boxplots <strong>of</strong> counts by brand, and<br />
the following ANOVA table:<br />
Analysis <strong>of</strong> Variance Table<br />
Response: <strong>Chip</strong>s<br />
Df Sum Sq Mean Sq F value Pr(>F)<br />
Brand 2 1929.7 964.8 42.435
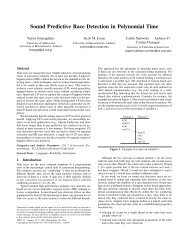
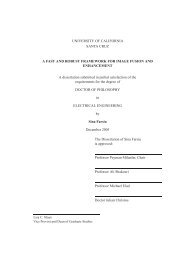
Figure 4. Prior (dotted line), likelihood (d<strong>as</strong>hed line), and posterior (solid line).<br />
late chip counting in the three different types <strong>of</strong> cookies. It<br />
made the material fun and e<strong>as</strong>y to understand;” and “Loved<br />
the examples—good connections to other subjects and brought<br />
‘statistics to life’ with cookie examples.” The students thus respond<br />
positively to active learning methods. They also provide<br />
comments showing that such examples do make a difference<br />
in gaining their attention and <strong>as</strong>sisting with learning a subject<br />
about which they had initial apprehensions: “The approach for<br />
teaching this usually ‘dry’ cl<strong>as</strong>s is very good. <strong>Cookies</strong> in cl<strong>as</strong>s<br />
are very good;” “<strong>Cookies</strong> were a great way to get students to<br />
come to cl<strong>as</strong>s, get into the material, and understand it;” “I hate<br />
math and I w<strong>as</strong> dreading the idea <strong>of</strong> takings stats . . . I actually<br />
learned what I needed to;” and “. . . made a dull subject (statistics)<br />
interesting . . . I enjoyed this cl<strong>as</strong>s and I didn’t think that I<br />
would.”<br />
Comments under the improvement question rarely relate to<br />
the cookies, with the memorable exceptions being “have more<br />
examples with healthier types <strong>of</strong> food” and “Vegan friendly<br />
cl<strong>as</strong>s experiments, ple<strong>as</strong>e.”<br />
5. CONCLUSIONS<br />
One <strong>of</strong> the goals <strong>of</strong> a teacher <strong>of</strong> introductory statistics is to<br />
have their students think about statistical concepts in their lives<br />
outside <strong>of</strong> the cl<strong>as</strong>sroom. By using the familiar chocolate chip<br />
cookie, one can demonstrate variability in an eye-opening way<br />
to the students. This demonstration causes them to look at cookies<br />
differently, and thus brings an important statistical concept<br />
directly into their lives. It is then much e<strong>as</strong>ier for them to apply<br />
these concepts to other examples, and they are much more<br />
likely to be interested in the rest <strong>of</strong> the course.<br />
[Received Received November 2006. Revised June 2007.]<br />
REFERENCES<br />
Chance, B. L. (1997), “Experiences with Authentic Assessment Techniques in<br />
an Introductory Statistics Course,” Journal <strong>of</strong> Statistics Education, 5, 3.<br />
Dyck, J. L., and Gee, N. A. (1998), “A Sweet Way to Teach Students About the<br />
Sampling Distribution <strong>of</strong> the Mean,” <strong>Teaching</strong> <strong>of</strong> Psychology, 25, 192–195.<br />
Garfield, J., and Ahlgren, A. (1988), “Difficulties in Learning B<strong>as</strong>ic Concepts in<br />
Probability and Statistics: Implications for Research.” Journal for Research<br />
in Mathematics Education, 19, 44–63.<br />
Gnanadesikan, M., Scheaffer, R. L., Watkins, A. E., and Witmer, J. A. (1997),<br />
“An Activity-B<strong>as</strong>ed Statistics Course,” Journal <strong>of</strong> Statistics Education, 5, 2.<br />
Gourgey, A. F. (2000), “A Cl<strong>as</strong>sroom Simulation B<strong>as</strong>ed on Political Polling<br />
To Help Students Understand Sampling Distributions,” Journal <strong>of</strong> Statistics<br />
Education, 8, 3.<br />
Kvam, P. H., and Sokol, J. (2004), “<strong>Teaching</strong> Statistics with Sports Examples,”<br />
INFORMS Transactions on Education, vol. 5. Available online at http://ite.<br />
pubs.informs.org/Vol5No1/KvamSokol/.<br />
Richardson, M., and Haller, S. (2002), “What is the Probability <strong>of</strong> a Kiss? (It’s<br />
Not What You Think),” Journal <strong>of</strong> Statistics Education, 10, 3.<br />
Richardson, M., Rogness, N., and Gajewski, B. (2005), “4 out <strong>of</strong> 5 Students<br />
Surveyed Would Recommend this Activity (Comparing Chewing Gum Flavor<br />
Durations),” Journal <strong>of</strong> Statistics Education, 13, 3.<br />
Rossman, A. J., and Chance, B. L. (1999), “<strong>Teaching</strong> the Re<strong>as</strong>oning <strong>of</strong> Statistical<br />
Inference: A ‘Top Ten’ List,” College Mathematics Journal, 30, 4,<br />
297–305.<br />
Singer, J. D., and Willett, J. B. (1990), “Improving the <strong>Teaching</strong> <strong>of</strong> Applied<br />
Statistics: Putting the Data Back Into Data Analysis,” The American Statistician,<br />
44, 223–230.<br />
Snee, R. (1993), “What’s Missing in Statistical Education,” The American<br />
Statistician, 47, 149–154.<br />
Sowey, E. R. (2001), “Striking Demonstrations in <strong>Teaching</strong> Statistics,” Journal<br />
<strong>of</strong> Statistics Education, 9, 1.<br />
The American Statistician, November 2007, Vol. 61, No. 4 5