07 July Monthly Report 2021

Create successful ePaper yourself
Turn your PDF publications into a flip-book with our unique Google optimized e-Paper software.
OPERATIONAL STATISTICS - FIRE OPERATIONS<br />
FIRE OPERATIONS SUMMARY:<br />
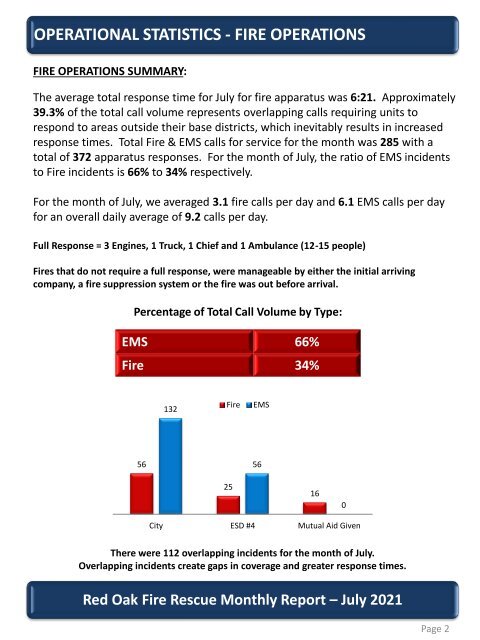
The average total response time for <strong>July</strong> for fire apparatus was 6:21. Approximately<br />
39.3% of the total call volume represents overlapping calls requiring units to<br />
respond to areas outside their base districts, which inevitably results in increased<br />
response times. Total Fire & EMS calls for service for the month was 285 with a<br />
total of 372 apparatus responses. For the month of <strong>July</strong>, the ratio of EMS incidents<br />
to Fire incidents is 66% to 34% respectively.<br />
For the month of <strong>July</strong>, we averaged 3.1 fire calls per day and 6.1 EMS calls per day<br />
for an overall daily average of 9.2 calls per day.<br />
Full Response = 3 Engines, 1 Truck, 1 Chief and 1 Ambulance (12-15 people)<br />
Fires that do not require a full response, were manageable by either the initial arriving<br />
company, a fire suppression system or the fire was out before arrival.<br />
Percentage of Total Call Volume by Type:<br />
EMS 66%<br />
Fire 34%<br />
132<br />
Fire<br />
EMS<br />
56<br />
56<br />
25<br />
16<br />
0<br />
City ESD #4 Mutual Aid Given<br />
There were 112 overlapping incidents for the month of <strong>July</strong>.<br />
Overlapping incidents create gaps in coverage and greater response times.<br />
Red Oak Fire Rescue <strong>Monthly</strong> <strong>Report</strong> – <strong>July</strong> <strong>2021</strong><br />
Page 2