The International DORIS Service July 2003 – December 2005 report
The International DORIS Service July 2003 – December 2005 report
The International DORIS Service July 2003 – December 2005 report

Create successful ePaper yourself
Turn your PDF publications into a flip-book with our unique Google optimized e-Paper software.
IDS Report <strong>–</strong> <strong>July</strong> <strong>2003</strong> to <strong>December</strong> <strong>2005</strong> 38<br />
Table 8. Biases at 1997.0 and trends in time series of TRF scale. Weighted residuals (WRMS)<br />
are computed after taking out the seasonal component, except for the ina04wd01 time series.<br />
<strong>The</strong> reference is not ITRF2000 but just a mean between LCA and IGN solutions.<br />
Time series Time span Analysis software Gravity Field Bias<br />
(ppb)<br />
Linear<br />
trend<br />
(ppb/yr)<br />
lcamd02 1993-2002 GINS-DYNAMO GRIM5-C1 +3.1 -0.37 0.7<br />
ignwd02 1993-<strong>2003</strong> GIPSY-OASIS EGM96 -3.3 -0.09 0.6<br />
ignwd05 1993-2004 GIPSY-OASIS GGM01C -3.3 -0.10 0.6<br />
ignwd04 1993-2004 GIPSY-OASIS GGM01C -2.7 -0.05 0.7<br />
inawd01 1999-2002 GIPSY-OASIS JGM-3 -3.9 +0.17 +1.7<br />
WRMS<br />
(ppb)<br />
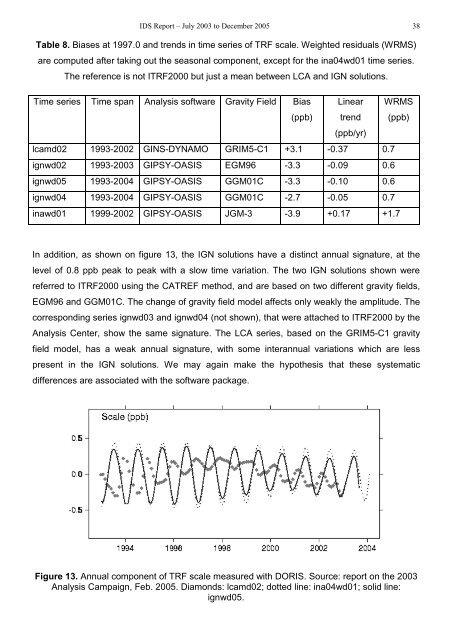
In addition, as shown on figure 13, the IGN solutions have a distinct annual signature, at the<br />
level of 0.8 ppb peak to peak with a slow time variation. <strong>The</strong> two IGN solutions shown were<br />
referred to ITRF2000 using the CATREF method, and are based on two different gravity fields,<br />
EGM96 and GGM01C. <strong>The</strong> change of gravity field model affects only weakly the amplitude. <strong>The</strong><br />
corresponding series ignwd03 and ignwd04 (not shown), that were attached to ITRF2000 by the<br />
Analysis Center, show the same signature. <strong>The</strong> LCA series, based on the GRIM5-C1 gravity<br />
field model, has a weak annual signature, with some interannual variations which are less<br />
present in the IGN solutions. We may again make the hypothesis that these systematic<br />
differences are associated with the software package.<br />
Figure 13. Annual component of TRF scale measured with <strong>DORIS</strong>. Source: <strong>report</strong> on the <strong>2003</strong><br />
Analysis Campaign, Feb. <strong>2005</strong>. Diamonds: lcamd02; dotted line: ina04wd01; solid line:<br />
ignwd05.