The International DORIS Service July 2003 – December 2005 report
The International DORIS Service July 2003 – December 2005 report
The International DORIS Service July 2003 – December 2005 report

You also want an ePaper? Increase the reach of your titles
YUMPU automatically turns print PDFs into web optimized ePapers that Google loves.
IDS Report <strong>–</strong> <strong>July</strong> <strong>2003</strong> to <strong>December</strong> <strong>2005</strong> 42<br />
<strong>The</strong> observed geodetic seasonal signals show some large differences between <strong>DORIS</strong><br />
solutions and between <strong>DORIS</strong> and SLR or the geophysical signal. <strong>The</strong> phase differences are<br />
probably a mechanical effect of the superimposition of an annual systematic error to the<br />
geophysical signal. <strong>The</strong> following general features are seen.<br />
- In Tx, the SLR signal includes a semi-annual component comparable to that present in<br />
the geophysical signal. <strong>The</strong> latter originates from the atmosphere and ocean contributions,<br />
combined with a slight phase shift of the ground waters one.<br />
• <strong>The</strong> amplitudes of all signals in Ty are of similar amplitudes. Note a slow amplitude<br />
increase in Tx and a slow decrease in Ty in the case of the IGN solution.<br />
• In the Tz direction, the amplitudes of both <strong>DORIS</strong> signals are much larger than expected<br />
from geophysical data, and the amplitudes of the IGN and LCA series differ by nearly a<br />
factor of two. <strong>The</strong> SLR signal has an amplitude compatible with the geophysical<br />
expectation.<br />
8.6.2 SPECTRUM<br />
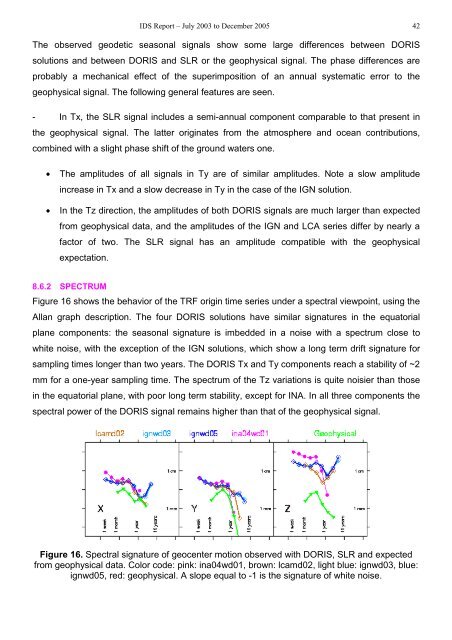
Figure 16 shows the behavior of the TRF origin time series under a spectral viewpoint, using the<br />
Allan graph description. <strong>The</strong> four <strong>DORIS</strong> solutions have similar signatures in the equatorial<br />
plane components: the seasonal signature is imbedded in a noise with a spectrum close to<br />
white noise, with the exception of the IGN solutions, which show a long term drift signature for<br />
sampling times longer than two years. <strong>The</strong> <strong>DORIS</strong> Tx and Ty components reach a stability of ~2<br />
mm for a one-year sampling time. <strong>The</strong> spectrum of the Tz variations is quite noisier than those<br />
in the equatorial plane, with poor long term stability, except for INA. In all three components the<br />
spectral power of the <strong>DORIS</strong> signal remains higher than that of the geophysical signal.<br />
Figure 16. Spectral signature of geocenter motion observed with <strong>DORIS</strong>, SLR and expected<br />
from geophysical data. Color code: pink: ina04wd01, brown: lcamd02, light blue: ignwd03, blue:<br />
ignwd05, red: geophysical. A slope equal to -1 is the signature of white noise.