EUMETSAT Annual Report 2022

Create successful ePaper yourself
Turn your PDF publications into a flip-book with our unique Google optimized e-Paper software.
<strong>EUMETSAT</strong> ANNUAL REPORT <strong>2022</strong><br />
Case study<br />
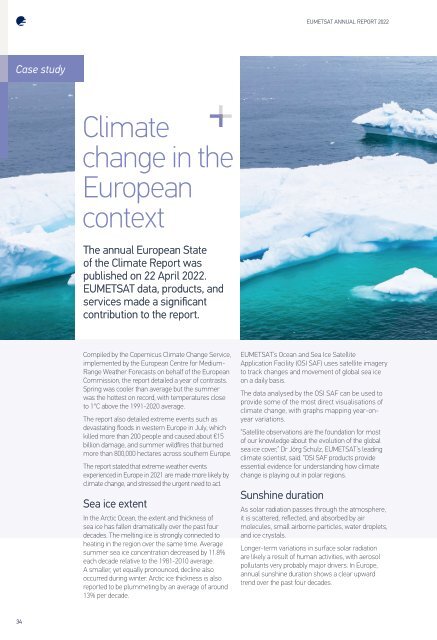
Climate<br />
change in the<br />
European<br />
context<br />
The annual European State<br />
of the Climate <strong>Report</strong> was<br />
published on 22 April <strong>2022</strong>.<br />
<strong>EUMETSAT</strong> data, products, and<br />
services made a significant<br />
contribution to the report.<br />
Compiled by the Copernicus Climate Change Service,<br />
implemented by the European Centre for Medium-<br />
Range Weather Forecasts on behalf of the European<br />
Commission, the report detailed a year of contrasts.<br />
Spring was cooler than average but the summer<br />
was the hottest on record, with temperatures close<br />
to 1°C above the 1991-2020 average.<br />
The report also detailed extreme events such as<br />
devastating floods in western Europe in July, which<br />
killed more than 200 people and caused about €15<br />
billion damage, and summer wildfires that burned<br />
more than 800,000 hectares across southern Europe.<br />
The report stated that extreme weather events<br />
experienced in Europe in 2021 are made more likely by<br />
climate change, and stressed the urgent need to act.<br />
Sea ice extent<br />
In the Arctic Ocean, the extent and thickness of<br />
sea ice has fallen dramatically over the past four<br />
decades. The melting ice is strongly connected to<br />
heating in the region over the same time. Average<br />
summer sea ice concentration decreased by 11.8%<br />
each decade relative to the 1981-2010 average.<br />
A smaller, yet equally pronounced, decline also<br />
occurred during winter. Arctic ice thickness is also<br />
reported to be plummeting by an average of around<br />
13% per decade.<br />
<strong>EUMETSAT</strong>’s Ocean and Sea Ice Satellite<br />
Application Facility (OSI SAF) uses satellite imagery<br />
to track changes and movement of global sea ice<br />
on a daily basis.<br />
The data analysed by the OSI SAF can be used to<br />
provide some of the most direct visualisations of<br />
climate change, with graphs mapping year-onyear<br />
variations.<br />
“Satellite observations are the foundation for most<br />
of our knowledge about the evolution of the global<br />
sea ice cover,” Dr Jörg Schulz, <strong>EUMETSAT</strong>’s leading<br />
climate scientist, said. “OSI SAF products provide<br />
essential evidence for understanding how climate<br />
change is playing out in polar regions.<br />
Sunshine duration<br />
As solar radiation passes through the atmosphere,<br />
it is scattered, reflected, and absorbed by air<br />
molecules, small airborne particles, water droplets,<br />
and ice crystals.<br />
Longer-term variations in surface solar radiation<br />
are likely a result of human activities, with aerosol<br />
pollutants very probably major drivers. In Europe,<br />
annual sunshine duration shows a clear upward<br />
trend over the past four decades.<br />
34