RA BRS 2003 GB >pdf
RA BRS 2003 GB >pdf
RA BRS 2003 GB >pdf

Create successful ePaper yourself
Turn your PDF publications into a flip-book with our unique Google optimized e-Paper software.
26<br />
year (with the Dardenelles transit only permitted in<br />
daylight hours) these add at least another two<br />
days to voyage times. With an ever-increasing rise<br />
in traffic, there are real jams, which can double the<br />
theoretical transit time. This simple measure naturally<br />
affects tonnage availability and helps push<br />
rates higher.<br />
As already mentioned, West Africa is in the process<br />
of losing its position as a driving force, even<br />
though it still represents an important share of the<br />
global traffic, especially towards the U.S.. On this<br />
route the average rate experienced this year was<br />
around WS 78,5 compared to an average in 2001<br />
close to WS 110.<br />
During the first nine months of the year, with the<br />
exception of a slight hike in June, returns remained<br />
below $15,000 per day. Proof of the predominant<br />
influence of economic events on rates, this<br />
size of tankers has remained globally balanced in<br />
terms of numbers for many years. Thus since<br />
1998, 106 new units (15,9 million dwt) have been<br />
delivered while 107 (14,7 million dwt) have been<br />
scrapped.<br />
2002 however differed slightly from preceding years<br />
with 25 units delivered as compared to only 15 ships<br />
withdrawn from the fleet. Another important phenomena<br />
in relation to previous years was the<br />
conversion of units destined to the offshore market<br />
being more favourable to VLCC than to Suezmax.<br />
Consequently only 2 old Suezmax were converted in<br />
2002 as compared to half a dozen VLCCs.<br />
US$/day<br />
80,000<br />
70,000<br />
60,000<br />
50,000<br />
40,000<br />
30,000<br />
20,000<br />
10,000<br />
Shipping and Shipbuilding Markets <strong>2003</strong><br />
0<br />
Jan 00<br />
Feb 00<br />
Mar 00<br />
May 00<br />
June 00<br />
July 00<br />
Sep 00<br />
Oct 00<br />
Dec 00<br />
Jan 01<br />
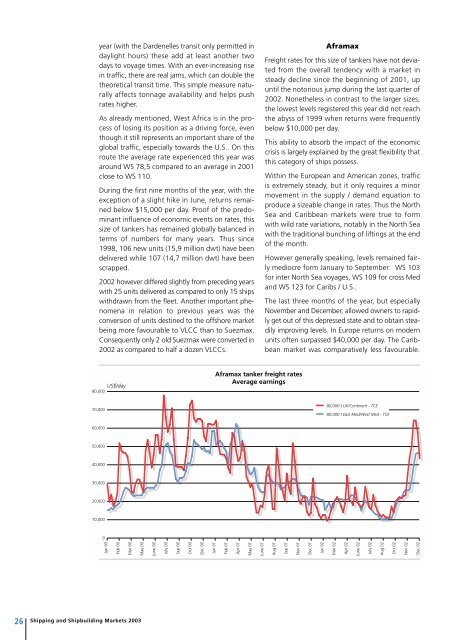
Aframax tanker freight rates<br />
Average earnings<br />
Feb 01<br />
Apr 01<br />
May 01<br />
June 01<br />
Aframax<br />
Freight rates for this size of tankers have not deviated<br />
from the overall tendency with a market in<br />
steady decline since the beginning of 2001, up<br />
until the notorious jump during the last quarter of<br />
2002. Nonetheless in contrast to the larger sizes,<br />
the lowest levels registered this year did not reach<br />
the abyss of 1999 when returns were frequently<br />
below $10,000 per day.<br />
This ability to absorb the impact of the economic<br />
crisis is largely explained by the great flexibility that<br />
this category of ships possess.<br />
Within the European and American zones, traffic<br />
is extremely steady, but it only requires a minor<br />
movement in the supply / demand equation to<br />
produce a sizeable change in rates. Thus the North<br />
Sea and Caribbean markets were true to form<br />
with wild rate variations, notably in the North Sea<br />
with the traditional bunching of liftings at the end<br />
of the month.<br />
However generally speaking, levels remained fairly<br />
mediocre form January to September: WS 103<br />
for inter North Sea voyages, WS 109 for cross Med<br />
and WS 123 for Caribs / U.S..<br />
The last three months of the year, but especially<br />
November and December, allowed owners to rapidly<br />
get out of this depressed state and to obtain steadily<br />
improving levels. In Europe returns on modern<br />
units often surpassed $40,000 per day. The Caribbean<br />
market was comparatively less favourable.<br />
Aug 01<br />
Sep 01<br />
Nov 01<br />
Dec 01<br />
Jan 02<br />
80,000 t UK/Continent - TCE<br />
80,000 t East Med/West Med - TCE<br />
Mar 02<br />
Apr 02<br />
June 02<br />
July 02<br />
Aug 02<br />
Oct 02<br />
Nov 02<br />
Dec 02