RA BRS 2003 GB >pdf
RA BRS 2003 GB >pdf
RA BRS 2003 GB >pdf

Create successful ePaper yourself
Turn your PDF publications into a flip-book with our unique Google optimized e-Paper software.
SHIPPING<br />
AND<br />
SHIPBUILDING<br />
MARKETS<br />
<strong>2003</strong><br />
Shipbrokers since 1856
SHIPPING<br />
AND<br />
SHIPBUILDING<br />
MARKETS<br />
<strong>2003</strong><br />
The <strong>BRS</strong> annual review of world shipping<br />
and shipbuilding developments in 2002<br />
and prospects for the coming months…<br />
●<br />
●<br />
●<br />
●<br />
●<br />
●<br />
●<br />
●<br />
●<br />
●<br />
●<br />
●<br />
●<br />
●<br />
●<br />
1 Foreword<br />
3 The shipbuilding market in 2002<br />
17 The cruise market in 2002<br />
23 The tanker market in 2002<br />
37 The offshore market in 2002<br />
45 The chemical carrier market in 2002<br />
49 The liquefied petroleum gas shipping market in 2002<br />
57 The liquefied natural gas shipping market in 2002<br />
65 The dry bulk market in 2002<br />
75 The containership market in 2002<br />
85 The ro-ro market in 2002<br />
89 The reefership market in 2002<br />
95 The marine insurance markets in 2002<br />
99 French shipyards deliveries and orderbook in 2002<br />
102 French orders to foreign shipyards in 2002
Once again we are outraged and helpless<br />
spectators of a massive oil pollution on<br />
the Atlantic seaboard with serious consequences<br />
to all coastal livelihood : fishing, oyster<br />
farming, tourism, etc.<br />
Faced with such a wasteful tragedy, the media<br />
has blasted off at the shipping industry, and elected<br />
representatives - local, regional or national –<br />
justifiably are trying to transform their indignation<br />
into rapid and salutary actions.<br />
Unfortunately the sea imposes a certain humility<br />
and the simplistic debates do not resolve the<br />
complex realities, be they technical, economic or<br />
financial.<br />
Technically, first of all, it is worth repeating again<br />
that an old ship is not necessarily a dangerous<br />
ship if she has been well maintained, and that a<br />
double-hull vessel could prove to be an efficient<br />
WORDS<br />
AND<br />
FACTS<br />
solution in the specific case of ship running<br />
aground or a collision at slow speed, but there<br />
are also some foreseeable concerns given the<br />
increased difficulties of inspection and maintenance.<br />
It is therefore by controlling ships in ports<br />
and by tightening classification standards that<br />
efforts should be directed in order to eliminate<br />
the black sheep from the seas.<br />
Economically it is not possible to eliminate the<br />
total fleet of single-hull tankers before 2010,<br />
which still comprises some 2,000 units. Neither<br />
the scrapyards nor the shipyards are able to keep<br />
up with such a replacement pace.<br />
In addition it would undermine the tenor of international<br />
conventions, which have laboriously<br />
been drawn up and signed under the aegis of the<br />
IMO, which it should be remembered is part of<br />
the U.N. – behind which Europe is happy to stand<br />
in other matters.<br />
<strong>BRS</strong> - Foreword<br />
1
And finally financially, shipping requires heavy<br />
investment, which can only be entertained within<br />
a well-defined general framework.<br />
To cut short prematurely the life span of a ship, to<br />
remove the ceilings of insured, and to eliminate<br />
the trading in some economic zones would inevitably<br />
lead to the insolvency of numerous owners.<br />
What is necessary is neither a lax nor a lenient<br />
attitude but rather a strict application of all the<br />
controls, rules and regulations currently in place,<br />
which all lead to the improvement in the quality<br />
of the fleet and thus reduce the risk of accidents.<br />
It is worth restating that shipping accounts for<br />
over 90 % of the world transport needs and that<br />
it remains the safest and the least polluting<br />
means of transport. Over the last twenty years,<br />
shipping pollution in the form of oil spills and<br />
waste has been reduced tenfold. Whilst it is still<br />
too much, the improvement should nonetheless<br />
be recognised.<br />
Let us not adopt a NIMBY attitude (“not in my<br />
back yard”) which is a good illustration of the<br />
paradox between the generous theorising and<br />
the egotistical individualism, which permitted the<br />
Spanish to send the ‘Prestige’ out to a raging sea<br />
to sink at a depth of 3,500 meters, thus making<br />
uncertain any pumping solution and consequently<br />
causing the coastline of three countries to<br />
become polluted for a prolonged period.<br />
In the same vein, Europe, by closing off its ports<br />
too quickly to the so-called dangerous ships is<br />
simply displacing them to less developed or less<br />
demanding economic areas.<br />
The European Atlantic zone is unfortunately one<br />
of the busiest shipping axes and as “zero risk”<br />
does not exist at sea, it is necessary in addition to<br />
preventive measures also to put in place efficient<br />
remedial measures that in our opinion can only<br />
be European.<br />
We should have the courage to immediately assign<br />
along the coastline certain ports or “refuge”<br />
zones where any pollution can be properly<br />
contained and pumping carried out. Such a decision<br />
can only be taken at the highest national<br />
level, or even European, as it is clearly not reasonable<br />
to place such a responsibility on local or<br />
regional representatives.<br />
At the same time indemnities should be fairly and<br />
quickly distributed. Why not form a European fund<br />
complementary to FIPOL, which could be financed<br />
through a tax on the consumption of oil products,<br />
as it is not in holding the charterer, shipowner or<br />
the owner of the cargo liable beyond all reasonable<br />
and insurable limits, that such an amount<br />
will be found ? If this were to be the case, all the<br />
serious and financially solvent players would then<br />
disappear from shipping and give their place to<br />
irresponsible owners, both in the literal and figurative<br />
sense. The ‘Prestige‘ is a case in point.<br />
The ‘Erika’ tragedy has accelerated the rejuvenation<br />
of the fleet. Let us hope that the ‘Prestige’<br />
will only help accentuate the movement, and<br />
whilst we can all be pleased with this trend it is<br />
not enough in itself.<br />
In France, the new government is to be thanked<br />
for its efforts to listen and pay serious attention<br />
to shipping problems, which had been ignored<br />
for some time. The tonnage tax, which already<br />
exists in several European countries, has been<br />
passed at the end of 2002 and a think-tank is<br />
currently looking at the question of French flag<br />
and European short-sea developments. We hope<br />
that this will prove fruitful with the assistance of<br />
all concerned parties.<br />
Players in the shipping world are by an overwhelming<br />
majority serious, competent, and concerned<br />
to preserve our maritime environment. Rantings<br />
and ravings, and sterile theorising do not help to<br />
advance one of the most wondrous of causes,<br />
that of the sea. ■<br />
2 <strong>BRS</strong> - Shipping and Shipbuilding Markets <strong>2003</strong>
THE<br />
SHIPBUILDING<br />
MARKET<br />
IN<br />
2002<br />
The year 2002 was marked by:<br />
1. A large drop in the volume of orders in the first<br />
half, giving the impression that the world orderbook<br />
was going to be reduced significantly for the first<br />
time since 1993. An important recovery takes place<br />
however during the second half and more particularly<br />
in the fourth quarter, notably in Japan but also<br />
in Korea, to such an extent that the world orderbook<br />
ended the year against all expectations on an<br />
increase over 2001 with more than 75 million tons.<br />
2. Korea confirms its place as the leading shipbuilding<br />
country with an orderbook of about 31 million<br />
gt, followed by Japan with nearly 25 million<br />
gt. Shipyard mergers take place in these two countries.<br />
Chinese shipbuilding is still on a rising trend<br />
with a total of 9.1 million gt on order reached at<br />
the end of 2002. Yards continue to expand with<br />
the opening of new docks despite a global overcapacity<br />
in the market. European shipbuilding is<br />
struggling to keep up with a modest 6.24 million<br />
gt on order against more than 8 million gt at the<br />
beginning of the 90’s. The number of orders in<br />
sectors where it is traditionally strong (ro-ros ships,<br />
ferries, cruise ships) remains weak and it is neither<br />
taking advantage of the revived demand in chemical<br />
carriers, which substantially benefits to<br />
Japan, nor of the sustained level of orders for LNG<br />
carriers. Lays off and closures are being announced<br />
and some shipyards go bankrupt.<br />
3. Newbuilding prices continue to drop in the first<br />
half of the year up until the autumn. These reductions<br />
(up to 15 % when compared to 2001) are<br />
not evenly spread and depend on the type and size<br />
of ship as well as the level of competitiveness between<br />
the shipyards. It is very noticeable whenever<br />
demand is weak (containerships and large-size<br />
tankers) and less so for bulk carriers. At the beginning<br />
of the autumn, prices for these big ships start<br />
to increase with the recovery in demand.<br />
The Shipbuilding Market in 2002<br />
3
IMF Forecast (in GNP %)<br />
4<br />
Shipping and Shipbuilding Markets <strong>2003</strong><br />
4. The sinking of the ‘Prestige’, a 26 years old<br />
single-hulled tanker which was carrying 77,000<br />
tons of heavy fuel oil, created a new dramatic oil<br />
spill, the third in less than four years in European<br />
waters, after those of the ‘Erika’ (December 1999)<br />
and the ‘Baltic Carrier’ (April 2001). Following the<br />
initial declarations of European politicians calling<br />
for a tightening of regulation, numerous owners<br />
rush at shipyards to negotiate early deliveries.<br />
These collective requests induce price increases in<br />
the order of 5 to 10 % compared to the lowest<br />
levels of the year.<br />
◆ ◆ ◆<br />
With a world GNP increase around 2.8 %, the year<br />
2002 remained a year of little economic growth. It<br />
is nonetheless slightly better than 2001, which had<br />
a GNP rise of 2.2 %, one of the lowest in the last<br />
ten years.<br />
World USA Japan E.U Korea China<br />
2001 2.2 0.3 -0.3 1.6 3.0 7.3<br />
2002 2.8 2.2 -0.5 1.1 3.2 7.5<br />
<strong>2003</strong> 3.7 2.6 1.1 2.3 5.9 7.2<br />
IMF - September 2002<br />
World trade growth has expanded in 2002 by<br />
nearly 3 % whereas in 2001 it had been flat.<br />
Freight rates in the three principal mainstays of the<br />
shipping market, oil, dry bulk, and containers,<br />
which had dropped considerably in 2001, stabilise<br />
Index 1,000 = Jan. 98<br />
3,500<br />
3,000<br />
2,500<br />
2,000<br />
1,500<br />
1,000<br />
500<br />
0<br />
Jan 98<br />
Apr 98<br />
Jul 98<br />
Oct 98<br />
Jan 99<br />
Apr 99<br />
Jul 99<br />
Freight rates evolution since 1998<br />
Containership 1,700 teu<br />
Baltic Dry Index (BDI)<br />
VLCC 250,000 t MEG/Japan<br />
Oct 99<br />
Jan 00<br />
Apr 00<br />
%<br />
14<br />
12<br />
10<br />
8<br />
6<br />
4<br />
2<br />
0<br />
2000<br />
at the start of the summer and go back up as from<br />
September 2002.<br />
Nonetheless, the economic climate, weak freight<br />
rates, a hazy visibility and international tensions<br />
have a combined effect and help deter owners<br />
from the shipbuilding market during the first half<br />
of the year up until the autumn.<br />
Low shipbuilding prices no longer seem to be sufficient<br />
to incite potential buyers. Shipyards, whose<br />
orderbooks go through up until 2004 or even<br />
beyond, are not convinced either they should<br />
lower their prices in order to stimulate this new<br />
demand, which would allow them to balance their<br />
orderbooks and to reach their commercial objec-<br />
Jul 00<br />
Oct 00<br />
Jan 01<br />
2001<br />
Apr 01<br />
General trends<br />
Jul 01<br />
Oct 01<br />
Jan 02<br />
2002<br />
Apr 02<br />
World GDP<br />
World trade<br />
Jul 02<br />
Oct 02<br />
<strong>2003</strong>
tives set at the beginning of the year. Such is the<br />
case that the volume of new orders shrinks to the<br />
point that in September the world orderbook falls<br />
below the 70 million tons mark.<br />
This drop in the volume of orders during the first<br />
three quarters affects principally Europe and<br />
China. Japan which is largely specialised in the<br />
building of dry bulk carriers, is able to profit from<br />
% dwt of fleet on order<br />
30<br />
25<br />
20<br />
15<br />
10<br />
5<br />
0<br />
1990<br />
1991<br />
1992<br />
1993<br />
1994<br />
1995<br />
1996<br />
the new interest in this sector linked to renewal<br />
needs, given the very low level of Capesize and<br />
Panamax orders. Japan notches up more new<br />
New orders during the year<br />
Percentage of the active fleet on order by type<br />
1997<br />
1998<br />
Oil Tanker<br />
Bulk<br />
Containership<br />
1999<br />
2000<br />
2001<br />
2002<br />
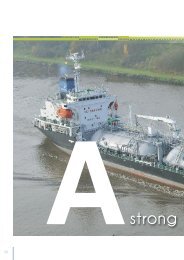
Bro Ellen<br />
37,300 dwt Product<br />
& Chemical tanker,<br />
blt 2002 by Treci Maj,<br />
owned by Broström<br />
Tankers S.A.<br />
(million dwt) 1999 2000 2001 2002<br />
Tankers > 25,000 dwt 12.4 34.6 25.0 19.9<br />
Bulkers > 15,000 dwt 21.9 17.6 7.7 21.6<br />
Containerships > 1,000 teu 7.0 13.7 7.1 7.4<br />
The Shipbuilding Market in 2002<br />
5
6<br />
dwt<br />
18,000,000<br />
16,000,000<br />
14,000,000<br />
12,000,000<br />
10,000,000<br />
8,000,000<br />
6,000,000<br />
4,000,000<br />
2,000,000<br />
Newbuilding prices variations (in million US$)<br />
Shipping and Shipbuilding Markets <strong>2003</strong><br />
0<br />
53<br />
17 16<br />
VLCC Suezmax Aframax Panamax MR Products Capesize Panamax Handysize Containership<br />
tankers<br />
(above 1,000 teu)<br />
orders than Korea, which is more focused on building<br />
containerships and tankers.<br />
In the autumn, the increase in freight rates linked to<br />
shipbuilding prices at historic lows helps provoke a<br />
very strong demand, to such an extent that the<br />
world orderbook finished the year at a level higher<br />
to that of 2001.<br />
In 2002, we enter into a new cycle for bulk carriers<br />
with a very strong demand for Capesize (50 units<br />
ordered which is the most in the decade) and Panamax<br />
(no less than 75 units ordered whereas the<br />
orderbook for this type of ship in July 2002 had fallen<br />
to 49 units). But 2002 is also marked by a strong<br />
demand for Aframax tankers (44 units ordered).<br />
Within specialised tonnage, there is a strong interest<br />
for chemical tankers (54 stainless steel units were<br />
ordered), after two years of weak demand. Orders<br />
for ferries and ro-ros are limited and correspond to<br />
needs for renewing. Car carrier orders remain steady<br />
but important renewal programmes are launched<br />
by Japanese operators NYK, Mitsui and K Line.<br />
4Q 2000 4Q 2001 Oct. 2002 End 2002 1992<br />
Tankers VLCC 78 70 63 66 101<br />
Suezmax 52 45 43 45 64<br />
Aframax 41 36 33.5 36 50<br />
IMO II 45,000 dwt 29 26 26.5 29 33<br />
Bulkers Capesize 40 36 35 36 47<br />
Panamax 23 20 20.5 21 30<br />
Handymax 21 19 18 19 25<br />
44<br />
21 18<br />
Standards vessels contracting 2000-2001-2002<br />
65<br />
82<br />
44<br />
2<br />
33<br />
46<br />
106<br />
130<br />
94<br />
28<br />
19<br />
50<br />
64<br />
22<br />
76<br />
2000<br />
2001<br />
2002<br />
There is little interest for LPG carriers: only 7 new<br />
contracts are sealed exclusively with Japanese and<br />
Korean yards. Freight rates in this sector have never<br />
been so low and the number of idle ships weighs heavily<br />
on the market. Ordering activity for LNG carriers<br />
has remained healthy with 16 new contracts concluded,<br />
which is the third best figure for the decade.<br />
Cruise ship operators are sitting on the fence : only<br />
3 cruise ships are ordered in 2002, which is far from<br />
the 25 contracts of 1999. New investments are<br />
hoped for in <strong>2003</strong>.<br />
As previously indicated, a significant drop in prices<br />
was experienced in 2002. Ships least in demand<br />
and being normally ordered in series like large<br />
containerships, gave rise to a fierce competition<br />
between shipyards resulting in important rebates<br />
(-15 %) ; the same applies to VLCC (-10 %) which<br />
still carry a considerable attraction for shipyards.<br />
It seems that a floor price was reached at the beginning<br />
of the autumn. Shipyards revises their prices<br />
upwards due to the strong recovery in demand,<br />
brought about by improved freight rates but also by<br />
the anticipation of tighter regulation following the<br />
‘Prestige’ disaster (November 2002). In practice, the<br />
first declarations by politicians from countries affected<br />
by the pollution, calling for an accelerated phasing-out<br />
of single-hull tankers or to forbid singlehull<br />
tankers to carry heavy fuel oil in European<br />
waters, was enough to incite some tanker owners<br />
to negotiate with builders for new tonnage, leading<br />
to price increases at the end of the year.<br />
203<br />
73<br />
169<br />
315<br />
159 137
Nb of vessels<br />
60<br />
50<br />
40<br />
30<br />
20<br />
10<br />
0<br />
This price hike could well carry through into <strong>2003</strong> in<br />
the light of the desire by authorities to tighten existing<br />
controls and to put them into immediate effect. This<br />
will depend equally on the recovery of the economic<br />
growth, which is continually getting postponed.<br />
Japan<br />
At the end of the year Japan boasts an orderbook<br />
of 25 million gt, its best performance since the oil<br />
shock of 1973. It may be recalled that in 1973<br />
m.gt/m.$<br />
120<br />
100<br />
80<br />
60<br />
40<br />
20<br />
0<br />
1990<br />
484,425<br />
262,100<br />
939,050<br />
Chemical carriers<br />
(dwt)<br />
1991<br />
Japan recorded 33 million gt of new orders and that<br />
in 1974 the Japanese orderbook stood at 50 million<br />
gt, out of a world total of 120 million gt.<br />
The level of orders contracted in 2002 surpasses 12<br />
million gt according to the statistics of the Japanese<br />
Shipbuilders Exporters Association (JSEA). Japanese<br />
shipyards sign contracts for 201 bulk carriers,<br />
more than double last year’s figure. Japan also<br />
manage to secure 9 out of the 16 orders for LNG<br />
carriers in 2002 whilst Korea succeeded in securing<br />
20 out of 27 last year.<br />
World orderbook growth vs newbuilding prices decrease since 1990<br />
1992<br />
922,850<br />
830,500<br />
341,600<br />
LPG carriers<br />
(cbm)<br />
1993<br />
Specialised vessel contracting 2000-2001-2002<br />
2,485,000<br />
LNG carriers<br />
(cbm)<br />
1994<br />
3,601,700<br />
2,209,100<br />
1995<br />
487,444<br />
119,353<br />
Ferries<br />
(grt)<br />
1996<br />
371,600<br />
1997<br />
276,500<br />
118,072<br />
Ro-ro<br />
(dwt)<br />
90,100<br />
1998<br />
VLCC newbuilding price (m.$)<br />
Capesize newbuilding (m.$)<br />
World orderbook (m.gt)<br />
1999<br />
105,595<br />
63,059<br />
163,450<br />
Car carriers<br />
(cars)<br />
2000<br />
2000<br />
2001<br />
2002<br />
1,427,200<br />
Cruise vessels<br />
(grt)<br />
2001<br />
58,600<br />
228,000<br />
2002<br />
The Shipbuilding Market in 2002<br />
7
8<br />
US$<br />
1.40<br />
1.35<br />
1.30<br />
1.25<br />
1.20<br />
1.15<br />
1.10<br />
1.05<br />
1.00<br />
0,95<br />
0,90<br />
0.85<br />
0.80<br />
Jan 01<br />
Feb 01<br />
Mar 01<br />
Shipping and Shipbuilding Markets <strong>2003</strong><br />
Apr 01<br />
May 01<br />
Jun 01<br />
Its market share increases, going from 25 % to<br />
nearly 32 % of the world orderbook.<br />
Once again, Japanese builders are able to take<br />
advantage of the weakness of the yen compared<br />
to the dollar. The Japanese currency goes over 135<br />
yen/$ in January before appreciating to 115 yen/$<br />
in July.<br />
On October 1 st 2002, NKK and Hitachi merge their<br />
shipbuilding activities by creating Universal Shipbuilding<br />
Corporation (USC) and initiate the way to<br />
the first major restructuring of shipbuilding in<br />
Japan. At a time when it is important to be large<br />
enough to benefit from economies of scale, USC<br />
becomes the second largest shipbuilder in Japan<br />
with Imabari, behind Mitsubishi Heavy Industries.<br />
IHI and Sumitomo Heavy Industries formed IHI Marine<br />
United in October 2002.<br />
Kawasaki Heavy Industries makes their shipbuilding<br />
an affiliated company, which could allow mergers<br />
with other shipyards in the near future.<br />
South Korea<br />
In 2002, Korea keeps its first place as world shipbuilder<br />
with 31 million gt. They announce to have<br />
exceeded $10 billion in exports in 2002, 33 years<br />
after having delivered their first contract, a fishing<br />
boat to a Taiwanese owner.<br />
New orders reach 13.7 million gt this year against<br />
close to 11.5 million in 2001, despite a substantial<br />
Jul 01<br />
Aug 01<br />
Average exchange rates with the US$<br />
Sep 01<br />
Oct 01<br />
Nov 01<br />
Dec 01<br />
Jan 02<br />
Feb 02<br />
Mar 02<br />
Apr 02<br />
May 02<br />
Jun 02<br />
drop in the first three quarters of the year when<br />
compared to the previous year. This performance<br />
was made possible thanks to the tripling of orders<br />
in the fourth quarter, according to the statistics<br />
given by the Korean Ministry of Commerce, Industry<br />
and Energy (MOCIE). Orders placed in November<br />
and December alone represent 44 % of the<br />
total demand for the year, according to the same<br />
source.<br />
Korea reinforces its position in sectors, which it has<br />
recently targeted. 54 of the 94 shipbuilding<br />
contracts for product tankers (MR) made in 2002<br />
were done in Korean yards, and likewise for 16 out<br />
of 18 Suezmaxes.<br />
During the last quarter 2002, Korea was able to sign<br />
up for 21 containerships over 5,000 teu (41 out of<br />
an annual total of 51), of which the first ships<br />
having an official capacity of more than 8,000 teu.<br />
On January 1 st <strong>2003</strong>, Samho Heavy Industries, ex<br />
Halla, changed its name to become Hyundai<br />
Samho, after having been taken over by Hyundai<br />
Heavy Industries in March 2002. This new entity<br />
now comprises three sites for shipbuilding: Hyundai<br />
Heavy Industries, Hyundai Mipo, and Hyundai<br />
Samho that consolidates its position as the world’s<br />
largest shipbuilder.<br />
China<br />
The volume of new orders significantly progressed<br />
in 2002 by 22.9 %, despite a slow start to the year<br />
Jul 02<br />
100 yen<br />
1,000 won<br />
1 euro<br />
Aug 02<br />
Sep 02<br />
Oct 02<br />
Nov 02<br />
Dec 02
%<br />
100<br />
90<br />
80<br />
70<br />
60<br />
50<br />
40<br />
30<br />
20<br />
10<br />
0<br />
and the orderbook for Chinese yards increased<br />
from 7.4 million gt at the end 2001 to about 9.1<br />
million gt one year later.<br />
Expansion projects are nonetheless being pursued.<br />
To the 6 existing VLCC docks, the following should<br />
be added:<br />
◆ Dalian New Shipyard (DNS) : a new dock (total<br />
two)<br />
◆ Dalian Shipyard: one dock<br />
◆ Qingdao: four docks (two for newbuilding and<br />
two for repairs)<br />
In comparison, Japan and Korea have respectively<br />
nine and twelve VLCC docks.<br />
DNS and NACKS have each delivered their first<br />
VLCC this year, respectively to NITC and COSCO.<br />
Shipbuilding countries market shares evolution for tankers<br />
Sep 98 Dec 98 Mar 99 Jun 99 Sep 99 Dec 99 Mar 00 Jun 00 Sep 00 Dec 00 Mar 01 Jun 01 Sep 01 Dec 01 Mar 02 Jun 02 Sep 02 Dec 02<br />
Hudong-Zhonghua signed an agreement for a<br />
transfer of technology with Chantiers de l’Atlantique<br />
and should be the shipyard finally chosen to<br />
build two LNG carriers (plus an optional three) of<br />
147,200 cbm using the GTT membrane containment<br />
system, which will supply natural gas to the<br />
province of Guangdong. Other shipyards have<br />
shown interest in the building of these ships, such<br />
as DNS, NACKS and Jiangnan – Waogaoqiao which<br />
should also take their share in this domestic market.<br />
The Chinese orderbook increase clearly indicates<br />
their wish to rapidly achieve the 10 million tons<br />
mark, despite the revival of Japanese and South<br />
Korean competition, offering better delivery dates<br />
and benefiting from their excellent reputation.<br />
The fixed parity of the yuan to the dollar could act<br />
as a handicap for Chinese shipyards, compared to<br />
their Japanese and Korean counterparts.<br />
Taiwan<br />
Japan<br />
Korea<br />
Others<br />
The rebirth of the China Shipbuilding shipyard, following<br />
a severe restructuring, has led to a return<br />
to profits. That yard could be privatised in <strong>2003</strong>.<br />
Orientor 2<br />
49,400 dwt bulk carrier,<br />
blt 2002 by NACKS,<br />
owned by SETAF S.A.<br />
The Shipbuilding Market in 2002<br />
9
10<br />
%<br />
100<br />
Shipping and Shipbuilding Markets <strong>2003</strong><br />
90<br />
80<br />
70<br />
60<br />
50<br />
40<br />
30<br />
20<br />
10<br />
0<br />
Due to a relatively light workload they were in a<br />
position to take orders for an important number of<br />
large containerships, Capesize and Panamax bulk<br />
carriers.<br />
Europe<br />
New orders are in sharp decline and market share<br />
of European shipyards is slowly being whittled<br />
down, going from over 11 % at the end of 2001 to<br />
8.3 % at the end of 2002.<br />
The striking point lays more in the decline in the<br />
orderbook of European shipyards than that of their<br />
market share. In practice, the former fluctuated<br />
within a range between 8 and 9 million tons right<br />
throughout the 90’s. This year, it went from 8.5 million<br />
tons to 6.2 million tons.<br />
This highlights the huge difficulties of European<br />
shipbuilders when confronted with a fall in prices.<br />
These same yards were able to notch up at the end<br />
of 2000 orders up to 3 years in circumstances much<br />
more favourable than in 2002. They then combined<br />
three advantages:<br />
◆ firmer levels of prices (a better economic climate<br />
and a stronger demand),<br />
◆ subsidies up to 9 % of the sales price,<br />
◆ a more favourable dollar/euro exchange rate in a<br />
market where ship’s values are normally expressed<br />
in dollars.<br />
Overall conditions are quite different today.<br />
Shipbuilding countries market shares evolution for containerships<br />
Japan<br />
Korea<br />
Germany<br />
Others<br />
Sep 98 Dec 98 Mar 99 Jun 99 Sep 99 Dec 99 Mar 00 Jun 00 Sep 00 Dec 00 Mar 01 Jun 01 Sep 01<br />
Dec 01 Mar 02 Jun 02 Sep 02 Dec 02<br />
Demand for specialised ships, which comprises a large<br />
part of European production (cruise ships, ro-ros, ferries,<br />
chemical carriers, LNG carriers) has remained<br />
weak or has been displaced towards Far Eastern yards.<br />
Thus, the major chemical tankers operators like<br />
Stolt-Nielsen or Jo Tankers who ordered series of<br />
ships built in Europe in the 90’s, have turned<br />
towards Japanese shipyards. One should note<br />
however that European yards capable of building<br />
ships of this type are becoming more and more<br />
scarce. A large part of these orders for chemical<br />
carriers fitted with stainless steel tanks have been<br />
placed by Japanese owners, either on long-term<br />
employment with these European operators, or for<br />
domestic account. These chemical carriers have<br />
fewer tanks and segregations and generally speaking<br />
are less sophisticated than the ships ordered<br />
in the 90’s, built by European yards. But the competition<br />
is so intense today that operators are obliged<br />
to reconsider their technical preferences.<br />
Japanese shipyards have been pursuing for a number<br />
of years a path of standardising ships, better<br />
suited for the industrialisation and thus giving a better<br />
control over costs.<br />
Cruise ship operators who made massive investments<br />
in 1999 and 2000 are waiting in the wings.<br />
Only three orders were placed in 2002 after only<br />
one in 2001.<br />
European shipyards, with the exception of one,<br />
have not been able to get orders for LNG carriers<br />
despite a steady demand.
Several European shipyards have gone bankrupt or<br />
are in the process of going into liquidation: in Norway<br />
(Fosen – Mjellem & Karlsen), in Germany (Flenderwerft<br />
– SSW), in Italy (Fratelli Orlando), in Northern<br />
Ireland (Harland & Wolff), with continuation of their<br />
activities or not (Szczesin). Orskov (Denmark) announced<br />
that it will stop its newbuilding activities in the<br />
course of <strong>2003</strong>. Others have announced partial<br />
unemployment or lays off to match their orderbooks.<br />
The dispute between European shipyards and their<br />
Korean counterparts is still going on. The Brussels<br />
Commission has finally registered a complaint with<br />
the World Trade Organisation and has proposed to<br />
re-establish, as a temporary means of defence<br />
(awaiting the outcome of this action), subsidies for<br />
shipbuilding up to 6 % for a period of 18 months<br />
starting from October 1 st 2002 for certain types of<br />
ships such as containerships, product tankers and<br />
chemical carriers.<br />
The depreciation of the dollar against the euro of<br />
about 17% unfortunately makes any such aid meaningless<br />
in a market largely dominated by dollar<br />
transactions.<br />
European shipyards know today that they can only<br />
rely on themselves to survive. The strategies being<br />
adopted are various. More and more yards are trying<br />
to keep afloat by sub-contracting the construction<br />
of the hulls to East European countries or to Ukraine<br />
whilst remaining prime contractors and securing<br />
outfitting. Some shipyards like Aker, Damen, A.P.<br />
Moller have even invested in facilities in Romania,<br />
Ukraine or Lithuania. Other shipyards are counting<br />
on military orders (Izar, Fincantieri, HDW).<br />
A further reduction in the production capacity in<br />
Europe is again foreseeable for this year.<br />
France<br />
The shipbuilding orderbook in France has gone from<br />
670,000 tons end 2001 to 464,000 tons end 2002.<br />
Chantiers de l’Atlantique had no orders for cruise<br />
ships in 2002, but got the order for the construction<br />
of a LNG carrier on account of Gaz de France.<br />
This is a first to the extent that the ship’s propulsion<br />
is with a dual diesel gas-electric engine as opposed<br />
to all previous LNG carriers, which are equipped<br />
with steam-turbines. This method of propulsion<br />
offers two considerable advantages to the owner :<br />
important energy savings due to a much lower<br />
consumption and an increased cargo capacity for<br />
the same size of vessel.<br />
Chantiers de l’Atlantique still enjoy a relatively<br />
healthy orderbook which runs through to 2004,<br />
with 5 cruise ships, a frigate for the Royal Moroccan<br />
Navy, and two LPD contracts for the DCN and<br />
the 74,000 cbm LNG carrier. In order to remain<br />
fully employed, new orders will however be necessary<br />
in <strong>2003</strong>.<br />
They delivered the following ships this year:<br />
◆ the ‘Constellation’, a cruise ship of 1,950 passengers<br />
to Celebrity Cruises,<br />
◆ the ‘European Stars’, a cruise ship of 1,506 passengers<br />
to Festival Cruises,<br />
◆ the ‘Coral Princess’, a cruise ship of 1,950 passengers<br />
for P&O Princess,<br />
◆ a frigate for the Royal Moroccan Navy.<br />
Alstom Leroux Naval got an order to build a hydrographic<br />
vessel for Ifremer and a 56 m yacht for<br />
American account.<br />
Chantiers Piriou have had orders for:<br />
◆ 2 fast intervention support vessels for Surf,<br />
◆ 1 versatile AHTS,<br />
◆ 1 port tug for Les Abeilles.<br />
Germany<br />
Only two years ago German yards had signed up<br />
for 46 containerships over 1,000 teu, totalling nearly<br />
100,000 teu. In 2002 this figure was divided by<br />
three. The time when Aker-MTW and Kvaerner-<br />
Warnow were taking in orders for ships of 5,000<br />
teu following the example of S.E. Asian yards seems<br />
now very distant.<br />
FS Vanessa<br />
19,117 dwt, blt 2002<br />
by Viana do Castelo<br />
(ENVC), owned by<br />
Fouquet Sacop S.A.<br />
The Shipbuilding Market in 2002<br />
11
Visby<br />
Ropax built by Guangzhou<br />
Shipbuilding International<br />
1,500 pax, 1,600 lane metres<br />
and 29 kn, under successful<br />
sea trials in December 2002,<br />
owned by Rederi AB Gotland.<br />
12<br />
Shipping and Shipbuilding Markets <strong>2003</strong><br />
Shipyards such as Flender Werft, SSW, Thyssen, Lindenau<br />
have registered hardly any significant orders.<br />
Meyer Werft had the two options of RCCL put back<br />
by 9 months, but nonetheless was able to get the<br />
order for a ferry for BAI and a passenger ship for<br />
the Indonesian government. Babcock Borsig sold its<br />
participation in HDW to Bank One Corporation.<br />
This shipyard is still deliberating about keeping its<br />
activity in merchant shipbuilding, given its predominance<br />
in the construction of diesel propelled submarines.<br />
In other matters, Thyssen-Blöhm + Voss<br />
could acquire a 50% participation in HDW in 2004.<br />
The absence of new orders for ro-ros also had its<br />
effect. Deliveries of ferries by German yards are<br />
steadily declining. Six ships of over 15,000 gt were<br />
delivered in 2001, four in 2002, and two units<br />
should be delivered before 2004.<br />
Smaller yards like J.J. Sietas or Peene Werft, specialised<br />
in building multipurpose cargo or heavylift<br />
ships are being hurt by Asian competition.<br />
Italy<br />
Fincantieri was able to sign up 2 of the 3 orders for<br />
cruise ships placed in 2002 and carries an orderbook<br />
for 11 cruise ships whose deliveries extend<br />
through to 2006.<br />
Italian owners have now turned away from their<br />
domestic shipyards and the trend towards orders in<br />
Asian yards has been amplified. More than 30 product<br />
and chemical carriers were placed by Italian<br />
interests with Korean, Chinese, or Croatian shipyards<br />
during the course of the past two years.<br />
Several shipyards are going through difficult times.<br />
Fratelli Orlando has gone bankrupt and is looking<br />
for a takeover bid. Mario Morini was sold to a group<br />
building yachts and could get out of building of<br />
merchant ships. Mariotti and Apuania have not<br />
taken in any new orders. Visentini continues to build<br />
ro-pax for the account of its own fleet operations.<br />
The future is full of uncertainty for Italian shipyards<br />
too.<br />
Spain<br />
The majority of orders placed in 2002 with Spanish<br />
shipyards were for domestic account. It was principally<br />
for ro-ros. At the end of the year, IZAR was in<br />
negotiations with a Venezuelan owner for an order<br />
for three asphalt carriers of 27,000 dwt. IZAR has<br />
succeeded entering the dredging market by importing<br />
technology from Holland and Germany.<br />
IZAR should deliver in <strong>2003</strong> the first of 5 LNG carriers<br />
ordered in 2000/2001 and hopes to carry on in<br />
this niche of the market despite very active Asian<br />
competition.<br />
Finland<br />
The two Finnish shipyards Aker Finnyards and<br />
Kvaerner Masa saw their mother companies merge<br />
in February 2002. Specialised in building ro-ros and<br />
cruise ships, these yards, after no orders in 2001,<br />
signed several contracts at the end of 2002.<br />
Masa Yard won the order for a giant luxurious ferry<br />
of 75,000 gt for the Norwegian group Color Line.<br />
Aker Finnyards got the order for a cruise ship of
%<br />
100<br />
90<br />
80<br />
70<br />
60<br />
50<br />
40<br />
30<br />
20<br />
10<br />
0<br />
Shipbuilding countries market shares evolution for bulk carriers<br />
Sep 98 Dec 98 Mar 99 Jun 99 Sep 99 Dec 99 Mar 00 Jun 00 Sep 00 Dec 00 Mar 01 Jun 01 Sep 01 Dec 01 Mar 02 Jun 02 Sep 02 Dec 02<br />
33,000 gt for Birka Line and a ferry sister to the<br />
‘Romantika’ for Estonian account, 40,000 gt, both<br />
for delivery in 2004.<br />
Denmark<br />
The last large Danish shipyard Odense Lindo continues<br />
its construction of giant containerships, of<br />
which the latest design should approach the<br />
10,000 teu mark. These containerships are then<br />
managed by the shipping arm of the A.P. Moller<br />
group, also owner of the yard. This shipyard has<br />
not had any order for merchant ships this year and<br />
plans for reducing employees are being examined.<br />
Nonetheless there has been a diversification in the<br />
military shipbuilding following an order by the<br />
Danish Navy for two large multipurpose supply<br />
ships. The Orskov shipyard has announced that it<br />
will stop newbuildings in order to concentrate on<br />
ship repairs in <strong>2003</strong>.<br />
Holland<br />
Holland is noted for producing small size ships<br />
(generally less than 10,000 dwt). The level of<br />
orders has however been less in 2002 and comprises<br />
multipurpose cargo ships, product and chemical<br />
tankers and dredgers. They are suffering<br />
from a fierce competition from Chinese shipyards<br />
who have plunged into this sector, abandoned by<br />
Korean yards chasing larger size ships, or the Japanese<br />
who are very reluctant to build specialised<br />
ships for the account of non–domestic owners. It is<br />
worth noting that the Bjilsma shipyard got an order<br />
for a 1,300 cbm LNG carrier to handle the distribution<br />
of natural gas on the Norwegian coastline.<br />
Norway<br />
Japan<br />
Korea<br />
China<br />
Others<br />
The significant event in 2002 was the merger of the<br />
two old rivals Aker and Kvaerner giving rise to a<br />
group active in Norway, Finland, Germany, Romania,<br />
Brazil, and the U.S.. The new entity spreads over 12<br />
sites in Europe and employs 13,500 people with a<br />
Rugby League<br />
7,500 cbm LPG carrier,<br />
blt 2002 by Watanabe,<br />
owned by Daishin/Nisshin<br />
and time chartered by Vitol.<br />
The Shipbuilding Market in 2002<br />
13
14<br />
Pourquoi Pas<br />
2,000 dwt<br />
oceanographic vessel,<br />
to be delivered in 2005 by<br />
Chantiers de l’Atlantique,<br />
operated by IFREMER.<br />
Shipping and Shipbuilding Markets <strong>2003</strong><br />
Shipbuilding countries market shares evolution for stainless steel chemical carriers (1997 vs 2002)<br />
7 %<br />
7 %<br />
67 %<br />
19 %<br />
turnover of some 20 billion Norwegian kroners.<br />
A long-standing specialist in the building of ships<br />
dedicated to the offshore oil industry, Norway has<br />
continued to register a satisfactory level of orders,<br />
even though in decline. Seventeen PSV or AHTS<br />
have been ordered in 2002. As a general rule, hulls<br />
for these units are built in Romania before being<br />
towed for outfitting in Norway. It is to be regretted<br />
that the Fosen shipyard, which built the cruise ship<br />
‘The World’ for Residensea, has gone bankrupt.<br />
Poland<br />
Japan<br />
Western Europe<br />
As with their German counterparts, Polish shipyards<br />
suffered from a drastic reduction in containership<br />
orders. The Szczecinska shipyard, despite<br />
having a fairly substantial orderbook, had to declare<br />
bankruptcy since it could no longer meet its<br />
financial obligations. A re-capitalisation took place<br />
and activity continues under the name of Szczecinska<br />
Nowa. Some of the orders placed with the<br />
old shipyard have been cancelled, other renegotiated,<br />
as with the initial order for 8 stainless steel<br />
chemical carriers for account of Odfjell-Seachem,<br />
of which 6 at least have been reconfirmed. The<br />
19 %<br />
Eastern Europe<br />
Others<br />
14 %<br />
2 %<br />
65 %<br />
other big Polish shipyard, Stocznia Gdynia, won an<br />
important order for car-carriers.<br />
Croatia<br />
The Croatian shipyards, which had managed to<br />
conclude an important volume of orders in 2001,<br />
could not offer any early delivery dates, because many<br />
existing options were exercised, and therefore did not<br />
sign this year as many contracts. Some product tankers<br />
orders were however placed for delivery in 2005.<br />
Croatia is also active in the car carriers sector.<br />
Turkey<br />
There has been some revamping within Turkish<br />
shipbuilding, which has become specialised in small<br />
product and chemical carriers (from 3,000 to<br />
15,000 dwt). These shipyards have been able to sell<br />
an important number of units to European operators<br />
by way of direct orders, but also by way of<br />
resales of ships ordered by Turkish interests. Some<br />
10 shipyards are currently active in this market.<br />
United States<br />
The American shipbuilding industry has maintained<br />
its position as number 8 in the world, with<br />
more than a million gt at the end of 2002. Who<br />
could have made such a prediction only several<br />
years ago ?<br />
However as no contract for large size ships was<br />
concluded in 2002, and the American orderbook<br />
also reflects the time it takes to build two series of<br />
tankers of 140,000 and 185,000 dwt, which were<br />
ordered back in the period 1998-2001. The rest of<br />
American production is concentrated on small offshore<br />
units, which are built at a multitude of sites in<br />
great numbers.
Prospects<br />
The 90’s were characterised by a continuous growth<br />
in the worldwide orderbook encouraged by a<br />
continuous drop in newbuilding prices.<br />
After the expansion of Korean production capacity<br />
in the middle of the 90’s then that of China’s currently,<br />
global shipbuilding capacity could expand at<br />
a rate in excess of ship demand in the years to come.<br />
OECD estimates that today’s surplus capacity is<br />
15 % over demand and that it could reach 30 % by<br />
2005, and they would like to see discussions which<br />
were abandoned in 1996 reactivated in an attempt<br />
to make the market healthier.<br />
There is little chance that China will limit its ambitions<br />
and renounce at this stage what it considers<br />
its legitimate market share. Possibly in order to<br />
maintain “reasonable” price levels, Korea and<br />
Japan will try not to transform their gain in productivity<br />
into supplementary production. But nothing<br />
can be taken for granted as the 90’s showed.<br />
It is therefore quite probable, given the chronic<br />
imbalance between supply and demand, that<br />
construction prices will continue to decline in the<br />
years to come, awaiting for the least efficient shipbuilders<br />
to give up and disappear. The world orderbook<br />
is being kept at record levels in 2002, but the<br />
gap between Europe and Asia has widened.<br />
Despite a persistent drop in prices over time,<br />
rebounds are possible as we have seen in the years<br />
1999-2000 or in 2002. There is a ray of hope therefore<br />
for shipbuilders.<br />
This hope can be based on several objective criteria:<br />
1. Safer ships are necessary.<br />
The ‘Prestige’ catastrophe is still in all our minds<br />
and should provoke a renewed examination in our<br />
consciences on the risks of pollution linked to maritime<br />
transportation. It is true that the catastrophe<br />
of the ‘Erika’ led to a renewal of the fleet and a<br />
certain rise in prices, partly linked to a favourable<br />
economic climate.<br />
Regulation should be reinforced, thus contributing<br />
to new investments, initially for oil tankers but also<br />
for dry bulk carriers since for this type of vessel<br />
double-hulls should be required.<br />
A number of charterers are already imposing more<br />
drastic constraints that those being legislated. The<br />
combination of these measures should accelerate<br />
the need for renewals.<br />
2. New ship sizes and new technologies should be<br />
developed.<br />
Delivered to Brodosplit Shipping in 2002, the first of three product<br />
tankers, successfully built by Split Shipyard in Croatia, with<br />
equipment taken over and shipped from original ‘Double Eagle’<br />
project's builder Newport News Shipbuilding in USA.<br />
The last ten years have seen the development of<br />
new sizes in bulk carriers and containerships.<br />
For instance the deadweight of Handysize bulk carriers<br />
has gradually gone from 35,000 to 55,000<br />
dwt, the deadweight of Panamax from 52,000 to<br />
75,000 dwt, and the deadweight of Capesize from<br />
150,000 to 200,000 dwt. The capacity of containerships<br />
have also increased from 4,000 teu to over<br />
8,000 teu.<br />
This trend is probably not finished.<br />
Needs in natural gas should favour orders of LNG<br />
carriers of very large sizes over and above the<br />
147,000 cbm currently. Projects for LNG carriers of<br />
over 200,000 cbm are being studied. The adoption<br />
of dual diesel gas-electric propulsion on this type of<br />
ship should contribute to the replacement of the<br />
preceding generation equipped with steam turbines.<br />
Development of oil exports or of refined products<br />
from cold regions such as the Baltic, the Russian<br />
Arctic and Alaska could also provide future demand<br />
for ice-class tankers.<br />
3. Maritime transportation, remains the least polluting<br />
Despite the catastrophes which are largely covered<br />
by medias and discredit the image of maritime<br />
transportation, this means of transport is the most<br />
economic in terms of energy consumption per ton<br />
transported and therefore the most ecological.<br />
It is also the solution to alternative transport being<br />
both the most economic and the easiest to put into<br />
place, in order to resolve the ever-increasing problem<br />
of congestion of the road network in Europe<br />
but also in other heavily industrialised zones. ■<br />
Bene<br />
46,467 dwt, product tanker,<br />
built in 2002 by<br />
Split Shipyard in Croatia.<br />
The Shipbuilding Market in 2002<br />
15
16<br />
Shipping and Shipbuilding Markets <strong>2003</strong><br />
The <strong>BRS</strong> Web site<br />
www.brs-paris.com<br />
<strong>BRS</strong> offers a web site with regular updated information<br />
on international maritime transportation.<br />
In addition to the numerous pages with free access,<br />
<strong>BRS</strong> has available for clients<br />
PAGES WITH FREE ACCESS:<br />
data and on line services<br />
• Group profile<br />
adapted to their specific<br />
• Contacts for each department<br />
needs.<br />
• Annual review<br />
• Newsletters:<br />
– Weekly: dry cargo, crude oil and petroleum products<br />
– Monthly: liner shipping, LPG, sale and purchase<br />
PAGES WITH PRIVATE ACCESS:<br />
• A daily press report<br />
• Statistics (freights, prices, orderbooks…)<br />
• Weekly analyses<br />
• Specific studies
THE<br />
CRUISE MARKET<br />
IN<br />
2002<br />
After the drama of September 11, one could<br />
justifiably fear a difficult year for the cruise<br />
market, but very quickly bookings were back,<br />
and the cruise industry showed it was capable of<br />
confronting the worst kind of crisis. Within several<br />
months, bookings were close to their normal levels<br />
and owners were able to foresee a satisfactory year<br />
again, despite an inevitable drop in the net revenue<br />
per passenger.<br />
Cruise ships which avoided distant destinations<br />
were able to re-orientate themselves to shorter<br />
trips closer to their home base, and requiring less<br />
air travel. At the end of the year, the Cruise Lines<br />
International Association (CLIA) published some<br />
reassuring figures: the number of American cruise<br />
passengers should increase from 6,900,000 to<br />
7,400,000 in 2002, a rise of 7 % with a load factor<br />
of 95 %. In Europe and Asia the load factor for the<br />
year should achieve 80 % and 75 % respectively,<br />
with the cruise industry finding it more difficult to<br />
develop the latter market.<br />
The predominant issue in 2002 has of course been<br />
the fight between Royal Caribbean Cruises (RCC)<br />
and Carnival Cruise Lines (CCL) to take control of<br />
P&O Princess. Having started the year before, this<br />
duel should reach a conclusion towards the end of<br />
the first quarter of <strong>2003</strong> with the marriage of CCL<br />
and P&O after having been approved by the European<br />
and American anti-trust authorities.<br />
By wishing to get closer to P&O, RCC might have<br />
provoked CCL into reacting, nonetheless the wisdom<br />
and rationality of such a marriage remains to<br />
be proven, as in comparison to other parts of the<br />
industry we have frequently had reason to question<br />
whether such mergers are necessarily beneficial to<br />
shareholders values, and a stimulus to the development<br />
of the market.<br />
The P&O Princess-CCL group, which will be quoted<br />
on the New York and London stock exchanges, will<br />
of course be the dominant (possibly overbearing)<br />
player in the cruise industry with nearly 50% of the<br />
The Cruise Market in 2002<br />
17
18<br />
Brilliance of the Seas<br />
90,090 gt, blt 2002<br />
by Meyer Werft,<br />
operated by RCC.<br />
Lower berths<br />
30,000<br />
25,000<br />
20,000<br />
15,000<br />
10,000<br />
5,000<br />
Shipping and Shipbuilding Markets <strong>2003</strong><br />
0<br />
13 ships<br />
delivered in 2002<br />
Cruise ships delivered in 2002 and firm orderbook to 2006<br />
13 ships<br />
American market capacity and 43% capacity of the<br />
world market, thirteen different brands, 65 ships<br />
(100,000 lower berths) and a further 18 under<br />
construction (42,000 lower berths).<br />
We have to acknowledge that CCL has up till now<br />
always respected the identity and the personnel of<br />
the merged parties and to date has managed to<br />
succeed in a unique segmentation of the market.<br />
This segmentation of the market has also been a<br />
10 ships<br />
3 ships<br />
Others<br />
Meyer Werft<br />
Masa Yards<br />
Fincantieri<br />
Ch. de l'Atlantique<br />
1 ship<br />
<strong>2003</strong> 2004 2005 2006<br />
target in the strategy of other companies during the<br />
course of the year:<br />
◆ The creation of « Ocean Village » and of « A’Rosa<br />
» by the P&O group, the first being destined for<br />
a new younger clientele within the English market,<br />
and the second for a more mature and experienced<br />
clientele within the German market.<br />
◆ Similarly, Costa has dedicated the ‘Costa Marina’<br />
to the Germans and RCC has created « Island<br />
Cruises» to operate on the English market at attractive<br />
prices.<br />
These new brand names sometimes have difficulty<br />
in getting established, with potential clients showing<br />
a certain distrust towards a new name and<br />
product, but for owners it allows them to use older<br />
cruise ships, which are facing the competition of<br />
new ships from their parent companies.<br />
After the black year of 2001, no company has gone<br />
into bankruptcy this past year. Notwithstanding,<br />
vessels which have been laid up due to these earlier<br />
bankruptcies have certainly had a negative effect on<br />
both the second-hand and newbuilding markets<br />
which have been extremely calm.<br />
◆ The eight Renaissance ships (700 lower berths)<br />
have had a problem finding interested parties due to<br />
their size and cost, which necessitate finding homes
in the more remunerative sectors of the market. The<br />
P&O Princess group concluded a long time charter<br />
for the ‘R Eight’ to replace the ‘Minerva’ and thus<br />
serve the restricted but profitable cultural cruises.<br />
The same group also took over the ‘R Three’ and ‘R<br />
Four’ to expand its presence in the Pacific, between<br />
Tahiti, New Caledonia, and Australia.<br />
◆ A newly created American cruise company, Oceania,<br />
is proposing to charter two Renaissance ships<br />
to work the American market and the last three<br />
should find their trade within Europe to fulfil the<br />
upper end of some national markets.<br />
◆ The hulls under construction for the American<br />
company AMCV with Ingalls and their outfitting<br />
have found takers with NCL (the Star Cruises<br />
group) who bought at the very favourable price of<br />
$36 million and will have them completed – or at<br />
least the hull of the first-ship with Lloyd Werft in<br />
Germany, the undisputed specialist of passenger<br />
ship conversion.<br />
For the second consecutive year, the orderbook has<br />
hardly expanded, with the exception of two ships<br />
ordered by the Carnival group with Fincantieri, one<br />
unit of 85,000 tons, 1,848 lower berths, for Holland<br />
America Lines, with delivery in mid-2006, and<br />
one unit of 110,000 tons, 3,000 lower berths, for<br />
Carnival, for delivery at the end of 2005, at the respective<br />
prices of some 380 and 460 million euros.<br />
Fincantieri thus confirms its lead position amongst<br />
European shipbuilders.<br />
Also worth noting is the order by the Scandinavian<br />
company Birka for a vessel of 700 cabins with Aker<br />
Finnyards, at a price of $155 million, destined primarily<br />
for cruise seminars.<br />
At the end of the year, the firm orderbook stands at<br />
27 ships with a capacity of 57,164 lower berths,<br />
with delivery to be spread out over the next three<br />
years, which will increase berth capacity in service<br />
respectively by 10.8% in <strong>2003</strong>, 9.5% in 2004, and<br />
2.5 % in 2005.<br />
Confronted with a demand which most probably will<br />
increase at the rate of some 8% per year, the threat<br />
of surplus capacity seems to be receding, which will<br />
reassure bankers and financial analysts who have<br />
been concerned at the rapid rise in the number of<br />
ships joining the market these last years. However<br />
this brutal reduction in new orders puts the future of<br />
the large European shipyards specialised in the cruise<br />
industry into jeopardy. Converting towards other<br />
types of ships, such as ferries, ro-ros, LNG carriers<br />
and military or specialised craft, although a logical<br />
solution, is not always obvious in such a generally<br />
sluggish market. The first victim of this reduced activity<br />
has been the small Norwegian shipyard Fosen,<br />
builder of the ship ‘The World’ for Residensea, which<br />
had to ask for creditors’ protection.<br />
Several projects are currently under discussions,<br />
namely for Star Cruises, Saga, Aida Cruises, Radisson,<br />
Disney Cruises, etc. but are slow to get confirmed.<br />
RCC has not placed any new order in 2002<br />
and is questioning the size of future ships, in view<br />
of the success of the ‘Voyager’ series, 137,000 tons.<br />
It is also a fact that decisions were on hold awaiting<br />
the outcome of the merger with P&O Princess. RCC<br />
has extended its option until September <strong>2003</strong> that<br />
it has with Meyer Werft for two ships of the ‘Serenade’<br />
class (85,000gt, 2,000 lower berths), for delivery<br />
in 2005 and 2006, whereas P&O were unable<br />
to postpone any further its two options with Chantiers<br />
de l’Atlantique.<br />
The market will from now be obliged to follow the<br />
development pace of the new giant CCL/P&O Princess.<br />
It is very unlikely that the year 1999, which<br />
had 25 new orders will be repeated, but one can<br />
reasonably hope that some new orders will be placed<br />
in <strong>2003</strong> by the big groups who will pursue a<br />
more modest rhythm for their expansion in 2005<br />
and beyond. Carnival should logically show the way<br />
and be followed by its competitors, but the number<br />
of new orders risks being insufficient for the appetites<br />
of the European shipyards.<br />
Europe has a total construction capacity of about<br />
fifteen ships of 90,000 gross tons per year, certainly<br />
greatly oversized relative to the needs for a<br />
European Stars<br />
58,600 gt, blt 2002 by<br />
Chantiers de l'Atlantique,<br />
operated by Festival Cruises.<br />
The Cruise Market in 2002<br />
19
20<br />
Carnival Legend<br />
88,500 gt, blt 2002<br />
by Kvaerner Masa,<br />
operated by Carnival.<br />
Shipping and Shipbuilding Markets <strong>2003</strong><br />
reasonable growth of the cruise industry in the<br />
coming years. A reduction in capacity will consequently<br />
have to take place, resulting in a shrinking<br />
of orders and in the number of owners, and of a<br />
greater sensitivity from financial institutions and<br />
investors towards this sector - always hungry for<br />
funds. The depreciation of the dollar against the<br />
euro will also act as a brake, despite the historically<br />
low levels of interest rates.<br />
In this situation competition between shipyards is<br />
fierce, and since national subsidies have been banned<br />
by Brussels, and the negotiating margins on<br />
prices remain very slim, it is more on financing<br />
know-how and means of tax leverage developed<br />
by some E.U. countries, that efforts will be<br />
concentrated.<br />
The only satisfaction is that the construction of cruise<br />
ships should remain an European speciality for<br />
numerous years to come, since Asian shipyards<br />
have no interest to break into this high risk and very<br />
restrictive market, whilst they are experiencing healthy<br />
orders of standard ships. The dramatic and costly<br />
fire of the ‘Diamond Princess’ under construction<br />
with Mitsubishi should also be a dampener.<br />
Thirteen ships were delivered this year:<br />
◆ For Carnival Cruise Lines, the ‘Carnival<br />
Conquest’, (110,000 gt, 2,974 lower berths) built<br />
by Fincantieri, the ‘Carnival Legend’, (88,500 gt,<br />
2,114 lower berths) built by Kvaerner Masa.<br />
◆ For Holland America Line, the ‘Zuiderdam’<br />
(85,000 gt, 1,848 lower berths) built by Fincantieri.<br />
◆ For Royal Caribbean Cruises, the ‘Brilliance of<br />
the Seas’, (90,090 gt, 2,100 lower berths) built by<br />
Meyer Werft, the ‘Navigator of the Seas’,<br />
(137,300 gt, 3,138 lower berths) built by Kvaerner<br />
Masa.<br />
◆ For Celebrity Cruises, the ‘Constellation’,<br />
(91,000 gt, 1,950 lower berths) built by Chantiers<br />
de l’Atlantique.<br />
◆ For P&O Princess Cruises, the ‘Star Princess’<br />
(108,806 gt, 2,600 lower berths) built by Fincantieri,<br />
the ‘Coral Princess’, (88,000 gt, 1,950 lower<br />
berths) built by Chantiers de l’Atlantique.<br />
◆ For Aida Cruises, ‘Aida Vita’, (42,289 gt, 1,266<br />
lower berths) built by Aker MTW.<br />
◆ For Norwegian Cruise Line, the ‘Norwegian<br />
Dawn’, (91,000 gt, 2,244 lower berths) built by<br />
Meyer Werft.
◆ For Festival Cruises, the ‘European Stars’,<br />
(58,600 gt, 1,506 lower berths) built by Chantiers<br />
de l’Atlantique.<br />
◆ For Residensea, ‘The World’ (40,000 gt, 616<br />
lower berths, 110 apartments, 88 suites) built by<br />
Fosen.<br />
◆ For Royal Olympic, ‘Olympia Explorer’,<br />
(25,000 gt, 836 lower berths) built by Blohm &<br />
Voss.<br />
The second-hand market was extremely quiet.<br />
Several significant sales noted were:<br />
◆ ‘Patriot’ (built in 1983, 33,000 gt, 1,250 passengers)<br />
this ship which was the former ‘Niew<br />
Amsterdam’ was bought by Carnival following the<br />
AMCV bankruptcy in May and resold to Louis<br />
Cruises in Cyprus against a ten year time-charter,<br />
which puts a value on the ship of about $65 million.<br />
◆ ‘Victoria’ (built in 1966, 29,000 gt, 778 passengers)<br />
this ship which belonged to P&O, was sold for<br />
$17 million, with a seven year time-charter to a<br />
German tour operator.<br />
◆ ‘Pacific Princess’ (built 1971, 20,000 gt, 640<br />
passengers) was sold for $15 million to Pullman<br />
Tours, who confirm their place as leader in the Spanish<br />
market.<br />
◆ ‘Switzerland’ (ex ‘Daphné’, built 1955,<br />
15,000 gt, 500 passengers) was sold for $2.5 million<br />
to Majestic International Cruises.<br />
The second-hand market is getting smaller but it is<br />
worth mentioning that ships of good standing always<br />
find buyers at a fair value and if it is true that many<br />
ships are potentially for sale, their lack of success is<br />
often attributable to an excessive asking price. The<br />
oldest ships and steam turbines fitted ones should<br />
definitely disappear from the market.<br />
With over a billion dollars net profit for a turnover<br />
of $4.4 billion, Micky Arison chairman of Carnival<br />
could legitimately express his satisfaction on the<br />
development of his company over the course of the<br />
year, but also on the resilience of the cruise market<br />
in the face of the serious geopolitical events which<br />
the world is currently experiencing.<br />
Strangely and unexpectedly, it is not so much terrorism<br />
which troubles cruise operators at the end of<br />
the year as much as the spreading of viruses aboard<br />
their ships, causing some discomfort but without<br />
serious repercussions to passengers. This was given<br />
widespread publicity by the American media always<br />
in search of something sensational. Let us trust that<br />
owners will quickly be able to wipe out this invisible<br />
problem.<br />
Our confidence in the growth of the cruise industry<br />
remains firm, even and above all if, as we have<br />
already stated, the pace of newbuildings slows<br />
down significantly. The trend towards company<br />
mergers is on the other hand certainly not finished,<br />
since outside certain marginal niche products, a critical<br />
mass is necessary in order to operate a company<br />
with a certain serenity, to be able to cope with<br />
political uncertainties and the whims of the tourism<br />
industry as well as the commercial domination of<br />
the Carnival group. ■<br />
Coral Princess<br />
88,000 gt, blt 2002<br />
by Chantiers de l'Atlantique,<br />
operated by P&O Princess.<br />
The Cruise Market in 2002<br />
21
22<br />
Shipping and Shipbuilding Markets <strong>2003</strong><br />
<strong>BRS</strong> Research and<br />
Information Department<br />
The Research and Information Department maintains<br />
a large data basis and information library which covers all<br />
sectors of activities handled by <strong>BRS</strong>, and is available for<br />
consultation or advice of clients.<br />
This Department handles the information reports, analyses,<br />
studies and statistics covered on the company’s internet site.<br />
It works in co-operation with the brokers in each departments<br />
to meet the needs of clients.<br />
The Research and Information Department also offers its<br />
know-how and the companies’ international network and<br />
expertise available to the shipping world to assist and answer<br />
any queries.<br />
You can reach this service directly<br />
at the following address:<br />
research@brs-paris.com<br />
Or through your broker.
THE<br />
TANKER<br />
MARKET<br />
IN<br />
2002<br />
We tried to conclude our last year’s report<br />
on an optimistic note by arguing that<br />
only a significant economic recovery in<br />
the industrialised countries could reverse the<br />
strong downward trend in freight rates. The repercussions<br />
of what we can qualify as after ‘Erika’<br />
were of a very short duration. The drastic policies<br />
put into effect by the main charterers and importing<br />
countries, rejecting the older vessels, brought<br />
in their wake two fierce reactions, which combined<br />
to weigh heavily on freight rates.<br />
Numerous (too many?) new orders were placed<br />
over the past 3 years. As we shall see later all sizes<br />
were affected, and despite a progressive elimination<br />
of the older units, real requirements and replacement<br />
projections have often been surpassed.<br />
Faced with a constant fall in crude oil prices, OPEC<br />
members reacted by reducing their production<br />
quotas often by substantial proportions. Apart<br />
from a few rare exceptions, it has become obvious<br />
Crude oil transport<br />
that the world economic climate remains stuck in<br />
a prolonged state of apathy. Hopes of a recovery<br />
in the second half of the year, which we alluded<br />
to, were not achieved and the prospects are far<br />
from rosy.<br />
GDP as expressed in %<br />
2001 2002 <strong>2003</strong><br />
United States 0.3 % 2.2 % 2.6 %<br />
Japan -0.3 % -0.5 % 1.1 %<br />
Europe 1.6 % 1.1 % 2.3 %<br />
Source IMF : September 2002<br />
The past year has also been marked by a particularly<br />
tense climate in the realms of international<br />
affairs. The psychosis of terrorist attacks following<br />
the horrors of September 11 2001 has not abated,<br />
and 2002 has seen its share of bloody events. Closer<br />
to us, the attempt which was made on the<br />
‘Limburg’ demonstrates that our activity is an easy<br />
and symbolic target for the terrorists.<br />
The Tanker Market in 2002<br />
23
24<br />
US$/day<br />
100,000<br />
90,000<br />
80,000<br />
70,000<br />
60,000<br />
50,000<br />
40,000<br />
30,000<br />
20,000<br />
10,000<br />
Shipping and Shipbuilding Markets <strong>2003</strong><br />
0<br />
Jan 00<br />
Feb 00<br />
Mar 00<br />
May 00<br />
Caught up in this turmoil, which is both geographical<br />
and economic, the U.S. has thrown down<br />
the gauntlet against these invisible adversaries by<br />
rearranging a part of the reality and in targeting<br />
once again Saddam Hussein and Iraq.<br />
The threat of such a new conflict has had strong<br />
repercussion in the oil industry and oil prices have<br />
swung erratically going from under $20 per barrel<br />
in January to near $30 per barrel in September.<br />
The development of freight rates<br />
over the year<br />
Generally, as shown in the tables, the drop experienced<br />
in 2001 was accentuated to the mediocre<br />
levels of 1999. As will be seen from the analysis<br />
of the different graphs for each of the main sectors,<br />
whilst rates collapsed in the first 3 months<br />
of the year, there was a strong rise in the last<br />
quarter.<br />
Several factors explain this abrupt and unexpected<br />
phenomenon:<br />
◆ The threats directed at Iraq have resulted in a<br />
substantial increase in strategic reserves.<br />
◆ This is the traditional period of the year when<br />
consuming countries build up their stocks in preparation<br />
for a cold winter.<br />
◆ At the same time, producing countries have<br />
significantly opened their taps and have exceeded<br />
their self-imposed quotas. Consequently in the<br />
period October – November, OPEC production<br />
(1) Including conversions<br />
June 00<br />
July 00<br />
Sep 00<br />
Oct 00<br />
Dec 00<br />
Jan 01<br />
VLCC tanker freight rates<br />
Average earnings<br />
Feb 01<br />
Apr 01<br />
May 01<br />
June 01<br />
Aug 01<br />
Sep 01<br />
250,000 t MEG/Japan - TCE<br />
275,000 t MEG/Continent - TCE<br />
260,000 t Forcados/Loop - TCE<br />
Nov 01<br />
Dec 01<br />
Jan 02<br />
Mar 02<br />
touched 26.6 million bpd, a surplus of 2.5 million<br />
bpd over the official ceiling.<br />
The question that we will examine after an analysis<br />
by sector is to know whether this breathe of<br />
fresh air, which owners have enjoyed at the end<br />
of the year, has a chance of being extended and<br />
confirmed, or whether it is simply a short-lived<br />
illusion.<br />
The catastrophe of the ‘Prestige’ nearly three years<br />
after that of the ‘Erika’ and its consequences, will<br />
help to highlight some of the parameters and<br />
conclusions, which we shall try to draw from all this.<br />
VLCC<br />
Particularly sensitive to the uncertain climate we<br />
are currently experiencing, this category of tankers,<br />
with the exception of the fourth quarter, had a very<br />
difficult year. The export restrictions imposed by<br />
the Gulf producing countries, together with a high<br />
level of new deliveries, resulted in an imbalance of<br />
supply and demand particularly detrimental to<br />
owners. Voyage returns continued to plummet to<br />
reach in certain cases levels lower even than those<br />
in 1999… ($5,000 to $6,000 per day).<br />
Given these circumstances and without any expectation<br />
of an economic recovery in the short term,<br />
many owners of older vessels decided not to hold<br />
on, and sent their units to the scrapyards. A total<br />
of 41 VLCC / ULCC (1) were taken out of the fleet<br />
in 2002 compared to 40 in 2001 and 29 in 2000.<br />
Apr 02<br />
June 02<br />
July 02<br />
Aug 02<br />
Oct 02<br />
Nov 02<br />
Dec 02
US$/day<br />
80,000<br />
70,000<br />
60,000<br />
50,000<br />
40,000<br />
30,000<br />
20,000<br />
10,000<br />
0<br />
Jan 00<br />
Feb 00<br />
Mar 00<br />
May 00<br />
June 00<br />
July 00<br />
At the same time, 40 new vessels were delivered<br />
in 2002, thereby balancing the fleet withdrawals.<br />
Nonetheless we have been able to observe that<br />
the increase in voyage demand at the end of the<br />
year has had an immediate effect on rates, and<br />
shows the very fine balance between supply and<br />
demand with Worldscale rates doubling within a<br />
few weeks!<br />
Thus during the last quarter, Worldscale levels reached<br />
their peak (WS 120 / 130) for short voyages to<br />
the East and WS 107,5 / 110 for longer voyages to<br />
the U.S. Lucky owners have been able to benefit<br />
from returns unthinkable throughout the first three<br />
quarters, which often exceed $60,000 per day.<br />
Another reason for the additional volatility of this<br />
market is that, apart from the traditional traffic out<br />
of the Middle East Gulf, an increase from other<br />
sources notably West Africa has developed. Thus<br />
in this zone, which up till now saw the Suezmax<br />
playing a dominant role, there has been an increase<br />
in combining stems for VLCC’s.<br />
There is also an expanding share of traffic towards<br />
the Far East, which confirms a trend towards shorter<br />
hauls that affects the global tonnage demand.<br />
As to owners’ situation, already alluded to in our<br />
last report, the policy of forming “commercial<br />
pools” chosen by some in the lean periods, has<br />
come under pressure following the poor levels<br />
being obtained in the period up until September.<br />
Consequently we have seen the departure of<br />
Sep 00<br />
Oct 00<br />
Dec 00<br />
Jan 01<br />
Suezmax tanker freight rates<br />
Average earnings<br />
Feb 01<br />
Apr 01<br />
May 01<br />
June 01<br />
Aug 01<br />
Sep 01<br />
Nov 01<br />
Dec 01<br />
Jan 02<br />
130,000 t Sidi Kerir/Fos - TCE<br />
130,000 t Forcados/Texas City - TCE<br />
Mar 02<br />
Frontline from the Tankers International pool. As<br />
this is one of the leading VLCC owners in the<br />
world, it has to be admitted that there are difficulties<br />
and limits of such a policy in a declining<br />
market.<br />
Suezmax<br />
The results of the past year are similar in all respects<br />
for this category of tankers to those of<br />
VLCC’s.<br />
After 2001, which despite its ups and downs was<br />
on the whole positive (with average returns close<br />
to $30,000 per day), owners were unable to resist<br />
the gradual deterioration of the overall economic<br />
conditions. Whilst the levels and returns did not<br />
fall to the depressed levels of 1999, there was<br />
nonetheless a steady decline from January to September<br />
2002.<br />
As with the VLCCs and for the same reasons, the<br />
last quarter saw a jump in levels as abrupt as it was<br />
excessive, and unjustified by the fundamentals of<br />
the market.<br />
Even more than the previous year, it was the Mediterranean<br />
which was the main spur of this market.<br />
Russian exports now play a major role, together<br />
with the constant flow of liftings from the Sumed<br />
pipeline and in “normal” times, Iraq crude exports<br />
out of Ceyhan.<br />
With respect to Russian Black Sea liftings, the new<br />
Turkish regulations introduced at the end of the<br />
Apr 02<br />
June 02<br />
July 02<br />
Aug 02<br />
Oct 02<br />
Nov 02<br />
Dec 02<br />
The Tanker Market in 2002<br />
25
26<br />
year (with the Dardenelles transit only permitted in<br />
daylight hours) these add at least another two<br />
days to voyage times. With an ever-increasing rise<br />
in traffic, there are real jams, which can double the<br />
theoretical transit time. This simple measure naturally<br />
affects tonnage availability and helps push<br />
rates higher.<br />
As already mentioned, West Africa is in the process<br />
of losing its position as a driving force, even<br />
though it still represents an important share of the<br />
global traffic, especially towards the U.S.. On this<br />
route the average rate experienced this year was<br />
around WS 78,5 compared to an average in 2001<br />
close to WS 110.<br />
During the first nine months of the year, with the<br />
exception of a slight hike in June, returns remained<br />
below $15,000 per day. Proof of the predominant<br />
influence of economic events on rates, this<br />
size of tankers has remained globally balanced in<br />
terms of numbers for many years. Thus since<br />
1998, 106 new units (15,9 million dwt) have been<br />
delivered while 107 (14,7 million dwt) have been<br />
scrapped.<br />
2002 however differed slightly from preceding years<br />
with 25 units delivered as compared to only 15 ships<br />
withdrawn from the fleet. Another important phenomena<br />
in relation to previous years was the<br />
conversion of units destined to the offshore market<br />
being more favourable to VLCC than to Suezmax.<br />
Consequently only 2 old Suezmax were converted in<br />
2002 as compared to half a dozen VLCCs.<br />
US$/day<br />
80,000<br />
70,000<br />
60,000<br />
50,000<br />
40,000<br />
30,000<br />
20,000<br />
10,000<br />
Shipping and Shipbuilding Markets <strong>2003</strong><br />
0<br />
Jan 00<br />
Feb 00<br />
Mar 00<br />
May 00<br />
June 00<br />
July 00<br />
Sep 00<br />
Oct 00<br />
Dec 00<br />
Jan 01<br />
Aframax tanker freight rates<br />
Average earnings<br />
Feb 01<br />
Apr 01<br />
May 01<br />
June 01<br />
Aframax<br />
Freight rates for this size of tankers have not deviated<br />
from the overall tendency with a market in<br />
steady decline since the beginning of 2001, up<br />
until the notorious jump during the last quarter of<br />
2002. Nonetheless in contrast to the larger sizes,<br />
the lowest levels registered this year did not reach<br />
the abyss of 1999 when returns were frequently<br />
below $10,000 per day.<br />
This ability to absorb the impact of the economic<br />
crisis is largely explained by the great flexibility that<br />
this category of ships possess.<br />
Within the European and American zones, traffic<br />
is extremely steady, but it only requires a minor<br />
movement in the supply / demand equation to<br />
produce a sizeable change in rates. Thus the North<br />
Sea and Caribbean markets were true to form<br />
with wild rate variations, notably in the North Sea<br />
with the traditional bunching of liftings at the end<br />
of the month.<br />
However generally speaking, levels remained fairly<br />
mediocre form January to September: WS 103<br />
for inter North Sea voyages, WS 109 for cross Med<br />
and WS 123 for Caribs / U.S..<br />
The last three months of the year, but especially<br />
November and December, allowed owners to rapidly<br />
get out of this depressed state and to obtain steadily<br />
improving levels. In Europe returns on modern<br />
units often surpassed $40,000 per day. The Caribbean<br />
market was comparatively less favourable.<br />
Aug 01<br />
Sep 01<br />
Nov 01<br />
Dec 01<br />
Jan 02<br />
80,000 t UK/Continent - TCE<br />
80,000 t East Med/West Med - TCE<br />
Mar 02<br />
Apr 02<br />
June 02<br />
July 02<br />
Aug 02<br />
Oct 02<br />
Nov 02<br />
Dec 02
The crisis that shook Venezuela in December produced<br />
an abrupt reduction in demand and owners<br />
quickly had to accept lower rates.<br />
As we have seen earlier in our analysis of the Suezmax<br />
size, the Mediterranean market was also<br />
strongly affected and perturbed by the restrictive<br />
Turkish measures in respect of the Black Sea traffic.<br />
The difficulties encountered during the transit<br />
of the Dardenelles and the Bosphorus have and<br />
will increasingly affect the tonnage availability.<br />
Short and long term prospects.<br />
At the time of writing, the impact of the ‘Prestige’<br />
shipwreck is naturally very much in our minds.<br />
Politicians as well as others, both in Europe and in<br />
the rest of the world, affected by the dramatic<br />
consequences of such a pollution are trying to<br />
adopt drastic and rapid measures.<br />
Preventing old single-hulled tankers from carrying<br />
fuel oil or even crude is purely a political decision<br />
aimed to satisfy public opinion. Although it is common<br />
sense, it does nothing to solve the maritime<br />
risk. Whilst it reduces it, nothing stops the possibility<br />
of seeing a 12 years old double-hulled tanker<br />
having a similar accident, having passed through<br />
several hands and being poorly or badly maintained.<br />
For several years the Majors have already put in<br />
place a system of strict vetting and only certain<br />
less scrupulous charterers are satisfied with vessels<br />
that fail this test.<br />
%<br />
100<br />
90<br />
80<br />
70<br />
60<br />
50<br />
40<br />
30<br />
20<br />
10<br />
0<br />
End 1998<br />
Crude oil tankers fleet age<br />
A proper reinforcement of port controls and of<br />
objective criteria adopted by both exporters as<br />
well as importers, will contribute effectively and<br />
efficiently towards the elimination of the few stray<br />
sheep which causes a risk to the whole fleet and<br />
destroys its public image.<br />
In fact it is not fair to give the impression that the<br />
seas are infested with “floating rust-buckets”, and<br />
the incident of the ‘Prestige’ is more the exception<br />
that proves the rule, at least as far as European<br />
waters are concerned.<br />
Considerable efforts have been made by owners<br />
over recent years and the rejuvenation of the<br />
world tanker fleet is today a reality.<br />
As the graphs show, the VLCC and the Suezmax<br />
categories have been considerably renewed over<br />
the past four years, as today two-thirds of these<br />
fleets are less than 10 years old. Compared to the<br />
end of 1998, the ratio was closer to half.<br />
Only the Aframax size, despite increasing by some<br />
20 new units in the last four years, remains relatively<br />
unchanged in its age structure, with a proportion<br />
of nearly 50 % of vessels over 10 years<br />
old. Nonetheless it should also be stated that most<br />
of these older ships are to be found East of Suez.<br />
As to the question of freight rates over the short<br />
and medium term, once the excitement is over<br />
and the traditional period of winter activity passed,<br />
can one expect to see the strong recovery at<br />
the end of the year being maintained?<br />
VLCC Suezmax Aframax VLCC<br />
Suezmax Aframax<br />
End 2002<br />
10 years and under<br />
Over 10 years<br />
The Tanker Market in 2002<br />
27
28<br />
Minerva Astra<br />
105,830 dwt<br />
crude oil tanker, built 2001<br />
by Daewoo, operated<br />
by Minerva Marine Inc.<br />
Shipping and Shipbuilding Markets <strong>2003</strong><br />
Putting aside the repercussions of the American<br />
intervention in Iraq, one is forced to observe that<br />
the global demand is unlikely to progress significantly<br />
over the coming months. The prevailing<br />
economic conditions remain morose in the majority<br />
of industrialised countries and prospects for a<br />
recovery are not for tomorrow.<br />
Opec decided in mid-December to reduce its overproduction<br />
as from January. This should drop to<br />
23 million b/d with a price target between $22–28<br />
per barrel.<br />
At the same time the availability of tonnage will<br />
continue to increase and the delivery of new vessels<br />
in the coming years indicates that there will be<br />
no shortage of transport capacity.<br />
Tankers on orders (number of ships)<br />
for delivery in Aframax Suezmax VLCC<br />
<strong>2003</strong> 80 29 38<br />
2004 39 21 21<br />
2005 20 5 3<br />
Total 139 55 62<br />
If one looks at the number of single-hull units one<br />
is forced to remark especially for the Aframax category,<br />
that the capability of owners and shipyards<br />
today to react is such, that an imbalance in supply<br />
and demand in favour of owners will only be<br />
short-lived.<br />
Thus we believe that the extraordinary increase in<br />
freight rates during the fourth quarter should carry<br />
through into the first months of <strong>2003</strong>. The impact<br />
of the media with the pollution of the ‘Prestige’<br />
will reinforce the tendency towards caution on the<br />
part of majority of charterers. A marked preference<br />
will be given to the most modern vessels.<br />
However, without a rapid recovery in the world<br />
economy and a lasting effect on the energy<br />
consumption, the risk of collapse is still present.<br />
Opec’s decision to reduce its production to levels<br />
similar to those of the first quarter of 2002 is further<br />
proof of the fragile nature of our market…■<br />
The Second-hand oil tanker market<br />
This past year will leave a bitter taste in the<br />
mouths of industry players. Values of this type<br />
of tankers have eroded by some 10 / 15 %<br />
over the year despite an improvement being perceptible<br />
in mid-December. There are numerous reasons<br />
which have provoked this general depression,<br />
both with buyers as well as sellers of the secondhand<br />
tankers in the course of 2002, severely reducing<br />
the volume of business transacted.<br />
The main reasons were:<br />
◆ A world economy in a depressed state.<br />
◆ A reduction in crude production.<br />
◆ Miserable daily returns during the first three<br />
quarters.<br />
◆ A perception and proof of insecurity linked to<br />
terrorism.<br />
◆ Declining newbuilding prices.<br />
◆ A systematic misunderstanding and a frequent<br />
misinformation on the part of the general media<br />
on this type of transport, exacerbating the justified<br />
indignation of victims of pollution.<br />
◆ The inability of competent organisations such as<br />
the IMO and Intertanko, to get their point of view<br />
across to the general public.<br />
Business done in the last quarter might have picked<br />
up given that the financial costs remained<br />
attractive and that owners at last enjoyed an<br />
upsurge in freight rates resulting from the Venezuelan<br />
crisis, an increase in crude production, and<br />
the sound of drums in Iraq.<br />
But very little effect was felt, as at the same time<br />
the ‘Prestige’ accident and the indecisive bureaucratic<br />
handling of the affair, only resulted in paralysing<br />
buyers and sellers a little more.
Minds more competent than ours will be able to<br />
make a cold analysis and comprehensive conclusion<br />
on this incident involving an Aframax tanker<br />
built in 1976, in respect of her maintenance, the<br />
causes and the consequences. Nonetheless, we<br />
can perhaps be permitted to recall some home<br />
truths to those who seem only interested in this<br />
subject either occasionally, or in a partisan or worst<br />
of all in a demagogic manner:<br />
◆ A bad ship is not an old ship, but one badly<br />
maintained.<br />
◆ A bad owner is not an “offshore” owner, but an<br />
irresponsible one.<br />
◆ A bad flag is not a flag of convenience, but a<br />
permissive one.<br />
◆ A bad manager is not an “exotic” manager, but<br />
a manager indifferent towards his crew.<br />
◆ A bad broker is not one looking to make a commission,<br />
but one who fails in his duty to inform.<br />
◆ A bad charterer is not one who optimises his<br />
freight costs, but one who uses the services of<br />
intermediaries in a bad way.<br />
And finally, the most important of all these home<br />
truths and too often wrongly underestimated:<br />
◆ A bad sea is not a rough sea for weekend sailors,<br />
but a sea of destructive force.<br />
No doubt there are a number of bad ships amongst<br />
the older ones, but to suppose that shipping<br />
accidents will cease with the scrapping of all old<br />
ships is fanciful. The strength of a chain is defined<br />
by its weakest link and the same goes for the tanker<br />
fleet. To pretend or suppose that all old ships<br />
are floating rust-buckets, as is the case in France,<br />
Spain and Portugal in the period after the shock at<br />
the end of 2002, is wrong and intellectually dishonest.<br />
Spain in dealing with the ‘Prestige’ repeated the<br />
same mistake as France did with the ‘Erika’, in not<br />
allowing the vessel access to a port of safety and<br />
by sending her out to the open seas in gale force<br />
conditions. This was the worst of all decisions in<br />
our opinion. Japan, China and Taiwan had a similar<br />
reaction, but fortunately without drastic consequences,<br />
at the time of the ‘Front Tobago’ incident<br />
in May off Taiwan.<br />
For the future, it is to be hoped that calmer and<br />
more constructive attitudes will prevail, as it is not<br />
enough just to hope that by an accelerated “phasing<br />
out” of old ships will be the panacea to the<br />
problem of pollution at sea.<br />
The solution exists already, which consists of diverse<br />
regulations, laws, and responsibilities respected<br />
by a large majority of owners. There will be<br />
enough time to create further controls, once the<br />
European states will meet their obligations and<br />
instigate their part-share of port inspections (Port<br />
State Control), when ports of refuge have been<br />
designated, and when ships in distress stop being<br />
sent out into storms in an irresponsible fashion.<br />
Accelerating the “phasing out” is on one hand<br />
unrealistic in view of the age structure of the fleet,<br />
but above all, will probably condemn owners to<br />
bankruptcy or to a reduced activity at sea as well<br />
as on land, by not allowing them to depreciate<br />
their assets over the necessary period foreseen at<br />
the time of acquisition.<br />
The second-hand VLCC market<br />
Only 24 units of this class changed hands in 2002,<br />
some 13 less than in 2001. Among these ships, 7<br />
VLCCs were built in the 70’s and their buyers were<br />
solely motivated by storage or conversion projects.<br />
As an example, we can cite the en bloc sale of<br />
‘Stena King’ and ‘Stena Queen’ for a reported<br />
price in the region of $20 million each.<br />
The age category, which finally caught the attention<br />
of most buyers, was that of vessels built between<br />
1986 and 1995, but all single-hulls. No less<br />
than 12 vessels were concerned, namely half the<br />
global total. This tendency can be explained by the<br />
fact that buyers were mainly Japanese owners,<br />
anxious to renew their fleet with double-hulls,<br />
whilst buyers were primarily Greek taking advantage<br />
of a low-priced market, in the expectation of a<br />
resale in a rising market. These vessels, even singlehulled,<br />
are sufficiently modern to enjoy several<br />
turns of the cycle. To illustrate this contention, we<br />
can quote the sale in June of the ‘Nisseki Maru’,<br />
258,094 dwt built in 1988, for a price of $20 million<br />
and that of the ‘Tango’ 264,340 dwt, 1995<br />
sold at the same time for $29 million, even if their<br />
“phasing out” date is within one year of each<br />
other (2014 for the 1988, and 2015 for the 1995).<br />
The modern double-hull vessels were the losers in<br />
2002, as only 5 units changed hands. The downward<br />
pressure exerted by the low prices being proposed<br />
by shipyards, largely contributed to the<br />
inability of buyers and sellers to find common<br />
ground. Thus Irving Oil finally had to give up and<br />
become resigned to releasing the ‘Irving Primrose’<br />
and the ‘Irving Galloway’, 305,955 dwt, both built<br />
in 1995, for a price of $57 million apiece, against<br />
a 4 to 5 years time charter back.<br />
The Tanker Market in 2002<br />
29
30<br />
Dwt<br />
16 000 000<br />
14 000 000<br />
12 000 000<br />
10 000 000<br />
8 000 000<br />
6 000 000<br />
4 000 000<br />
2 000 000<br />
Shipping and Shipbuilding Markets <strong>2003</strong><br />
Only scrapping saw a more sustained activity in<br />
this size, since 36 VLCCs were disposed in this<br />
way, whereas we accounted 32 such units in<br />
2001. Scrap prices conversely were on a rise<br />
during the course of the year. The number of 36<br />
ships scrapped compensates the number of new<br />
deliveries for the year 2002 which ended at 40.<br />
The Suezmax second-hand market<br />
Very few transactions were recorded in this category<br />
in 2002, as only 18 Suezmax changed hands<br />
and all the more that this total includes tankers<br />
between 115,000 to 199,999 dwt. We have registered<br />
respectively 24, 23 and again 23 sales for the<br />
years 2001, 2000, and 1999.<br />
As with the VLCCs, the poor daily returns severely<br />
limited buyers’ budgets. In 2002, three tankers<br />
built in 1975 and 1976 changed hands including<br />
the ‘Sky’, 154,934 dwt, sold for $8.3 million for<br />
conversion, nearly twice its nominal value.<br />
The very rare Suezmaxes built in the 1980’s were<br />
exchanged in good numbers this year, since 7<br />
were sold, including 4 units from BP, the ‘British<br />
Strength’, ‘British Skill’, ‘British Spirit’, and ‘British<br />
Success’, 127,800 dwt, built in 1983, for the first<br />
three and 1984 for the last, at a price between $6<br />
to $7.25 million each, to two different buyers.<br />
Eight modern double-hulled tankers, less than 10<br />
years old, were sold this year. We can illustrate this<br />
by the sale of the ‘Chevron Atlantic’, 149,748 dwt,<br />
built in 1992, sold for about $28.5 million in June,<br />
0<br />
8<br />
17<br />
36<br />
and of a vessel under construction named<br />
‘Antares’ with delivery in 2002, for a reported<br />
price of $51 million.<br />
Scrappings of this type of ship were at the same<br />
level as in 2000 (16 units), as in 2002 we counted<br />
17 units, compared to no less than 28 in the intervening<br />
year. In contrast to VLCCs, which were<br />
scrapped mostly at the beginning of the year,<br />
Suezmax sales were spread out over the year. At<br />
the same time, 25 new ships in this category left<br />
the shipyards.<br />
1997 1998 1999 2000 2001 2002<br />
29<br />
The Aframax and Panamax<br />
second-hand market<br />
If we include ships over 60,000 dwt, but with<br />
beams of over 32.20 metres, we recorded 31 deals<br />
for Aframaxes up to 119,000 dwt in 2002. It is<br />
therefore this category that has been least affected<br />
by the depression, mainly as the daily returns<br />
were less disastrous than in larger sizes.<br />
The annual volume remains fairly steady as we<br />
have registered 34 and 36 sales in 2001 and 2002.<br />
Prices of modern tankers have seemed too expensive<br />
in the eyes of buyers in comparison to the<br />
alternative of newbuildings, which is why activity<br />
has been concentrated in the oldest ships. The<br />
lion’s share went to vessels in the 1977-1988 age<br />
bracket with 20 sales out of 31, as asking prices<br />
were sufficiently realistic to allow buyers to adapt<br />
to spot rates which held up well. We can give as<br />
representative sales, the ‘Marifru Maru’,<br />
101,838 dwt, built in 1979, sold for $3.6 million,<br />
VLCC deletions figures<br />
40<br />
Demolition<br />
Conversion<br />
41
the ‘Afrapearl’, 86,417 dwt, built 1981, sold for<br />
about $4.75 million, and the ‘Maersk Visual’,<br />
110,296 dwt, built 1988, for $18 million.<br />
Eleven modern ships (built after 1990) were sold<br />
this year of which 5 single-hull. Among them we<br />
can cite the ‘CSK Valiant’, 97,151 dwt, 1990, for a<br />
price of $17.8 million, and that of ‘Ventikos’,<br />
69,998 dwt, built 1993 with a beam of 36 meters,<br />
for $18.3 million.<br />
Six more modern and double-hulled units changed<br />
hands. We can quote the ‘Diana’, 96,125 dwt,<br />
built in 1992, sold for $23.5 million in July, whereas<br />
a more modern vessel built 1999 with a centreline<br />
bulkhead the ‘Pine Venture’, 105;000 dwt,<br />
obtained about $33.25 in February.<br />
We have seen this past year 20 ships going to<br />
scrap, slightly more than in 2001, two more than<br />
in 2000, and the same number as in 1999. In compensation,<br />
some 43 units joined the fleet in 2002.<br />
More ships should have been demolished this past<br />
year if one looks at the age structure of the fleet,<br />
however spot rates were not bad enough to cause<br />
a rush towards the scrapyards of Pakistan, India,<br />
China or Bangladesh.<br />
Panamax tankers (less than 32.30 meters beam)<br />
also saw a reduced activity, as only 11 changed<br />
hands in 2002 as compared to 22 the previous<br />
year. Seven of them were built between 1978 and<br />
1986. Otherwise 2 modern single-hull ships of<br />
1991 and 1992 as well as 2 double-hulled resales<br />
were realised.<br />
We can indicate the following sales: the ‘Kestrel’,<br />
56,963 dwt of 1979, for $2.5 million in October,<br />
that of the ‘Seamusic III’, 70,914 dwt, built 1992,<br />
for about $21 million in February, and finally one<br />
of the rare en-bloc sales of the year, that of ‘LMZ<br />
Mandi’ and ‘LMZ Zacvi’, 70,000 dwt, built 2002,<br />
sold in April for $36.5 million apiece.<br />
We have thus seen again that in this segment of<br />
the market, the price spread between buyers and<br />
sellers was insurmountable for the newest ships,<br />
as well as for the largest.<br />
No less than 13 ships were scrapped compared to<br />
7 in 2001 and 8 in 2000. This is a good figure if<br />
we remember that 9 units joined the fleet in 2002,<br />
but this should be seen in the light of 46 new<br />
orders placed in 2002 and an orderbook which<br />
has already more than 70 ships.<br />
The second-hand market for OBOs.<br />
This type of vessel encountered sales similar to that<br />
of the previous year, since 9 units were sold compared<br />
to 11 in 2001. This category of the market<br />
thus continues to retract in the course of time and<br />
the specialisation of the fleet prevents a renewal.<br />
Contrary to last year, no modern unit changed<br />
hands since all OBOs sold for further trading were<br />
built between 1980 and 1988. The double-hulled<br />
configuration of these vessels has however allowed<br />
them to obtain respectable prices in comparison to<br />
classical tankers of similar age.<br />
We can illustrate this with the sale of the ‘Probo<br />
Baro’, 48,062 dwt, built 1988, for a price in the<br />
order of $11.7 million, with a 2 year time charter<br />
back. Also to be noted were the sales of the ‘Sapphire’,<br />
70,681 dwt, built 1981, for $2.9 million in<br />
July, and that of the ‘Tijuca’, 310,686 dwt, built<br />
1987, for a price of $25.5 million.<br />
Otherwise 13 ships between 50,000 and<br />
132,000dwt were taken off to the scrapyards, thus<br />
diminishing further the number of this type of vessels<br />
in the fleet. Today we estimate the active fleet<br />
to include about 120 Oil-Ore and Oil-Bulk-Ore<br />
units of over 50,000 dwt. Nonetheless two new<br />
units of 121,000 dwt will enter the fleet in <strong>2003</strong>.<br />
Tomorrow’s market<br />
Improved levels that owners enjoyed at the end of<br />
the year was a welcomed compensation for the<br />
poor rates which prevailed over most of 2002, but<br />
it is likely that once the Venezuelan and Iraqi crisis<br />
come to an end, the gloom will return. Only<br />
the Chinese economy is looking healthy, but even<br />
if they increase their crude oil transportation<br />
requirements, they will be unable to sustain the<br />
market on their own. The U.S., Europe, and Japan<br />
seem to continue to be stumbling along at least<br />
for the first half of <strong>2003</strong>. Thus we will probably<br />
have to go through a further reduction in activity<br />
until the above crisis and conditions have been<br />
fully played out.<br />
On the other hand, the balance between supply<br />
and demand is more delicate than we might have<br />
expected, as witnessed by the sudden surge in<br />
rates at the end of 2002. If the price of new buildings<br />
were to stop their infernal fall and the pace<br />
of scrappings were to let off, or even accelerate following<br />
the ‘Prestige’ incident, we should be able to<br />
see a bigger volume of business in <strong>2003</strong>. ■<br />
The Tanker Market in 2002<br />
31
32<br />
Seacrown<br />
40,039 dwt product tanker,<br />
delivered <strong>2003</strong><br />
by Hyundai Mipo,<br />
operated by Thenamaris<br />
Shipmanagement.<br />
Shipping and Shipbuilding Markets <strong>2003</strong><br />
The transport of refined oil products<br />
With regards to the transport of refined<br />
products in 2002, the year ended in a<br />
state of euphoria. This unexpected surprise<br />
however should not hide the fact that the<br />
year as a whole was rather mediocre: although the<br />
market was able to absorb the numerous deliveries<br />
of new ships, the rates obtained both on spot<br />
voyages as well as time-charters during the first<br />
10 months of the year scarcely surpassed the levels<br />
obtained at the end of 2001.<br />
The weakness of the world economy affected the<br />
demand of refined products, whilst the delivery<br />
of new units were not matched by an equivalent<br />
number of vessels being withdrawn from the<br />
market.<br />
Nonetheless, it is worth noting:<br />
◆ that the Asian zone achieved more activity than<br />
had been foreseen, resulting in a large increase in<br />
naphtha imports, which was particularly favourable<br />
to the bigger sizes: LR1 and LR2.<br />
◆ that although the market was generally depressed,<br />
it nevertheless remained very volatile, showing<br />
that the delivery of 80 new product carriers<br />
(from 30 to 80,000 dwt) was not enough to upset<br />
the balance of supply and demand in tonnage.<br />
For the second year running, daily returns of<br />
product carriers suffered a steady decline.<br />
The ‘handysize’ (handy product)<br />
from 25,000 to 40,000 dwt<br />
Specialising in the Mediterranean-Atlantic zone, this<br />
category was the first to feel the pinch of the weak<br />
American demand and the stagnation in Europe:<br />
daily returns dropped continuously from January to<br />
October, with the exception of the month of April,<br />
with the low point being achieved in September.<br />
Despite the poor state of the market overall,<br />
modern vessels (double-hulled) were always given<br />
priority by charterers.<br />
While average daily returns achieved around<br />
$ 11,500 per day, levels being asked by owners for<br />
periods of 1 year rarely dropped below $ 13,500<br />
per day, reflecting the confidence in modern vessels<br />
by charterers. Very few long period charters (2<br />
years or more) were concluded, with the exception<br />
of refinancing operations (bareboat charters).<br />
Owners confidence is based on the evidence of a<br />
very volatile market, which is explained by two<br />
principal factors:<br />
◆ These vessels are largely used for carrying fuel oil
US$/day<br />
70,000<br />
60,000<br />
50,000<br />
40,000<br />
30,000<br />
20,000<br />
10,000<br />
0<br />
Jan 01 Mar 01 May 01 Jul 01 Sep 01 Nov 01 Jan 02 Mar 02 May 02 Jul 02 Sep 02 Dec 02<br />
◆ The proportion of the fleet controlled by independent<br />
owners is small.<br />
This sector of the market is therefore particularly<br />
sensitive to the change in the demand of “clean”<br />
refined products to which the tonnage supply cannot<br />
adjust to quickly, thus being the first to benefit<br />
from the upsurge realised at the end of the year.<br />
The ‘medium range’ (MR product)<br />
from 40,000 to 50,000 dwt<br />
This category of the fleet is the most modern and<br />
most numerous. Daily returns suffered the effects<br />
of the backlash in the general demand. However<br />
working primarily in the Asian zone, these vessels<br />
were on the whole better off than the handysize.<br />
In addition they continued to be sought after for<br />
medium term periods.<br />
In the Atlantic zone daily returns followed the<br />
same fate as the handysizes, with the average<br />
monthly rates being around $ 12,500 per day.<br />
Despite a thin period between April to May, vessels<br />
in the Asian zone were able to benefit from<br />
the good behaviour of the local market and in the<br />
absence of competition from the 35 – 37,000 dwt<br />
were able to perform inter zone voyages. They<br />
also were able to enjoy certain long voyages:<br />
Middle East Gulf / Europe and above all Singapore<br />
or South Korea – U.S. West Coast.<br />
Given the relatively satisfactory results on daily<br />
returns, owners of modern vessels kept to their<br />
objectives of between $ 13,750 to $ 14,000 per<br />
day, pushing charterers to fall back on vessels of<br />
Product tanker freight rates<br />
Average earnings<br />
55,000 t MEG/Japan<br />
35,000 t Rotterdam/New York<br />
28,500 t Caribs/USAC<br />
10 to 12 years of age. Notwithstanding several<br />
long term periods (3 to 5 years) were made.<br />
The ‘long range’ (LR product)<br />
55,000 to 110,000 dwt<br />
Specialising in the transport of light products<br />
(naphtha / condensate) towards Japan and Korea,<br />
these vessels were able to benefit from the strong<br />
Asian demand. They also were frequently fixed for<br />
voyages towards Europe and the U.S. West Coast.<br />
Despite the fact that the curve on rates rose from<br />
April to October, daily returns rarely surpassed<br />
$ 15,000 per day for LR1s and $ 16,000 per day<br />
for LR2s up until the take-off in November. However<br />
the suddenness of the rise in rates, which<br />
broke the $ 25,000 per day barrier within several<br />
days only goes to show the underlying volatility of<br />
the market. The ageing of the LR1 fleet and the<br />
small number of new orders of LR2 should not<br />
upset the tendency for <strong>2003</strong>.<br />
Few period fixtures were concluded with the exception<br />
of modern Panamaxes which Enel and BP chartered<br />
at levels of $14,850 and $15,000 for 3 years.<br />
The sudden rise at the end of the year indicates<br />
that the delivery of new ships has not<br />
upset the balance in the supply and demand<br />
of tonnage, nonetheless this balance could<br />
quickly become out of step…<br />
The availability of modern tonnage, which did<br />
not really become surplus at the end of 2002,<br />
could easily change.<br />
The Tanker Market in 2002<br />
33
34<br />
Dwt<br />
16,000,000<br />
14,000,000<br />
12,000,000<br />
10,000,000<br />
8,000,000<br />
6,000,000<br />
4,000,000<br />
2,000,000<br />
Shipping and Shipbuilding Markets <strong>2003</strong><br />
0<br />
30,000 - 40,000 dwt 40,001 - 50,000 dwt<br />
Eighty new units of 30,000 to 80,000 dwt were<br />
delivered in 2002 and up to 2005 some 300 additional<br />
vessels should leave the shipyards.<br />
This increase in modern tonnage, even if no new<br />
order for delivery prior to 2005 is made, will result<br />
in a rapid rejuvenation of the available fleet since<br />
product tankers less than 20 years old will increase<br />
by more than 20 % in 2005 compared to today<br />
(over 850 ships of 30 to 80,000 dwt as compared<br />
to 625 in December 2002).<br />
This rejuvenation applies to all categories of the<br />
market (see table) but is particularly significant in<br />
the MR range of 40 to 50,000 dwt.<br />
It is increasingly difficult for vessels over 20 years<br />
old to find employment with oil companies, and<br />
even first-class traders. However if these older vessels<br />
have difficulty in operating in the fuel oil sector<br />
within the Atlantic zone, they can fall back on<br />
the East of Suez market and/or find activity transporting<br />
molasses or vegetable oil.<br />
In these circumstances, even though the recovery<br />
of the market which is normal during winter and<br />
has been assisted by the ‘Prestige’ sinking, it is<br />
possible that this is only a short-lived reprieve<br />
given that more than 130 new vessels will come<br />
onto the market in <strong>2003</strong>.<br />
30,000 to 80,000 dwt product tankers fleet<br />
Distribution by size and age class<br />
Less than 20 years<br />
20 years and over<br />
On order<br />
50,001 - 80,000 dwt<br />
Demand for product tankers<br />
could increase in the course<br />
of the next few years.<br />
The growing expansion of American imports from<br />
Russian origin will automatically increase the<br />
requirements for product tankers by extending the<br />
number of long voyages and in requiring owners<br />
to develop their ‘ice-class’ tonnage.<br />
In addition, it is probable that given that the existing<br />
fleet of double-hulled Aframaxes will not be<br />
sufficient to satisfy the transport needs for fuel oil,<br />
vessels of 45,000 dwt and new Panamaxes will<br />
find a secondary market of increasing interest.<br />
Finally, even if European demand remains in the<br />
doldrums, the American economy is at last showing<br />
signs of recovery, and this is the major factor<br />
in moving freight rates especially as the Venezuelan<br />
crisis might push the U.S. to find alternative<br />
supplies from further afield.<br />
If all these factors keep their promise, the year <strong>2003</strong><br />
might prove to be much better than one might<br />
expect given the numerous deliveries scheduled.<br />
However any optimistic forecast should be tempered<br />
by the recognition that the improvement in the<br />
world economy remains fragile. An economic crisis<br />
in the Far East, a military crisis in Iraq, an important<br />
bankruptcy in Europe, could jeopardise the<br />
recovery and the market would then go back into<br />
a slump. ■
The product tankers second-hand market<br />
can be qualified as a low profile year.<br />
2002Hardly more than 58 ships of 25,000<br />
to 110,000 dwt were sold for further trading<br />
including 33 handysize, 17 medium range and 8<br />
long range product tankers. Eighteen ships built in<br />
the 70’s were sold, against 22 built in the 80’s and<br />
18 in the 90’s among which 10 were less than 3<br />
years old.<br />
In this size range, 76 ships were delivered in 2002<br />
representing 3.55 million dwt. In the same period of<br />
time, 56 ships were deleted for a total of 2.05 million<br />
dwt, but at the end of the year the orderbook<br />
accounted for 329 product tankers for an overall<br />
tonnage of 17.2 million dwt, of which 153 for delivery<br />
in <strong>2003</strong>, 134 in 2004 and around 40 in 2005.<br />
With low freight rates being maintained over a<br />
large part of the year, ships values took without<br />
any surprise their way down at least until October,<br />
before gaining again some ground by the end of<br />
the year.<br />
A standard 45,000 dwt product tanker built in<br />
1998 that worth around $23 million in January, saw<br />
its value declining to $22 million before recovering<br />
a level in the region of $23 million in December.<br />
Again in 2002, we observed a significant number<br />
of purely financial deals, where sales are systematically<br />
attached to charters back. The German market<br />
was particularly attractive for such deals.<br />
The ‘Prestige’ incident and the increased pressure<br />
coming from both local and international authorities,<br />
act in the favour of modern ships. The<br />
demand for recent units is high on the market that<br />
sustains their values, while older assets struggle to<br />
find buyers and at price levels directly linked to<br />
their limited trading capacities.<br />
This will accelerate the phasing-out of the oldest<br />
units in the years to come. This renewal trend will<br />
also be accelerated by the huge number of ships<br />
currently on order, which will heavily weigh on the<br />
market.<br />
The ‘Prestige’ incident, a cold Winter, the Venezuelan<br />
strike and some signs of growth recovery in<br />
the United-States made the year 2002 ending on<br />
a bright note. This must however be tempered by<br />
the possible consequences of a war in Iraq, a massive<br />
orderbook and a weakness of some other economic<br />
areas in the world. ■<br />
Bolero<br />
45,998 dwt product tanker,<br />
built in 1996 by Halla,<br />
operated by Laurin<br />
Maritime.<br />
The Tanker Market in 2002<br />
35
36<br />
Shipping and Shipbuilding Markets <strong>2003</strong><br />
The <strong>BRS</strong> Web site<br />
www.brs-paris.com<br />
<strong>BRS</strong> offers a web site with regular updated information<br />
on international maritime transportation.<br />
In addition to the numerous pages with free access,<br />
<strong>BRS</strong> has available for clients<br />
PAGES WITH FREE ACCESS:<br />
data and on line services<br />
• Group profile<br />
adapted to their specific<br />
• Contacts for each department<br />
needs.<br />
• Annual review<br />
• Newsletters:<br />
– Weekly: dry cargo, crude oil and petroleum products<br />
– Monthly: liner shipping, LPG, sale and purchase<br />
PAGES WITH PRIVATE ACCESS:<br />
• A daily press report<br />
• Statistics (freights, prices, orderbooks…)<br />
• Weekly analyses<br />
• Specific studies
THE<br />
OFFSHORE<br />
AND<br />
SPECIALISED<br />
SHIPS MARKETS<br />
IN<br />
2002<br />
In general we’ve seen a slow down and at best<br />
a steadiness in the offshore industry sectors.<br />
The high oil price throughout the year did not<br />
boost the exploration & production investments,<br />
nor did the Iraki crisis really impact the supply and<br />
demand balance.<br />
Consolidations, mergers and acquisitions have<br />
continued in all industry branches. We have witnessed<br />
the giant Conoco – Phillips merger and in<br />
the offshore and engineering / construction side<br />
we saw the formation of Aker-Kværner as well as<br />
the Keppel Fels takeover of Verolme Botlek.<br />
Pushing into deeper and deeper waters, the technological<br />
differences in the various areas are slowly<br />
being erased and we see the early beginning of<br />
a market globalisation with a few key players for<br />
each of the offshore markets.<br />
Offshore support vessels<br />
The Anchor Handling Tug / Supply (AHTS) and the<br />
Platform Supply Vessel (PSV) fleet utilisation conti-<br />
nued to drop in the main markets throughout<br />
most of the year. Lower drilling activities and delivery<br />
of a number of uncommitted newbuildings,<br />
have both contributed to the market imbalance.<br />
A general trend is continued in so far that oilfields<br />
are developed further from the coast, in deeper<br />
waters and in areas outside the established offshore<br />
field infrastructures. This creates a demand<br />
for a further evolution of the sophisticated and<br />
self-sustaining multipurpose modern vessels.<br />
Groupe Bourbon worked their way into the North<br />
Sea with a controlling stake in Havila Supply ASA<br />
with Saevik, Ulstein and Aker as substantial allies.<br />
Havila will as a result obtain a better foothold in<br />
West-Coast Africa as well as in Brazil. An example<br />
of this, is the Petrobras award to Island Offshore II,<br />
in which Groupe Bourbon owns 51% of the<br />
contract for the UT722L ‘Havila Crown’. The vessel,<br />
being the first of three newbuilding vessels of<br />
this kind, will be operated by Havila and Delba<br />
Maritima.<br />
The Offshore and specialised Ships Markets in 2002<br />
37
38<br />
Athena<br />
Multipurpose Support<br />
Vessel, built 2002<br />
by Keppel shipyard<br />
(Singapore),<br />
owned by SURF.<br />
Utilisation %<br />
100<br />
Shipping and Shipbuilding Markets <strong>2003</strong><br />
90<br />
80<br />
70<br />
60<br />
50<br />
40<br />
30<br />
20<br />
10<br />
0<br />
Jan 99<br />
Apr 99<br />
July 99<br />
Oct 99<br />
China is further substantiating its share of the<br />
newbuilding market of offshore support vessels<br />
for owners such as Vroon and Sealion.<br />
North Sea<br />
The spot market never gained the expected summer<br />
momentum this year, but peaked in October<br />
with large AHTS obtaining charter rates up to<br />
$55,000 per day. The low drilling activities, com-<br />
Jan 00<br />
Apr 00<br />
Jack-ups utilisation rates<br />
July 00<br />
Oct 00<br />
Jan 01<br />
Apr 01<br />
July 01<br />
Oct 01<br />
Jan 02<br />
North Sea - NW Europe<br />
West Africa<br />
North America<br />
bined with a constant drip feed of PSV / AHTS<br />
newbuildings and a steady supply of sublet tonnage,<br />
has seen a market paying in general below<br />
the $20,000’s per day.<br />
Up to now an almost static stand-by / rescue market<br />
is about to evolve from a one-vessel-per-rig<br />
into a multipurpose field support vessel scenario,<br />
that offers area contingency for several fields<br />
simultaneously. The design is a safe, fast and envi-<br />
Apr 02<br />
July 02<br />
Oct 02
Utilisation %<br />
100<br />
90<br />
80<br />
70<br />
60<br />
50<br />
40<br />
30<br />
20<br />
10<br />
0<br />
Jan 99<br />
Apr 99<br />
July 99<br />
Oct 99<br />
ronmental friendly offshore unit with ROV facilities,<br />
helideck and fast MOB’s. Simon Møkster Shipping<br />
AS, Norway, was awarded a sound 8 years<br />
firm Statoil contract upon which the above will be<br />
constructed.<br />
The North Sea shipyards’ continuous trend<br />
towards building hulls in low-cost areas with home<br />
outfitting continues. The barrier of hull building is<br />
gone, consequently, repair yards in Eastern Europe<br />
are entering the scene taking a share of the newbuilding<br />
market.<br />
U.S. Gulf<br />
The charter rates in this market were on average<br />
about 20 % lower than in 2001. The fleet utilisation<br />
dropped and owners reported lower earnings,<br />
some were even forced to lay up old tonnage in<br />
order to balance the market.<br />
U.S. Gulf field developments are also increasingly<br />
moving into deeper water. Many old vessels are<br />
being traded and others are idle in need of several<br />
$100,000’s input per ship in order to comply with<br />
classification requirements. The market is in need<br />
of a continuous fleet renewal in order to be able to<br />
offer modern services to demanding oil companies.<br />
Several market contenders rise to the challenge:<br />
◆ Hornbeck Offshore Services LLC continues<br />
expanding with 4+ 4 options DP2 Offshore Support<br />
Vessels being built at Leevac Industries.<br />
◆ Otto Candies took delivery of DP2 Offshore Support<br />
Vessels from Bender Shipyard and from the<br />
Jan 00<br />
Apr 00<br />
Semi-Submersibles utilisation rates<br />
July 00<br />
Oct 00<br />
Jan 01<br />
Apr 01<br />
July 01<br />
Oct 01<br />
Jan 02<br />
North Sea - NW Europe<br />
West Africa<br />
North America<br />
new and interesting Houma Fabricators, acquired<br />
by the Dutch shipyard De Hoop.<br />
◆ Rigdon Marine contracted 10 OSVs at Bender<br />
Shipyard representing the largest single offshore<br />
order in the history of USA.<br />
◆ Tidewater placed an order for four PSVs at Bollinger<br />
Shipyards.<br />
Large U.S. owners are building vessels in the<br />
U.S.A. in compliance with the Jones Act and the<br />
surplus tonnage is attempting to trade in the offshore<br />
markets of Brazil, Africa and Mexico.<br />
West Coast Africa<br />
The general West Coast Africa market proved<br />
strong enough to absorb tonnage coming from<br />
the North Sea / U.S. Gulf, due to the high level of<br />
production development activities offering some<br />
long term opportunities.<br />
Esso Exploration Angola, a local subsidiary of<br />
ExxonMobil, awarded a shipping services contract<br />
to Sonasurf, the joint venture between Sonangol<br />
and Surf. The duration of the contract was 5 years<br />
firm, but included options for two more 5-year<br />
periods. The contract provides for it to define and<br />
manage all the shipping resources required for the<br />
development and operation of production fields<br />
on block 17.<br />
The African West Coast subsea market has further<br />
evolved throughout the last years, stretching from<br />
the laying of flexible and rigid pipes from heavy<br />
Apr 02<br />
July 02<br />
Oct 02<br />
The Offshore and specialised Ships Markets in 2002<br />
39
40<br />
Rigdon Marine<br />
View of one of the ten<br />
DP II OSVs, to be delivered<br />
2004/2005 by Bender<br />
Shipbuilding (USA),<br />
ordered by Rigdon Marine<br />
(USA).<br />
Shipping and Shipbuilding Markets <strong>2003</strong><br />
crane barges, to today’s grown market with deep<br />
sea trends. The large spread moored barges are<br />
slowly being replaced by modern vessels in line<br />
with any international versatile tonnage.<br />
An answer to these as well as to international<br />
requirements is Surf’s newbuilding ‘Athena’ a<br />
VS4501 MPSV delivered from Keppel this year,<br />
equipped with DP2, accommodation for 82 persons,<br />
FI-FI 2, under-deck capacities, anti-pollution<br />
equipment, a high reaching 100t crane, moonpool<br />
and a helideck in order to do a larger scope<br />
of work.<br />
Large support vessel owners such as Farstad and<br />
GulfMark are eyeing this evolving market and have<br />
begun bidding for tenders in competition with the<br />
players already present.<br />
Brazil<br />
The Brazilian deep offshore market has been less<br />
subjected to the overall markets, despite a high<br />
domestic demand for oil, and as such, enjoys an<br />
uninterrupted and steadily progressing E&P programme.<br />
This domestic market prevents an open<br />
access for international offshore tonnage, in the<br />
form of national flag requirements briefly outlined<br />
as follows:<br />
◆ Heavy taxes on flagging foreign vessels into Brazil<br />
to qualify for tenders.<br />
◆ By law, local tonnage has the first right to any<br />
Brazilian tender and as such, the tendering business<br />
is open to the public. If local tonnage doesn’t<br />
comply with the requirement, foreign tonnage<br />
can, through local co-operating partners or subsidiaries,<br />
obtain an operating licence for renewable<br />
two-year periods.<br />
The motivation of building in Brazil is direct qualification<br />
to work in Brazilian waters, long-term<br />
contracts from Petrobras, a high demand for<br />
sophisticated tonnage and beneficial financing.<br />
Instant access to the market is also of importance<br />
as owners with vessels under construction in Brazil<br />
are allowed to market their foreign built frontrunner<br />
during the entire construction period.<br />
Local shipyards have been reactivated thanks to<br />
participations taken by experienced European and<br />
Far Eastern shipyards.<br />
Some of the market players that have been taking<br />
advantage of the Brazilian market: Solstad Offshore<br />
ASA and District Offshore ASA joining forces<br />
forming Norskan Offshore Ltda. They have 2 x<br />
UT755L under construction at Aker Promar, where<br />
GulfMark’s UT719-2 and UT755L are also under<br />
construction.<br />
It is unlikely that this market will reach a saturation<br />
point in the nearest future.<br />
Caspian Sea<br />
The Caspian El Dorado in the offshore oil activities<br />
resulted this year in BUE taking delivery of a tailormade,<br />
shallow draft AHTS icebreaker built at<br />
Ulstein Verft. The same owner also bought and<br />
now operates the AHTS ‘Stirling Iona’ and ‘Stirling<br />
Jura’ in this region.<br />
Due to the narrow river / canal systems, modulated<br />
offshore units are brought in by oil companies<br />
for assembly in the Baku area and the local competence<br />
are struggling to get in on the technical<br />
side. We foresee more newbuilding orders for<br />
these waters in the time to come.<br />
Subsea Construction / Surface Systems<br />
The demand for subsea construction was less affected<br />
by the general industry slow down than expected.<br />
Whilst North Sea activity was on the low side,<br />
West Africa has been literally pulling up the market.<br />
Effectively there are numerous surface systems<br />
under construction or installation. We also notice a<br />
world wide increase in number of projects being<br />
tendered, which leads us to believe that this industry<br />
will not suffer from a lack of demand in volume.<br />
On the negative side, most of the industry players<br />
have been hit by lower margins and the risk associated<br />
to turnkey lumpsum projects, thus we saw<br />
the creation of Subsea 7, the result of Halliburton<br />
Subsea and DSND merging their subsea construction<br />
vessels into one fleet.
Average reported day rates in £/day<br />
30,000<br />
25,000<br />
20,000<br />
15,000<br />
10,000<br />
5,000<br />
0<br />
Jan 98<br />
Apr 98<br />
July 98<br />
Oct 98<br />
Jan 99<br />
Contractors are also consolidating their fleet by<br />
trying to get rid of their older tonnage and upgrading<br />
their existing vessels.<br />
In small / medium size construction vessels segment,<br />
contractors are submitted to the competition<br />
of the new versatile tonnage ordered by<br />
conventional supply shipowners.<br />
A construction worth noticing is the “North Seatype<br />
Light Well Intervention Vessel” being built at<br />
Aker Brattvaag. The new UT 737-L design will be<br />
delivered in July <strong>2003</strong>. The exhaustive efforts of<br />
streamlining the difference in regulations between<br />
the Maritime Administration (NMD) and the State<br />
Department of Oil (NPD) eventually resulted in the<br />
long awaited DnV class notation “Well Intervention<br />
Unit Class 1”. The vessel’s main features are<br />
106 x 21 m, compact azipod main propulsion,<br />
DP3, accommodation for 84, helideck and a 100t<br />
heavy compensated crane. The $ 68 m vessel is<br />
being built on speculation for Island Offshore V.<br />
The general demand for big surface projects proved<br />
strong enough to keep the main EPC contractors<br />
busy throughout the year. Some of the main<br />
interesting events and trends to notice in 2002 are<br />
amongst others:<br />
◆ The further consolidation of the market: Saipem<br />
took full control of Bouygues Offshore. Renaming<br />
it Saipem SA, they dramatically increased their<br />
engineering capacity. Together they were awarded<br />
the contract for the construction of the 2 million<br />
bbls ‘Ehra FPSO’ for Exxon Nigeria.<br />
Apr 99<br />
July 99<br />
North Sea supply vessel market<br />
Oct 99<br />
Jan 00<br />
Apr 00<br />
July 00<br />
Oct 00<br />
AHTS > 10,000 bhp<br />
PSV > 2,000 dwt<br />
Jan 01<br />
Apr 01<br />
July 01<br />
Oct 01<br />
◆ The withdrawal of Keller Brown & Root and ABB<br />
Oil & Gas as prime contractors from this specific<br />
market.<br />
◆ The emergence of China as an FPSO hull builder.<br />
◆ The increase of South Korea’s market share in<br />
this sector: Hyundai firmed up the contract for the<br />
construction of the Exxon Angola 2 million bbls<br />
FPSO and DSME (Daewoo) secured another<br />
contract for a TLP (tension leg platform) for Exxon<br />
Angola Kizomba B field.<br />
We expect the engineering and contracting companies<br />
to remain rather busy next year.<br />
Drilling<br />
The general activity and fleet utilisation have overall<br />
been low throughout the year. The markets<br />
hardest hit are the Gulf of Mexico and the North<br />
Sea with numerous idle units. The latter saw UK<br />
raise corporation tax by 10 % thus further reducing<br />
the oil companies’ expected return in this<br />
high-cost area. Better off markets are the West<br />
Coast Africa, Australia, Indonesia, Malaysia and<br />
the Mediterranean.<br />
Some of the downturn can possibly be blamed on<br />
the recent years’ consolidation costs among the oil<br />
companies, reducing the drilling budgets.<br />
Concerns about the world economy, the Iraki crisis<br />
and its implications for oil and gas prices, are<br />
other factors causing companies to be cautious.<br />
This trend is also reflected in the low level of newbuilding<br />
activities; on the other hand, the sale and<br />
Jan 02<br />
Apr 02<br />
July 02<br />
Oct 02<br />
The Offshore and specialised Ships Markets in 2002<br />
41
42<br />
FSO Unity<br />
2 million bbls, blt 2002<br />
by Hyundai for SBM,<br />
will be operated<br />
on TotalFinaElf's field,<br />
Amenam (Nigeria).<br />
FPSO Erha<br />
To be delivered by Saipem SA<br />
to Exxon Nigeria,<br />
the hull will be built by HHI<br />
into a conventionnal dock<br />
unlike the ‘FSO Unity’<br />
which was built ashore.<br />
Shipping and Shipbuilding Markets <strong>2003</strong><br />
purchase market has been very active with the following<br />
relevant transactions:<br />
◆ Ensco made a cash and stock offer and took over<br />
Chiles Offshore’s five modern 300 feet + jack-ups.<br />
◆ Diamond Offshore bought the $ 68.5 m semisubmersible<br />
‘West Vanguard’ from Smedvig ASA<br />
and the $ 65 m semi-submersible ‘Omega’ from<br />
Transocean.<br />
Instead of going for new constructions, contractors<br />
should carry on refurbishing and upgrading their<br />
existing fleet so as to maintain their access to the<br />
market at affordable costs, in combination with a<br />
drought of long term contracts in the drilling market.<br />
Seismic Market<br />
Few opportunities have arisen in this market as the<br />
volume demand for 2D and 3D data also suffered<br />
from the general exploration slowdown.<br />
The ‘CGG Mistral’ conversion was completed and<br />
the vessel was re-delivered in 2002, being the firstof-it’s-kind<br />
having triple-screw propulsion. She was<br />
fitted with the new CGG solid streamers system.<br />
Unfortunately she sunk in December. CGG also<br />
acquired a 7.51 % stake in troubled PGS, which<br />
hints at a further consolidation in this market.<br />
Western Geco continued this year to sell old tonnage.<br />
Some of these were the ex-seismic vessels<br />
‘Western Atlas’ and the previously flooded ‘Geco<br />
Sapphire’, both being sold out of the seismic market<br />
and therefore at prices quite lower than the<br />
initial asking price.<br />
Cable Laying Market<br />
The demand remained close to zero throughout<br />
the year, consequently Global Crossing’s attempt<br />
to dominate the market for high speed data communications<br />
was followed by the $ 12.4 bn bankruptcy.<br />
Hutchison Whampoa and Singapore Technology<br />
should manage to pick up the remains in a<br />
deal totalling $ 750 m.<br />
Another 8 newbuildings and 1 conversion vessel<br />
were delivered into the market, whereas charterers<br />
have released as many as possible. Some vessels<br />
are returning to the offshore market, amongst<br />
these are the ‘Ocean Commander’, ‘Toisa Conqueror’<br />
and the ‘Maersk Forwarder’. Others were sold<br />
for subsea purposes: Sealion bought the ‘Fresnel’<br />
from FT Marine and Torch Offshore bought the<br />
‘Wave Alert’ from Global Marine. The latter vessel<br />
will be fitted with a 125 ton crane. A few other<br />
vessels are still on-hire, but most are laid-up or idle.<br />
The low level of activity in the repair and maintenance<br />
sector did not compensate the collapse of<br />
the laying activity.<br />
◆◆◆<br />
Prospects<br />
Drilling activities will remain low in the first half of<br />
<strong>2003</strong>, but could pick up towards the second half of<br />
the year in line with the increase in oil companies’<br />
exploration budgets. The seismic contractors should<br />
also benefit from this rebound. We expect to see a<br />
further materialisation of new markets in the regions<br />
of the Caspian Sea and the Sakhalin Islands. Following<br />
the change of regulations, we hope to see tenders<br />
for FPSOs in the Gulf of Mexico in <strong>2003</strong>.<br />
The supply vessel market has evolved over the last<br />
10 years from being an exception in the North Sea,
to become one of major importance in multiple<br />
geographical areas. Most of these areas have<br />
developed into deep water projects and the support<br />
vessel designs enabling E&P support in these<br />
environments are beginning to set an international<br />
standard.<br />
The market globalisation will cause an easier shifting<br />
of supply vessel tonnage between the geographical<br />
markets and the natural consequence<br />
will be a further consolidation in this sector. As<br />
such, we also expect the various segments to<br />
move deeper into correlated cycles, a bit like most<br />
other international shipping markets. This is of<br />
course with the exception of the protected offshore<br />
areas.<br />
The combination of the above could further<br />
impact the associated markets and hopefully last<br />
long enough to absorb and to balance out the<br />
numerous supply vessel newbuildings delivered<br />
over the last two years.<br />
Operators of subsea and pipe-laying vessels will<br />
have to pursue their fleet downsizing as demand<br />
in <strong>2003</strong> will not meet expectations.<br />
When the supply and offshore vessels market<br />
eventually regains balance, traditional builders<br />
should be alerted to cope with the pressure from<br />
the emerging builders from China, who have set<br />
their minds to take a significant stake of the newbuilding<br />
market. ■<br />
Samuel de Champlain<br />
A versatile diesel electric<br />
maintenance suction dredger,<br />
built 2002 by Izar (Gijon),<br />
owned by G.I.E. Dragages<br />
Ports.<br />
The Offshore and specialised Ships Markets in 2002<br />
43
44<br />
Shipping and Shipbuilding Markets <strong>2003</strong><br />
<strong>BRS</strong> Research and<br />
Information Department<br />
The Research and Information Department maintains<br />
a large data basis and information library which covers all<br />
sectors of activities handled by <strong>BRS</strong>, and is available for<br />
consultation or advice of clients.<br />
This Department handles the information reports, analyses,<br />
studies and statistics covered on the company’s internet site.<br />
It works in co-operation with the brokers in each departments<br />
to meet the needs of clients.<br />
The Research and Information Department also offers its<br />
know-how and the companies’ international network and<br />
expertise available to the shipping world to assist and answer<br />
any queries.<br />
You can reach this service directly<br />
at the following address:<br />
research@brs-paris.com<br />
Or through your broker.
THE<br />
CHEMICAL<br />
CARRIER MARKET<br />
IN<br />
2002<br />
This time last year we gave a fairly positive<br />
assessment as to the development of the<br />
chemical carrier market.<br />
Our analysis highlighted the return of a better<br />
balance in the supply and demand of tonnage, a<br />
general improvement in the financial results of the<br />
main owners and European operators, as well as<br />
the limited drop in freight rates in the fourth quarter<br />
in contradiction to all other shipping sectors.<br />
We ended by questioning the extent of the world<br />
economic slowdown, which started in the spring of<br />
2001 with the recession in the American economy,<br />
hoping for a recovery before the end of 2002.<br />
One year later, we can observe that the stated<br />
facts remain largely unchanged with the exception<br />
of the world economic recovery, which has not<br />
taken place this year and which has been pushed<br />
back to at best the second half of <strong>2003</strong>.<br />
The balance between the tonnage supply and<br />
demand still applies as delivery of new carriers has<br />
been restricted in the course of the past year. At<br />
the same time, the orderbook for chemical carriers<br />
remains at a low level, despite a significant pick-up<br />
in orders in 2002, compared to 2001, which was<br />
particularly poor in this respect.<br />
Freight rates<br />
European movements<br />
During 2001 freight rates increased overall by<br />
some 10 to 20 %, with the European and Transatlantic<br />
trade being at the lower end, and markets<br />
into Asia being at the upper end. In 2002 the market<br />
gave no sign of a trend one way or the other,<br />
and the players in the petrochemical sector went<br />
through the year with the uncertainties surrounding<br />
the eventual recovery in the world economy.<br />
The Chemical Carrier Market in 2002<br />
45
46<br />
dwt<br />
600,000<br />
500,000<br />
400,000<br />
300,000<br />
200,000<br />
100,000<br />
Shipping and Shipbuilding Markets <strong>2003</strong><br />
0<br />
delivered in 2002<br />
The North European market remained at healthy<br />
levels with freight rates improving by about 10 %<br />
at the beginning of the year. Then following a<br />
good volume of contractual nominations, freights<br />
fluctuated around previous levels up until the third<br />
quarter, to finally rise significantly at the end of the<br />
year thanks to a very sustained spot market.<br />
The Mediterranean trade is still divided in two,<br />
based on the age of vessels and the approvals<br />
required by the main charterers. Consequently<br />
there is a two-tiered market, which basically<br />
stayed steady over the whole year.<br />
On the other zones of trade, from the Mediterranean<br />
to North Europe and back, rates had mixed<br />
fortunes. For North Europe the supply of carriers is<br />
becoming progressively reduced, following a fear<br />
by certain owners of tighter controls and multiple<br />
inspections by authorities in the main ports.<br />
Consequently on this traffic, charterers faced a<br />
shortage of supply and variations in freight rates<br />
from 10 to 20 % within two to three months, with<br />
peaks in the spring and the end of the year, whereas<br />
the rest of 2002 was relatively stable.<br />
Spot Mediterranean bound movements remained<br />
at slightly lower levels with the main volume of<br />
business being covered under term contracts.<br />
Renewal of contracts for <strong>2003</strong> were mostly made<br />
at unchanged levels to 2002 or else very similar,<br />
with some obtaining a modest increase of about<br />
5%.<br />
Chemical carriers on order as at January 1, <strong>2003</strong><br />
(in deadweight)<br />
<strong>2003</strong><br />
2004<br />
3,500-6,000 dwt<br />
6,000-10,000 dwt<br />
10,000-20,000 dwt<br />
Over 20,000 dwt<br />
2005<br />
It is necessary to adjust these rates on European<br />
movements as owners pay today for their bunkers<br />
at much higher prices and some are suffering from<br />
the dollar devaluation against the euro as numerous<br />
freight contracts are based in dollars.<br />
Long distance movements<br />
On the U.S. / Europe traffic, the market suddenly<br />
took off at the beginning of March, to peak in<br />
April. Significant movements of styrene and cumene<br />
were fixed by producers and traders following<br />
some technical shutdowns in Europe. As a result<br />
rates for lots of 2,000 tons went from $ 35 to $ 45<br />
per ton. Thereafter freights experienced a steady<br />
drop with rates finding levels as at the end of<br />
2001.<br />
On westbound Atlantic trade, the market firmed<br />
up as from the beginning of the second quarter,<br />
then experienced a peak during the summer with<br />
a falling off down to $ 40 per ton for 2,000 ton<br />
lots, to finally finish the year with a 15 % increase.<br />
The main spot movements out of Europe were with<br />
cargoes of methanol, MTBE and sulphuric acid.<br />
Movements from Europe to Asia were largely term<br />
contracts, with steady volumes in the hands of the<br />
four main chemical owners. Spot freight rates for<br />
1,000 tons of chemical products remained at<br />
about $60 per from the Rotterdam area to main<br />
Asian ports, with the same for 2,000 ton lots,<br />
which increased in the summer and improved progressively<br />
to $ 50 to $ 60 per ton.
number<br />
20<br />
18<br />
16<br />
14<br />
12<br />
10<br />
8<br />
6<br />
4<br />
2<br />
0<br />
delivered in 2002<br />
On a general view point, due to the large number<br />
of term nominations and a well-sustained spot<br />
market for special grades, the level of ships’<br />
employment was good and freight rates were<br />
stable throughout the year.<br />
The fleet<br />
Chemical carrier owners are probably today in a<br />
better situation than a few years ago. The number<br />
of ships available is more or less in line with<br />
demand and only a deterioration of the world economy<br />
is likely to disturb this balance.<br />
In an attempt to modernise and increase their fleet<br />
at minimum risk, some owners have started in the<br />
course of the year 2002 to place orders backed by<br />
time charters for a minimum of 5 to 7 years with<br />
purchase options of the new tonnage to be built<br />
in Japan. Stolt, Jo Tankers, TMM, Tokyo Marine<br />
and Iino Kaiun have signed a number of contracts<br />
with deliveries in <strong>2003</strong> to 2005.<br />
This is a new approach by Western owners, which<br />
have been in the habit of placing orders with European<br />
shipyards. These vessels are less sophisticated<br />
with fewer tanks and segregations, but built to<br />
more attractive financial conditions. More owners<br />
and operators could be interested in the future.<br />
Since the beginning of the year 24 ships totalling<br />
0.4 million dwt have entered into service. The<br />
number of purely chemical carriers (with stainless<br />
steel tanks) on order at the end of 2002 was 71 of<br />
which 21 were below 10,000 dwt and 50 above<br />
Chemical carriers on order as at January 1, <strong>2003</strong><br />
(in number of ships)<br />
<strong>2003</strong><br />
2004<br />
3,500-6,000 dwt<br />
6,000-10,000 dwt<br />
10,000-20,000 dwt<br />
Over 20,000 dwt<br />
this size, for respectively 0.15 million and 1.25 million<br />
dwt. This figure is considerably higher than<br />
the total at the end of 2001, which was 44 ships<br />
totalling 0.97 dwt, but is below the number of<br />
ships on order before the Asian crisis of 1998 with<br />
107 ships and a total of 1.69 million dwt of which<br />
42 were under 10,000 dwt and 65 above as at<br />
end 1997.<br />
Scrapping of chemical carriers was stable in 2002<br />
with a new parameter however, namely an additional<br />
number of large sizes being withdrawn. Last<br />
year there was a total of 8 ships for slightly more<br />
than 59,000 dwt, whereas this year there were 9<br />
ships for a total of 150,000 dwt (of which 4 ships<br />
over 20,000 dwt).<br />
This trend towards scrapping chemical carriers has<br />
been considerably reinforced by charterers insisting<br />
on double-hulls, but also to the arrival of the<br />
various generations of big chemical carriers built in<br />
the mid 70’s and whose characteristics no longer<br />
correspond to today’s needs and criteria.<br />
◆ ◆ ◆<br />
2005<br />
Even more than in previous years, the absence of<br />
any firm trend in the development of the market<br />
has meant that owners have decided to reduce<br />
their costs to a maximum in order to preserve their<br />
margins. Owners are seeking to optimise costs, by<br />
reducing crews and through partnerships on certain<br />
routes. For example Stolt and Jo Tankers have<br />
reached an agreement for a better co-ordination<br />
The Chemical Carrier Market in 2002<br />
47
48<br />
US$/t<br />
70<br />
Shipping and Shipbuilding Markets <strong>2003</strong><br />
60<br />
50<br />
40<br />
30<br />
20<br />
10<br />
0<br />
Jan 98<br />
Mar 98<br />
June 98<br />
Sep 98<br />
Nov 98<br />
Mar 99<br />
of operations on port calls for their vessels leaving<br />
the Gulf of Mexico to Asia, whilst preserving their<br />
commercial independence.<br />
With the same objective of fleet optimisation, the<br />
market is awaiting the decision of the European<br />
Commission on the creation of a commercial pool<br />
between Vopak-Essberger and Stolt Nielsen Inter<br />
Europe Services requested by the two owners now<br />
for more than a year.<br />
In this uncertain climate owners are seeking to<br />
consolidate their positions, whilst trying to obtain<br />
May 99<br />
Chemical tanker spot freight rates<br />
2,000 t easy chemical<br />
Aug 99<br />
Nov 99<br />
Feb 00<br />
Apr 00<br />
July 00<br />
Oct 00<br />
Jan 01<br />
Apr 01<br />
Rotterdam - WC Italy<br />
Rotterdam - USG<br />
Rotterdam - Taïwan<br />
July 01<br />
Sep 01<br />
improvements in productivity. The decreasing<br />
number of small carriers on order and the concentration<br />
of big chemical carriers in the hands of<br />
fewer and fewer operators, are some of the direct<br />
consequences of the sluggish market we have had<br />
for the last three years.<br />
If this new situation looks like lasting longer,<br />
attempts at mergers and buy-outs and the creation<br />
of pools, could in the future be multiplied,<br />
thus limiting the diversity and competitiveness of<br />
the chemical carrier market. ■<br />
Dec 01<br />
Mar 02<br />
June 02<br />
Aug 02<br />
Nov 02
THE<br />
LIQUEFIED<br />
PETROLEUM GAS<br />
SHIPPING MARKET<br />
IN<br />
2002<br />
A fragile confidence in an uncertain market<br />
Significant events<br />
The three successive blows which have contributed<br />
to the slowdown in the major industrial<br />
and financial markets over the last two<br />
years led us to a certain scepticism at the end of<br />
2001. In practice the international economic situation<br />
experienced in quick succession the bursting of<br />
the technological bubble at the end of the second<br />
quarter 2000, then the tragedy of September 11 th<br />
with its multiple geopolitical repercussions, and<br />
finally the fall in the stock markets linked initially to<br />
the Enron affair during the last quarter of 2001.<br />
The confidence required for any growth in the economy<br />
upon which our sector of maritime transport<br />
largely depends had already been seriously shaken.<br />
We then thought that we had had the worst of<br />
the storm behind us and could hope for the start<br />
of a recovery, but if the cyclone left over plenty of<br />
turbulence, other financial scandals came in affecting<br />
the book value of large American companies<br />
during the early months of 2002, fostering a sense<br />
of lack of confidence.<br />
With greater or lesser impact, all segments of our<br />
shipping markets were affected by a spiral of<br />
uncertainty up until mid-year, and it is only as from<br />
the third quarter that an initial shiver of activity<br />
came up.<br />
Within this gloomy climate, a few tendencies can<br />
be observed over the past 12 months :<br />
◆ A global but limited recovery in prices for oil<br />
products and derivatives, following the collapse<br />
seen at the end of 2001, besides a few exceptions<br />
such as ethylene. Here are the prices fluctuations<br />
over the last 2 years:<br />
The Liquefied Petroleum Gas Shipping Market in 2002<br />
49
50<br />
Gaz Millennium<br />
Naftomar's 22,000 cbm<br />
fully refrigerated<br />
LPG carrier delivered<br />
by Hyundai in march 2002.<br />
Shipping and Shipbuilding Markets <strong>2003</strong><br />
Products Nov 2000 Nov 2001 Nov 2002 %<br />
Crude oil, Middle East Gulf ($/bbl) 32 17 24 + 41<br />
Brent crude, North Sea ($/bbl) 33 18 24 + 33<br />
Naphtha cif Rotterdam ($/mt) 303 155 235 + 51<br />
Natural gas ($/mmbtu US Henry Hub) 8.03 (Dec) 2.54 (Dec) 4.25 (Dec) + 67<br />
Propane CP (contr. price fob Saudi Arabia) ($/mt) 345 235 327 + 39<br />
Butane CP (contr. price fob Saudi Arabia) ($/mt) 345 232 327 + 41<br />
Anhydrous ammonia (fob Black Sea) ($/mt) 170 85 127 + 49<br />
Ethylene (contr. price Europe) (e/mt) 705 550 400 - 27<br />
Propylene poly gr (contr. price Europe) (e/mt) 595 405 470 + 16<br />
Butadiene (Europe spot) (e/mt) 610 345 520 + 50<br />
VCM (cif Korea/Taiwan) ($/mt) 560 350 460 + 31<br />
◆ Parallel to this recovery in product prices, the<br />
level of freight rates in the spot and short-term<br />
market experienced a strong downward pressure<br />
during the first half of the year, in the different<br />
ship size categories, with the exception of<br />
the VLGCs which were already at an historical<br />
low at the end of 2001 and were able to benefit<br />
from alternative employment in the naphtha and<br />
clean petroleum product markets. Globally<br />
freight rates remained depressed during the first<br />
half of the year, then began to rise during the<br />
summer, prior firming up more significantly<br />
during the last quarter.<br />
◆ We will stress again that these average rates<br />
exclude any eventual idle time between voyages<br />
and are in no way an indication of owners’ profits<br />
either out of the spot market or from longer term<br />
transactions of 2 years or more.<br />
Ships by size/category (cbm) Nov 2000 Nov 2001 Nov 2002 %<br />
VLGC 75/85,000 cbm spot MEG/Far East ($/mt) 42 16 28 + 75<br />
VLGC 75/85,000 cbm 3 – 6 months t/c ($/mth) 720,000 475,000 600,000 + 26<br />
LGC 52/59,000 cbm 2 – 6 months t/c ($/mth) 775,000 650,000 575,000 - 15<br />
Mid-size 24/35,000 cbm equiv. t/c of spot voyage ($/mth) 625,000 580,000 575,000 - 1<br />
12/22,000 cbm equiv. t/c of spot voyage ($/mth) 475,000 375,000 405,000 + 5<br />
6/11,000 cbm ethyl. Equiv. t/c of spot voyage ($/mth) 375,000 275,000 300,000 + 9<br />
4/8,000 cbm semi ref. 2/3 months t/c or equiv spot ($/mth) 280,000 220,000 225,000 + 2<br />
4/8,000 cbm pressurised 2/3 months t/c or equiv. spot ($/mth) 220,000 175,000 185,000 + 3
◆ The development of voyages concluded around<br />
the arbitrage of LPG prices within loadings out of<br />
Atlantic export zones (North Europe, North Africa,<br />
and West Africa) towards the Far East and the<br />
U.S. These are not steady movements but generally<br />
have the effect of capturing larger capacities<br />
of transport, by the voyage length and by an optimisation<br />
of ships’ sizes (i.e. movements of 20 /<br />
35,000 cbm from North Europe to the Mediterranean<br />
Sea). Less frequently, a few arbitrage movements<br />
were also concluded with ethylene and<br />
propylene out of Asia towards Europe.<br />
◆ A sharp increase of the oldest ships sold for demolition,<br />
as we had anticipated at the end of last year.<br />
This is a crucial balancing factor in the market,<br />
often alluded to these last years but rarely seen in<br />
practice since many years. Maintenance procedures<br />
and a higher degree of reliability of gas carriers<br />
have meant that those ships have been kept<br />
in service much longer than most other tank ships.<br />
The volume of ships which have been demolished<br />
in 2002 has been impressive. At the end of December<br />
2002 a total of 30 units had been sold for scrap<br />
for a total capacity of 782,000 cbm of which 6<br />
VLGC over 66,000 cbm representing a capacity of<br />
434,670 cbm. The average age of these 30 units is<br />
28 years old. Nonetheless we include in these sales<br />
two small ships of 920 cbm which are being<br />
converted and two 12,000 cbm purchased back<br />
from the scrap yard by a Middle East trader.<br />
US$ 1,000 pcm<br />
1,600<br />
1,400<br />
1,200<br />
1,000<br />
800<br />
600<br />
400<br />
200<br />
LPG carrier 24,000 - 85,000 cbm<br />
Short-term T/C or T/C equivalent to spot voyages<br />
Numerous constricting quality standards imposed<br />
by Majors in recent years, even if sometimes smacking<br />
of protectionism, has helped accelerate the<br />
trend towards demolition. The inevitable consequence<br />
of accidents that tankers have suffered in<br />
recent times is affecting the age limit and consequently<br />
the period of active life span of ships. We<br />
should even see this tendency becoming more<br />
accentuated over the next few years, when a<br />
strong rejuvenation of the fleet is expected, mainly<br />
for sizes over 35,000 cbm capacity.<br />
A strong depreciation of ships’ values mainly due<br />
to their lower replacement costs; as the price of<br />
newbuildings for identical or even better performing<br />
carriers has fallen sharply in the last few<br />
years has taken place to reach upto 25 % below<br />
that of earlier years. These depressed valuations<br />
also affect the possibility of capital realisation, be<br />
it for second-hand or scrap sales.<br />
VLGC (Very Large Gas Carriers)<br />
70,000 to 85,000 cbm<br />
Another gloomy year for this sector, despite the limited<br />
contribution of the naphtha and jet fuel markets,<br />
with however a slight improvement during the<br />
second half and more sound result at year’s end.<br />
Whilst spot rates on the reference voyage MEG / Far<br />
East did not exceed $19 / 20 per ton during the first<br />
half – for an average time charter equivalent<br />
(depending on ship’s specifications) of about<br />
$400,000 per month – the time charter rates for a<br />
24-43,000 cbm<br />
52-60,000 cbm<br />
70-85,000 cbm<br />
0<br />
Jan 96 July 96 Jan 97 July 97 Jan 98 July 98 Jan 99 July 99 Jan 00 July 00 Jan 01 July 01 Jan 02 July 02<br />
The Liquefied Petroleum Gas Shipping Market in 2002<br />
51
52<br />
Djanet<br />
84,000 cbm, LPG carrier<br />
blt at Kawasaki H.I.<br />
and delivered to her owners<br />
Sonatrach in october 2000.<br />
US$ 1,000 pcm<br />
800<br />
700<br />
600<br />
500<br />
400<br />
300<br />
200<br />
100<br />
Shipping and Shipbuilding Markets <strong>2003</strong><br />
short period (3 / 6 months) were slightly higher at<br />
$ 450,000 / 500,000 per month. Trading of LPG<br />
remained depressed and the contribution of the<br />
clean petroleum product market was very limited.<br />
The second half of the year was better orientated<br />
with an initial stimulus given by some arbitrage<br />
movements from the North Sea, West and North<br />
Africa to Asia, then a more sustained trend in the<br />
last quarter when spots voyages MEG /Asia rose to<br />
an average level of $ 28 per ton or an equivalent<br />
time charter of $ 675,000 per month.<br />
The next few months remain highly uncertain in<br />
this category of carriers, until the current tonnage<br />
surplus (9 new units due for delivery during<br />
<strong>2003</strong>-2004) can be absorbed by the sale of several<br />
older units for scrapping.<br />
LPG carrier 3,000 - 22,000 cbm<br />
Medium-term T/C (6-18 months)<br />
10-22,000 cbm<br />
6-8,000 cbm Ethylene<br />
3-6,000 cbm<br />
0<br />
Jan 96 July 96 Jan 97 July 97 Jan 98 July 98 Jan 99 July 99 Jan 00 July 00 Jan 01 July 01 Jan 02 July 02<br />
LGC (Large Gas Carriers)<br />
52 000 to 60 000 cbm<br />
The LPG sector movements did not balance for the<br />
reduced demand in ammonia for these sizes. This<br />
tonnage category is in a period of rejuvenation,<br />
between old carriers which are still used in ammonia<br />
shipments, and 7 new units, which should be<br />
delivered between <strong>2003</strong> and 2005.<br />
The most modern units, under time charter or<br />
contract of affreightment, continue to obtain the<br />
best returns in this sector, at a level of around<br />
$725,000 per month, whereas the rest of the fleet,<br />
suffering from extended idle periods, did not reach<br />
more than an average of $ 500 / 550,000 per<br />
month time charter equivalent on the spot market.<br />
Ammonia movements and the optimisation of LPG<br />
cargoes in larger parcels, represent the staple diet<br />
for these vessels but the ammonia market continues<br />
to get more and more regionalised with the<br />
use of smaller sizes, whilst the LPG cargo lots fall<br />
in between two stools – VLGCs sometimes less<br />
flexible by their size and that of 35 / 40,000 cbm<br />
showing better flexibility but at higher cost.<br />
Two ships were sold for scrap in this segment size<br />
against no deliveries in 2002, but seven 59,000<br />
cbm are on order for delivery spread out between<br />
<strong>2003</strong> and 2005 on behalf of Norwegian owners<br />
and Sonatrach.
Midsize carriers<br />
22,000 to 43,000 cbm<br />
As in the past, this sector resisted better to the<br />
global pressure on rates. This obviously does not<br />
take into account any eventual idle time which<br />
several units of 24 / 28,000 cbm suffered in the<br />
first three quarters and representing in the case of<br />
Exmar an annual waiting time percentage of some<br />
17 %.<br />
Renewing of time charters for 6 / 12 months were<br />
concluded at levels below 10 % compared to last<br />
years’, whereas rates for contracts of affreightment<br />
hardly moved.<br />
We should also note the additional capacity of the<br />
22,000 cbm Navigator ships among which those<br />
which were unable to find petrochemical employment<br />
switched quite logically towards butane,<br />
propane and ammonia markets.<br />
There have been 4 ships sold for scrap and delivery<br />
of two 35,000 cbm and two 22,500 cbm during<br />
2002.<br />
Given the greater flexibility of these ships (ammonia<br />
to the Caribbean and inter Asia, LPG in Europe<br />
and the Indian Ocean), the slightly better positioning<br />
of this category size and its age structure, it<br />
would not be surprising to see some owners benefiting<br />
from competitive prices still proposed by<br />
Korean and Japanese shipyards and placing orders<br />
for newbuildings intended to replace the units due<br />
to be scrapped in the coming years.<br />
m. cbm<br />
160,000<br />
140,000<br />
120,000<br />
100,000<br />
80,000<br />
60,000<br />
40,000<br />
20,000<br />
0<br />
1966<br />
1970<br />
1972<br />
1974<br />
World Ethylene carriers fleet at the end of 2002<br />
15 years old<br />
and over<br />
(43.81%)<br />
1977<br />
1979<br />
1981<br />
1983<br />
1985<br />
Semi-refrigerated gas carriers<br />
8,000 to 22,000 cbm<br />
With the long-awaited recovery in petrochemicals<br />
not yet occurring, these ships again suffered severely<br />
in securing full employment throughout the<br />
first two quarters, and did not succeed to shake<br />
off the lethargy they faced at the start of the year.<br />
As in the other sectors, the situation improved<br />
slightly during the third quarter with a relative<br />
recovery, assisted by some cross-continental movements<br />
of ethylene and propylene and an increased<br />
demand in the LPG market out of North Europe<br />
and the Mediterranean.<br />
Fleets committed to some contracts of affreightment<br />
were less affected than ships employed in<br />
the spot market, among which some were on the<br />
point of being laid-up.<br />
Average returns for spot voyages (on time charter<br />
equivalent) were hovering between $375/425,000<br />
for the larger segment size and about $300,000<br />
for the smaller size, with a slight premium for ethylene<br />
carriers when employed in ethylene traffic.<br />
These levels however were able to firm up towards<br />
the end of the year to reach over $ 500,000 for<br />
15 / 22,000 cbm carriers and more than $ 375,000<br />
for the 8 / 12,000 cbm sizes.<br />
There was again the usual development of propylene<br />
and ethylene movements, built up around<br />
plants shutdowns due to programmed or accidental<br />
maintenance, sometimes to the benefit of shipping<br />
with the realisation of additional voyages outside<br />
traditional routes.<br />
1987<br />
1989<br />
1991<br />
Less than<br />
15 years old<br />
(56.19%)<br />
1993<br />
1995<br />
1998<br />
2000<br />
2002<br />
On<br />
order<br />
(13.69%)<br />
2004<br />
The Liquefied Petroleum Gas Shipping Market in 2002<br />
53
54<br />
Kappagas<br />
5,600 cbm,<br />
latest semi-refrigerated<br />
newbuilding unit<br />
delivered to Sloman Neptun<br />
in july 2001 to enter<br />
the Unigas Pool fleet.<br />
Three new ethylene carriers of 8,200 / 8,500 cbm<br />
were delivered in the course of the year (two for<br />
Schulte / Unigas and one for Norgas) from Chinese<br />
shipyards, and one 8,700 cbm semi-pressurised Japanese-built<br />
ship (fixed on long term basis to Geogas).<br />
Eight new ethylene carriers of 8,500 / 10,200 cbm<br />
are under construction due for delivery in <strong>2003</strong> for<br />
the account of Italian, German, and Norwegian<br />
owners, but these units should soon replace a<br />
series of 7 ships of 6 / 8,000 cbm over 25 years old<br />
due to be phased out in the coming years.<br />
Gas carriers of 8,000 cbm and less<br />
The size range up to 8,000 cbm, a limit introduced<br />
several years ago, is no longer as clear a cut as it<br />
was, since several pressurised newbuildings with a<br />
capacity of 8,000 to 11,000 cbm have been ordered<br />
out of which some already delivered from Japanese<br />
shipyards.<br />
US$/ton<br />
80<br />
Shipping and Shipbuilding Markets <strong>2003</strong><br />
70<br />
60<br />
50<br />
40<br />
30<br />
20<br />
10<br />
LPG freight rates (spot voyages)<br />
VLGC and 2,500/5,000 cbm<br />
These new pressurised carriers, although dedicated<br />
mainly for LPG trade, have a considerable<br />
impact on the smaller size units and consequently<br />
we have included them in this category.<br />
This sector, split between petrochemical and LPG<br />
employment, has been under strong pressure throughout<br />
the year with results often lower than the<br />
already depressed numbers registered last year. The<br />
average results in the spot rates or for short term<br />
periods were between $ 140,000 and $ 240,000<br />
time charter equivalent depending on size and type<br />
of vessel (4,000 to 8,000 cbm pressurised, semipressurised,<br />
refrigerated, or ethylene carriers).<br />
At those floor levels, a number of sales and mergers<br />
were finalised. Tarquin International decided<br />
to lower its flag and sell its fleet, divided between<br />
Lauritzen Kosan for four 4,400 / 6,300 cbm, and<br />
the 7 other ships of 4,000 / 8,600 cbm to members<br />
of the Unigas Pool. Lauritzen Kosan and<br />
Exmar joined forces to operate their respective<br />
fleets of pressurised ships of 3,200 / 6,500 cbm<br />
capacity in Asia, whilst a Greek owner new to the<br />
gas market, Tsakos, has joined forces with Lauritzen<br />
Kosan on 4 units of 4,400 to 6,300 cbm already<br />
belonging to the latter.<br />
As with the other size category of ships, the market<br />
picked up marginally during the last quarter<br />
and <strong>2003</strong> should begin under better auspices than<br />
January 2002 with fewer new units due to be delivered<br />
in the course of the coming months.<br />
VLGC: MEG/Japan<br />
Small vessels 2,500-5,000 cbm<br />
European coasting<br />
0<br />
Jan 96 July 96 Jan 97 July 97 Jan 98 July 98 Jan 99 July 99 Jan 00 July 00 Jan 01 July 01 Jan 02 July 02
number<br />
20<br />
18<br />
16<br />
14<br />
12<br />
10<br />
8<br />
6<br />
4<br />
2<br />
0<br />
Eleven vessels were sold for scrap (of which 2 for<br />
conversion) against 14 newbuilding delivered<br />
during 2002 with 9 other orders due for delivery<br />
over the period <strong>2003</strong>-2004.<br />
Perceptions<br />
Taking all categories into consideration and averaging<br />
together the variations particular to the different<br />
size sectors, the LPG market is very near<br />
bottom levels of operating seen over the last two<br />
years. Absorbing the economic shocks seen<br />
recently is proving more difficult than predicted.<br />
The industry is also facing increased running costs.<br />
<strong>2003</strong> should witness a substantial increase in insurance<br />
cover premiums (some talk of more than<br />
30 % !), higher bunker prices for ships working<br />
the spot market and contracts, and higher costs<br />
for improvement in quality, becoming more and<br />
more restrictive but necessary in order to insure<br />
the optimal employment required by all actors.<br />
LPG carriers deliveries 2002 & orderbook<br />
FH 2002 SH 2002 FH <strong>2003</strong> SH <strong>2003</strong> FH 2004 SH 2004<br />
We have at last seen an increase in the number<br />
of carriers sold for scrap in 2002. A<br />
total of 30 ships for about 782,000 cbm:<br />
◆ 6 VLGC and two ships of 52,000 cbm,<br />
◆ 5 ships between 20,000 and 50,000 cbm,<br />
◆ 5 ships of 12,000 cbm,<br />
◆ 8 ships of 2,000 – 7,000 cbm,<br />
◆ 3 ships less than 2,000 cbm.<br />
LPG second-hand market<br />
3-11,000 cbm<br />
20-60,000 cbm<br />
> 75,000 cbm<br />
FH 2005<br />
More bad news in an already difficult context,<br />
without mentioning the depreciation of the dollar.<br />
What is the solution?<br />
Even taking into account a probable improvement in<br />
the economic situation, which is always subject to<br />
major geopolitical disturbances or mini crisis (war or<br />
other attempts to control natural resources, etc.) one<br />
of the key factor for restoring a better balance in the<br />
market remains the level of tonnage availability.<br />
Efforts made by shipowners at combining or joining<br />
forces together are most welcomed, when<br />
same are resulting in a better optimisation of ships<br />
employment, but they do nothing to correct the<br />
imbalance created by the surplus capacity.<br />
In this respect the year 2002 can be considered a<br />
turning point due to the volume of sales for scrapping,<br />
much awaited but finally committed to in<br />
2002, faced with an orderbook that has never<br />
been so close to the sole replacement of the fleet.<br />
Let us hope that this trend will continue without<br />
major disturbances over the next few years. ■<br />
This is not very surprising if one sees that the average<br />
age of ships going for scrap was nearly 30<br />
years old. But it is quite possible if low freight rates<br />
combined with high running costs and low newbuilding<br />
costs persist, that LPG owners will come<br />
into line with owners of other types of ships for<br />
which the average scrapping age is 25 years.<br />
Nonetheless these figures remain significantly<br />
below the number of ships delivered in 2002 or<br />
The Liquefied Petroleum Gas Shipping Market in 2002<br />
55
56<br />
Philippine<br />
French flag 3,000 cbm<br />
built 1995 belonging<br />
to the Geogas group and<br />
supplying LPG to Corsica<br />
under a long term time<br />
charter contract with<br />
Gaz de France, Butagaz<br />
and Antargaz.<br />
Shipping and Shipbuilding Markets <strong>2003</strong><br />
due to join the fleet in <strong>2003</strong>. Three VLGCs were<br />
added in 2002 and 7 more are due in <strong>2003</strong>. Four<br />
units of 60,000 cbm and 2 of 35,000 cbm will be<br />
delivered in <strong>2003</strong>, adding to 4 of 20,000 – 35,000<br />
cbm already delivered in 2002.<br />
Carriers over 50,000 cbm<br />
Six VLGC and 2 units of 52,000 cbm went to the<br />
scrapyards. The only sale for further trading in<br />
2002 was the ‘Co-op Sunrise’ of 77,000 cbm, built<br />
in 1987, bought by Bergesen for service in his<br />
pool, at a price close to $ 27 million. Outside this<br />
sale, only the oldest units were put on the market<br />
and they only found interest for demolition.<br />
There still remain 28 ships over 25 years old and<br />
20 over 20 years which should, at least for the first<br />
category, make them candidates for scrapping<br />
when they submit to a technical inspection.<br />
Carriers between 20,000 – 50,000 cbm<br />
2002 began with the sale of ‘Sombeke’, 33,000<br />
cbm, built 1990, for about $ 31 million and ended<br />
with the sale of ‘Zeebrugge’, 24,000 cbm, built<br />
1984, for $ 16 million against a three year charter<br />
back.<br />
These prices can be considered strong in comparison<br />
to the building costs of such carriers. But the<br />
concentrated ownership of this type of ship<br />
among a reduced number of players, and the<br />
absence of alternatives other than newbuilding,<br />
coupled with good freight rates meant that healthy<br />
levels were maintained.<br />
Carriers between 9,000 – 20,000 cbm<br />
Outside sales for scrapping, no others were made<br />
in this category.<br />
Carriers less than 9,000 cbm<br />
Pressurised ships of 3,000 – 3,500 cbm suffered a<br />
further drop in value of about 10 % compared to<br />
the previous year. We can cite the following sales:<br />
◆ ‘Golden Crux n° 15’, 3,500 cbm built in 1991,<br />
sold for $ 4 million<br />
◆ ‘Isle Fortune’, 3,500 cbm built 1996, sold for<br />
$ 5.9 million<br />
◆ ‘Regulus Gas’, 3,500 cbm built 1998, sold for<br />
$ 6.6 million<br />
◆ ‘Gas Rosario’, 3,500 cbm built in 1995, sold for<br />
$ 5.1 million<br />
◆ ‘Cotswold’ and ‘Snowdon’, 3,200 cbm, built<br />
1989, sold for $ 3.4 million apiece, with one year’s<br />
employment attached<br />
In the “semi-refrigerated” carrier category, the big<br />
event of the year was without doubt the consolidation<br />
of the market following the return of 11<br />
carriers belonging to the owner Tarquin to the<br />
control of Unigas, following a block sale for about<br />
$ 158 million to members of the pool : Sloman<br />
Neptun and Bernard Schulte each bought a 7,200<br />
cbm built in 1997 and a 8,600 cbm built 1998,<br />
whilst Othello took a 8,600 cbm and a 6,300 cbm<br />
built 1999, as well as an ethylene carrier of 4,000<br />
cbm built in 1988. As regards the smaller units,<br />
two 6,300 cbm built in 1999, a 5,600 cbm built in<br />
1994, and a 4,400 cbm built in 1992 were resold<br />
for about $53 million to Lauritzen Kosan who,<br />
shortly afterwards, created a joint-holding 50 / 50<br />
with Greek owner Tsakos to manage these carriers.<br />
For carriers over 20 years, 2002 passed with buyers<br />
only offering prices close to scrap values. Only the<br />
‘Ledagas’, 5,100 cbm built in 1984, managed to<br />
hit the jackpot in getting a price near $ 5.5 million,<br />
as her technical characteristics made her the only<br />
candidate acceptable for her Greek buyer.<br />
◆◆◆<br />
The conclusion, valid for all size carriers, is that the<br />
future does not indicate a return to the good old<br />
times, when the technical life span of a LPG carrier<br />
(30 years or more) corresponded to the commercial<br />
life span. The commercial and financial conditions<br />
in force in the oil industry will more and more<br />
be imposed as a reference to the LPG market. ■
THE<br />
LIQUEFIED<br />
NATU<strong>RA</strong>L GAS<br />
SHIPPING MARKET<br />
IN<br />
2002<br />
ended more or less as it ended in 2001<br />
2002with a major U.S. energy player in difficult<br />
financial circumstances. The previous year closed<br />
with the demise of Enron and El Paso would appear<br />
to be repeating the show this year, although with<br />
nowhere near the same implications. Last year in this<br />
report we mentioned “déjà vu” with reference to El<br />
Paso, who have now chartered-in five new Daewoo<br />
ships from Exmar / MOL. However, we were not to<br />
know how far our “déjà vu” statement would<br />
stretch, as El Paso have again fallen foul to a general<br />
malaise within the energy companies in the U.S..<br />
Their U.S. gas pipeline operations may survive, but it<br />
looks increasingly as if they may fall out of LNG again.<br />
Apart from the now familiar U.S. energy company<br />
problems, Williams, CMS. Reliance… the LNG market<br />
in 2002 has seen both a shortage of cargoes and<br />
ships. Whilst most activity over recent years has<br />
focused on the U.S. market absorbing all of the surplus<br />
available cargoes recent Asian activity has seen<br />
the balance shift back eastwards. The Japanese<br />
demand increased in the last quarter due to nuclear<br />
safety concerns causing the shutdown of 7 Tepco<br />
nuclear plants. Korean winter demand also saw a<br />
market request for up to a further 36 cargoes. These<br />
two events led to all of the producers trying to<br />
increase their output to meet this demand from<br />
their traditional customers.<br />
Unfortunately, this Tepco demand coincided with<br />
some plant shutdowns at Das Island alongwith<br />
some turbine problems on the Abu Dhabi fleet that<br />
was restricting schedules. Cargoes previously sold<br />
on a short term basis to European buyers were then<br />
re-directed towards the east where higher prices<br />
were achieved. Most recently we have even seen<br />
cargoes sold from Algeria to Kogas: Sigtto’s LNG Log<br />
for 2002 should prove interesting reading!<br />
And if the LNG shipping market was not tight<br />
enough, a U.S. submarine decided to raise its<br />
periscope into the double-bottom of the ‘Norman<br />
Lady’ necessitating her withdrawal from<br />
service for repairs.<br />
The Liquefied Natural Gas Shipping Market in 2002<br />
57
58<br />
Number of vessels<br />
220<br />
200<br />
180<br />
160<br />
140<br />
120<br />
100<br />
1965<br />
1967<br />
Shipping and Shipbuilding Markets <strong>2003</strong><br />
80<br />
60<br />
40<br />
20<br />
0<br />
1969<br />
LNG Shipping Solutions<br />
1971<br />
1973<br />
1975<br />
The fleet<br />
In 2002, the LNG fleet has increased to 137, and by<br />
the end of the year there was an additional 56<br />
ships on order!<br />
Small capacities from 18,000 to 50,000 cbm 16 ships<br />
Medium capacities from 51,000 to 100,000 cbm 15 ships<br />
Large capacities above 100,000 cbm 106 ships<br />
Vessel size has been slow to increase but 2002 did<br />
see the market considering the use of large 200,000<br />
cbm ships for the longer haul dedicated routes that<br />
are planned. Depending upon how the shipyards<br />
price these new large units there could be transportation<br />
costs savings in the region of 10-15%.<br />
Membrane technology continues to lead the orderbooks<br />
with 64 % of the vessels on order featuring<br />
Existing LNG fleet by containtment system<br />
Worms/Gaz de France<br />
IHI SPB Prismatic<br />
Esso<br />
TGZ<br />
LNG vessel fleet development - 1965-2006<br />
1977<br />
1979<br />
GT<br />
Moss<br />
1981<br />
1983<br />
1985<br />
1987<br />
1989<br />
1991<br />
1993<br />
1995<br />
the GTT membrane. A new type of membrane system<br />
was added to the GTT portfolio when Gaz de<br />
France ordered the first CS1 vessel. The CS1 offers<br />
increased cargo capacity without increasing the<br />
external dimensions of the ship.<br />
In addition there are a further 56 ships on order, or<br />
some 40 % increase, a truly remarkable statistic!<br />
The spate of speculative orders that prevailed in<br />
2000 does not seem to be repeated with all new<br />
orders being placed against firm contracts. What<br />
does seem to be changing however is the duration<br />
of the charters. Two of the Snohvit charters that<br />
were confirmed earlier this year have 12 and 8-year<br />
commitments and the recent GdF tender has asked<br />
for a possible 12-year charter period. This reduction<br />
from the typical 20 year charter would suggest<br />
Daewoo SME<br />
Mitsubishi H.I.<br />
LNG Shipping Solutions LNG Shipping Solutions<br />
1997<br />
1999<br />
2001<br />
<strong>2003</strong><br />
LNG vessels on order - by shipyard<br />
Hyundai H.I.<br />
Samsung S.B.<br />
Kawasaki H.I.<br />
Izar<br />
2005<br />
Mitsui Shipbuilding<br />
Chantiers de l'Atlantique
Number of vessels<br />
60<br />
50<br />
40<br />
30<br />
20<br />
10<br />
0<br />
LNG Shipping Solutions<br />
0-5 years 6-10 years 11-15 years 16-20 years 21-25 years 26-30 years<br />
a reflection in matching the charter period to that<br />
of the sales contract and/or careful attention by<br />
charterers to their balance sheets.<br />
The age of the LNG fleet is also causing concern to<br />
some LNG members especially in the light of the<br />
major pollution incidents involving old tankers :<br />
notably the ‘Erika’ and the ‘Prestige’. Both of these<br />
ships were carrying fuel oil cargoes, fuel typically<br />
used in power generation, and synergies with the<br />
LNG market should not be ignored. Fuel oil is a<br />
competing fuel to the emerging gas-fired power<br />
generators and fuel oil is one of the elements in<br />
most LNG pricing formulae. Any change in the circumstances<br />
surrounding the fuel oil cost will impact<br />
on LNG pricing, but phasing out of old fuel oil carriers<br />
may see a similar phase out of old LNG carriers,<br />
despite the industry’s excellent safety record<br />
Newbuildings by containtment system<br />
Gaz Transport Membrane<br />
Kværner Moss<br />
LNG Shipping Solutions<br />
Technigaz Membrane<br />
CS1<br />
LNG fleet age profile as at 2007<br />
> 30 years<br />
It should not be forgotten that all LNG carriers<br />
today use fuel oil as bunkers to supplement the<br />
boil-off gas in powering the vessels. So whilst the<br />
LNG cargo is eco-friendly the bunker fuel is not.<br />
The risk of pollution still exists on the LNG vessels,<br />
not necessarily from marine accidents (collision<br />
with tugs for example) but during the more routine<br />
operation of bunkering from barges in what are<br />
typically sensitive areas.<br />
The oldest LNG ships is the ‘Cinderella’, built 1964,<br />
that was initially sold for scrap but somehow escaped<br />
some 14 years ago, and the ‘Hoegh Galleon’,<br />
built 1974, was also sold for scrap but re-emerged<br />
with a new life after the tanks were repaired, are two<br />
examples of aged vessels that are lucky to still trade<br />
LNG today. However, these two vessels trade extensively<br />
into Spain, a country that is currently closely<br />
looking at the age of tonnage in its territorial waters.<br />
New developments<br />
Gaz de France broke the traditional mould in 2002<br />
when the first diesel-electric propulsion ship was<br />
ordered from Chantiers de l’Atlantique. This 74,000<br />
cbm vessel is due for delivery in end 2004. However,<br />
not only was a new propulsion system selected, a<br />
new type of membrane containment system will<br />
also be used. This CS1 system, a hybrid of the two<br />
existing membrane technologies GT96 and TGZIII,<br />
offers significant cost savings for the builder and<br />
optimises cargo capacity for the owner / charterer.<br />
In light of the diesel-electric order there has been a<br />
surge in interest expressed in what is alternative<br />
The Liquefied Natural Gas Shipping Market in 2002<br />
59
60<br />
USD million<br />
300<br />
250<br />
200<br />
150<br />
100<br />
50<br />
0<br />
1972<br />
1973<br />
1974<br />
1975<br />
LNG<br />
VLCC<br />
1976<br />
LNG Shipping Solutions<br />
Shipping and Shipbuilding Markets <strong>2003</strong><br />
1977<br />
1978<br />
1979<br />
propulsion to the steam turbines. This is partly due<br />
to the change in the LNG trade, where the emergence<br />
of a spot market demands the maximum<br />
amount of cargo is delivered to the customer (not<br />
usually the case in the traditional annual delivery<br />
concept) but also the recent troubles associated<br />
with gearboxes on some recently built turbine ships.<br />
Gas turbine manufacturers have also turned their<br />
attention to LNG in the wake of a downturn in aircraft<br />
orders. Once thought extremely expensive it<br />
would now appear that market conditions have<br />
seen a more sensible approach to pricing.<br />
Ship prices<br />
Whilst LNG newbuilding prices had generally been<br />
on the increase, but nowhere near the previous<br />
highs, the competitive market would seem to have<br />
returned with yards, especially the Korean shipyards,<br />
seeking new LNG orders. There are at present<br />
two tenders for new tonnage on the market<br />
and it will be interesting to see at what level the<br />
bids are set.<br />
The graph shows the trend of pricing, with a comparison<br />
to VLCC prices, over recent years<br />
The yards are in general seeking orders for all shipping<br />
and those that specialise in LNG also build other<br />
types of ships. However, those orders are also drying<br />
up but a knee-jerk reaction in the aftermath of the<br />
‘Prestige’ could see this change. A recently reported<br />
price war between two Korean yards seeking to<br />
secure an order for containerships could see this<br />
translate into the LNG market. There are already<br />
1980<br />
1981<br />
1982<br />
Newbuilding prices - 1972-2002<br />
1983<br />
1984<br />
1985<br />
1986<br />
1987<br />
1988<br />
1989<br />
1990<br />
1991<br />
1992<br />
1993<br />
1994<br />
rumours of prices falling to the level set some three<br />
years ago when the Spanish orders were placed.<br />
1995<br />
Will the E.U. relaxation on yard subsidies increase<br />
price competition? Will inventive tax incentives<br />
continue within Europe? If the answers to these<br />
questions are yes, then ships prices will remain low<br />
for the foreseeable future.<br />
The projects<br />
New projects<br />
The Norwegian project, Snohvit, finally received the<br />
final go ahead but not without opposition. Between<br />
the EU Council in Brussels and the environmentalists<br />
in Norway the pressure was very much against the<br />
project. However, in the end common sense prevailed<br />
and the project was eventually given the “green<br />
light” in June. Some of the project partners were<br />
also instrumental in changing the future of LNG<br />
when TotalFinaElf and GdF elected to take their<br />
equity gas as fob cargoes using their own ships.<br />
Angola did not make the progress anticipated, but<br />
although no progress was made in 2002 there<br />
should be some good news by the end of <strong>2003</strong>.<br />
There has been a recent development in the Angola<br />
LNG project that may see an advance in the<br />
start-up date. Whilst the project was restructured<br />
earlier in the year with a new partnership agreement<br />
following the end of the civil war (which<br />
enabled a change in site location at least) and the<br />
Chevron / Texaco merger, that resulted in some slip<br />
in the original schedule, the Angolan government<br />
is taking a stand. They have slowed the pace of<br />
1996<br />
1997<br />
1998<br />
1999<br />
2000<br />
2001<br />
2002
approvals for deep-water oil projects to synchronise<br />
with a 2007 launch of the LNG project, which<br />
could be interpreted as no LNG, no oil ! The real<br />
concern in Angola is the reduction of gas flaring<br />
which at present stands at about 85 % of its gas,<br />
and any increase in oil production would naturally<br />
increase the flaring. Political sensitivities could also<br />
be influential where the United-States are looking<br />
for diversification away from the dependency on<br />
the Middle East and thus investment in the African<br />
continent may be a necessity of Washington rather<br />
than the oil companies.<br />
There is continued discussions on Iran LNG from<br />
the South Pars field, but given continued threat of<br />
hostilities in that region there will be continued<br />
uncertainty on this project. Furthermore investment<br />
in “green field sites” is always the most difficult<br />
aspect of a project when the long-term buyers<br />
are no longer there. The main competition for Iran<br />
is the existing LNG operations in Qatar which<br />
appear to have the ability to expand at very short<br />
notice. The infrastructure at Ras Laffan will always<br />
give Qatar a commercial lead against a new project<br />
that will be stretched for capital investment.<br />
The same problems exist in Yemen as for Iran,<br />
except that the threat of terrorism is more real in<br />
that region. LNG projects require huge investment<br />
and financial institutions will always assess the risk<br />
to their investment, always choosing the least risk.<br />
Thus allocating funds to Qatar or Oman expansions,<br />
for example, is always easier than start-up<br />
projects in sensitive political arenas.<br />
Egypt is finally realising the ambition of being an<br />
important LNG player with the final agreement for<br />
its second LNG project. GdF signed an agreement<br />
to purchase the entire output from the first train of<br />
the BG led consortium and now BG is actively<br />
pushing for expansion of the second train, which is<br />
now expected in early 2006.<br />
There is however greater emphasis on African projects,<br />
apart from Angola and Nigeria LNG, as the<br />
USA seeks non-Arab sourced hydrocarbons. There<br />
is at least one more Nigerian project at the planning<br />
stage and another in Equatorial Guinea.<br />
Both of these projects will be seeking the “Americas”<br />
market.<br />
Expansion projects<br />
The main activity in the increase in LNG production<br />
capacity involves expansion schemes in existing<br />
LNG plants. We have seen Nigeria LNG, Atlantic<br />
LNG, Qatargas and RasGas, Australia LNG and<br />
MLNG all develop expansion schemes.<br />
Financing is always the key to a successful project<br />
and that typically requires firm long term contracts<br />
from gas buyers. Unfortunately, some of the new<br />
gas buyers are not in a position to guarantee their<br />
off-take quantities, Dabhol and Petronet in India<br />
being prime examples, and so new projects seeking<br />
similar markets struggle to attract finance, unlike<br />
those existing plants who already have significant<br />
cash flows.<br />
U.S. market<br />
The US market remains the biggest potential target<br />
for future LNG growth. Domestic supply of<br />
gas is diminishing whilst long term demand, from<br />
Fernando Tapias<br />
140,500 cbm, blt 2002<br />
by Daewoo, owned by<br />
Naviera F. Tapias.<br />
The Liquefied Natural Gas Shipping Market in 2002<br />
61
62<br />
Shipping and Shipbuilding Markets <strong>2003</strong><br />
the power sector, continues to grow. With only<br />
four existing terminals there is a finite capacity of<br />
about 16 million tonnes with a further 12.3 million<br />
tonnes expansion planned, and all on the<br />
East coast.<br />
There are several projects for new terminals in the<br />
Baha peninsula of Mexico plus two for the Gulf of<br />
Mexico but now there is the likelihood of a new<br />
terminal in northern California, a concept many<br />
thought impossible not long ago. The regional<br />
demand is highest in California but the slim prospect<br />
of siting a terminal there caused the rush for<br />
the Baha peninsula. However, it now seems that<br />
reality has beaten off unjustified fear and the move<br />
is on to build a Californian terminal. We should<br />
know more on this by the end of <strong>2003</strong>.<br />
The Bahamas is another favoured location to site a<br />
receiving terminal, Tractebel having bought the old<br />
Enron site in the West, with El Paso holding onto<br />
its proposed site, in the East, for the moment. The<br />
advantage of the Bahamas is the proximity to the<br />
Florida market.<br />
Despite new security measures having been introduced<br />
to the Boston harbour where Tractebel’s<br />
Everett terminal is located, LNG is expected to<br />
continue to be imported into the New England<br />
area. Whether this would continue should Irvine’s<br />
new proposed terminal for Nova Scotia get approval<br />
is still unknown. The continued threats of terrorist<br />
attacks hold a cloud over the continuance of<br />
the Everett terminal, which is close to Boston city<br />
centre and at the end of Logan Airport runway.<br />
Not that LNG offers any greater danger to the city<br />
compared to LPG, oil or chemical carriers.<br />
The long-awaited re-opening of the Cove Point terminal<br />
should occur in the third quarter of <strong>2003</strong>.<br />
New owners, Dominion Energy, having acquired<br />
the terminal from Williams, have three customers<br />
BP, Shell and the new user Statoil who recently purchased<br />
El Paso’s capacity at this terminal, along<br />
with its SPA from Snohvit.<br />
With the forecast for U.S. gas prices around the<br />
$4.00 per mmbtu, the U.S. market should continue<br />
to be the stimulus for many LNG projects and if the<br />
West coast terminals come into existence then the<br />
Asian producers should also become involved in<br />
this market, rather than just the Middle East and<br />
African producers.<br />
There would also seem to be the prospect of more<br />
new terminals on the East coast of the U.S. with<br />
Federal Energy Regulatory Commission (FERC)<br />
apparently relaxing the tight reins on approval of<br />
new sites.<br />
Other developments<br />
We have previously referred to the fleet age profile,<br />
old-ship disasters and the arrival of alternative<br />
propulsion. Larger size vessels, of up to 200,000<br />
cbm, are under consideration by ExxonMobil and<br />
TotalFinaElf for their new proposed long-haul trades<br />
from Qatar whilst 145,000 cbm would appear to be<br />
the optimum size for new orders today. The<br />
145,000 cbm size is more or less the maximum size<br />
acceptable to all existing terminals and as flexibility<br />
is very much the key focus on modern LNG trade<br />
any increase in this size is not expected in the near<br />
future, unless the new CS1 containment system<br />
gains wider use. The main advantage of the CS1 is<br />
the increase in cargo capacity for no change in<br />
external dimensions of the vessel.<br />
As for the age profile, we would seriously question<br />
the industry’s love affair with old tonnage when<br />
the rest of the shipping industry is looking carefully<br />
at the age of ships. Furthermore, with increased<br />
efficiency of the modern tonnage and the possibility<br />
of wider use of electric propulsion coupled with<br />
relatively low new ship prices, the case for fleet<br />
renewal should be given wider consideration.<br />
Summary<br />
LNG shipping will continue to grab headlines in the<br />
near future, hopefully for good reasons rather than<br />
adverse incidents such as the ‘Norman Lady’ accident<br />
with a U.S. submarine. The fleet size is growing<br />
at a rate previously unheard of and with 137<br />
active and 56 on order the magical figure of 200<br />
ships should be reached by 2007. As the new chosen<br />
preferred fuel for the future, the growth in<br />
LNG trade should continue and with it the LNG<br />
shipping industry.<br />
Evolution cannot be ignored and for LNG this will be<br />
shorter charter periods, more flexible trading routes<br />
with less “tram-line” operations. There should be<br />
progression towards alternative propulsion away<br />
from the very high fuel consumption represented by<br />
steam turbines, and this may be hastened after the<br />
delivery of the Gaz de France 74,000 cbm in 2 years<br />
time that will be fitted with a diesel-electric engine.<br />
It will be worth noting the pioneer’s effect this new<br />
technology will have on the market.<br />
New ship prices are expected to remain about the<br />
present level and stay there for the future with the<br />
anticipated arrival of the Chinese yards entering<br />
the “club” in 2006. It should not be forgotten that<br />
it was the emergence of the new “members” in<br />
Korea that assisted in the fall of LNG prices in the<br />
mid’90’s. ■
LNG SHIPPING<br />
SOLUTIONS<br />
LNG Shipping Solutions<br />
propose a range of specific services<br />
on LNG transport by sea.<br />
As a result of the combined LNG activities<br />
of two major international brokers*,<br />
LNG Shipping Solution advises<br />
its clients on chartering, sales and<br />
purchases, newbuildings,<br />
shipmanagement, and all commercial<br />
aspects of LNG trade.<br />
Contacts:<br />
LNG SHIPPING<br />
SOLUTIONS<br />
LNG Shipping Solution is also<br />
able to offer its services on project<br />
management, specific analysis by sectors<br />
for financial institutions or any other<br />
intermediary, wishing to have additional<br />
information on up-to-date dynamics<br />
within the LNG sector.<br />
Tel.: 44 207 283 11 37 - Fax: 44 207 283 11 52 - Email: lng@lngship.net<br />
* LNG Shipping Solutions is a joint company<br />
Barry Rogliano Salles - Clarkson<br />
The Liquefied Natural Gas Shipping Market in 2002 63
64<br />
Shipping and Shipbuilding Markets <strong>2003</strong><br />
The <strong>BRS</strong> Web site<br />
www.brs-paris.com<br />
<strong>BRS</strong> offers a web site with regular updated information<br />
on international maritime transportation.<br />
In addition to the numerous pages with free access,<br />
<strong>BRS</strong> has available for clients<br />
PAGES WITH FREE ACCESS:<br />
data and on line services<br />
• Group profile<br />
adapted to their specific<br />
• Contacts for each department<br />
needs.<br />
• Annual review<br />
• Newsletters:<br />
– Weekly: dry cargo, crude oil and petroleum products<br />
– Monthly: liner shipping, LPG, sale and purchase<br />
PAGES WITH PRIVATE ACCESS:<br />
• A daily press report<br />
• Statistics (freights, prices, orderbooks…)<br />
• Weekly analyses<br />
• Specific studies
THE<br />
DRY BULK<br />
MARKET<br />
IN<br />
2002<br />
The dry bulk shipping market finished the<br />
year 2002 taking all sizes into account at<br />
levels that had not been seen since the end<br />
of 2000, at a time when the overall economic<br />
conditions were far more favourable. At the beginning<br />
of the year nothing indicated such a sprightly<br />
resurgence, and few analysts would have stuck<br />
their necks out to predict freight rates around<br />
$25,000 per day for modern Capesizes. As in<br />
other sectors of the shipping market, everyone<br />
was betting on a recovery of the American economy,<br />
and in its wake that of countries in the European<br />
Union, occurring during the course of the<br />
second half of 2002. This was by no means the<br />
case, and the uncertainties linked to the American<br />
intervention and their allies in Iraq, more than ever<br />
casts a pall over the world economy and the confidence<br />
necessary for a rebound. Japan is for its part<br />
still stuck in its quagmire which has been going on<br />
for several years.<br />
Towards a brighter horizon?<br />
The factors that have contributed to the rise in<br />
freight rates during the year, mainly with effect<br />
from September, are essentially:<br />
◆ a significant increase in raw materials into China,<br />
Japan and other South East Asian countries; whilst<br />
total world growth has been flat the exception is<br />
China which registers annual increases in GNP of<br />
the order of 7,5 %.<br />
◆ a decrease in the number of newbuildings<br />
coming onto the market compared to previous<br />
years, at least as concerns the Capesizes and Panamaxes.<br />
◆ a steady increase in the cost of bunkers, which<br />
was caused initially by the policy of reducing OPEC<br />
production, and secondly by the fear of conflict in<br />
the Gulf.<br />
◆ at the end of the year, shutdown for maintenance<br />
of some Japanese nuclear power stations, resulting<br />
in a sizeable increase of steam coal imports.<br />
<strong>BRS</strong> - The Dry Bulk Market in 2002<br />
65
66<br />
Dwt<br />
70,000,000<br />
60,000,000<br />
50,000,000<br />
40,000,000<br />
30,000,000<br />
20,000,000<br />
10,000,000<br />
<strong>BRS</strong> - Shipping and Shipbuilding Markets <strong>2003</strong><br />
0<br />
Handymax<br />
Panamax<br />
Capesize<br />
Dry bulk carriers fleet over 40,000 dwt by age class - end 2002<br />
25 years and over 20 to 24 years 15 to 19 years 10 to 14 years 5 to 9 years Under 5 years<br />
We will attempt a rapid tour of the main events in<br />
the dry bulk market over the course of the past 12<br />
months. For reference, the Baltic Dry index which<br />
began the year at 876 points ended at 1739, the<br />
highest level since November 2000.<br />
Based on the statistics published by IISI at the end<br />
of January <strong>2003</strong>, world crude steel production has<br />
totalled slightly over 900 million tons in 2002, an<br />
increase of 6,4 % over 2001. The lion’s share of<br />
this rise is due to China producing 181 million<br />
US$/ton<br />
18<br />
16<br />
14<br />
12<br />
10<br />
8<br />
6<br />
4<br />
2<br />
0<br />
Jan 00<br />
Mar 00<br />
June 00<br />
Source : Baltic Exchange - <strong>BRS</strong><br />
Sep 00<br />
Dec 00<br />
Dry Cargo freight rates - Capesize<br />
Mar 01<br />
May 01<br />
On order<br />
tons, compared to 150 million in 2001, or an<br />
increase of 20,3 %. For comparison, in 1995 Chinese<br />
steel production was 95 million tons and was<br />
below that of Japan’s 101 million tons. In 2002,<br />
Japanese production reached 107 million, an<br />
increase of 4,7 % compared to 2001, an impressive<br />
achievement if we consider the lethargy of the<br />
Japanese economy. Production in the E.U. only<br />
increased by 0,1 %, and to illustrate the contrasting<br />
situations, French production increased by<br />
5,6 %, whereas Germany was only able to come<br />
Aug 01<br />
Capesize Iron Ore Tubarao / Fos 145,000 t<br />
Capesize Coal Newcastle / Rotterdam 140,000 t<br />
Nov 01<br />
Feb 02<br />
May 02<br />
July 02<br />
Oct 02
up with a modest rise of 0,4 %. The restrictive<br />
measures taken by the U.S. seem to be taking<br />
effect since after months of declining production,<br />
American steel figures for 2002 finished with an<br />
increase of 2,5 % over 2001 with 92 million tons.<br />
Japanese and Korean steel producers who fed the<br />
Chinese market throughout the year, helped alleviate<br />
the American and European markets, thus<br />
allowing steel prices to find their levels of the first<br />
quarter 2000 after two years of decline. With steel<br />
production being the driving force of the Capesize<br />
market, the higher production levels were<br />
bound to have an influence on freight rates.<br />
The healthy standing of the Capesize market was<br />
partly due to the growth in Chinese imports of iron<br />
ore. Based on provisional figures these should<br />
exceed 110 million tons in 2002, 20 million more<br />
than in 2001. In addition, the share of Chinese<br />
imports coming from Brazil should represent<br />
27,1 % of the 2002 total, compared to 17,3 % in<br />
1998, thereby stretching the ton/miles. If this trend<br />
continues, in a short time Chinese imports of iron<br />
ore will surpass that of the E.U. and of Japan. Still<br />
in the realm of raw materials, Japan was obliged to<br />
import nearly 6 million tons of additional steam<br />
coal over the period September 2002 to April<br />
<strong>2003</strong>, following the shutdown of 9 nuclear power<br />
stations out of a total of 18, run by Tokyo Electric<br />
Co. which helped to sustain the Panamax market<br />
in the Pacific during the fourth quarter. In the case<br />
of cereals, Australia suffered one of its worst<br />
droughts in history and its crop was halved, thus<br />
redirecting imports from the South East Asian<br />
US$/ton<br />
30<br />
25<br />
20<br />
15<br />
10<br />
5<br />
0<br />
Jan 00<br />
Mar 00<br />
June 00<br />
Source : Baltic Exchange - <strong>BRS</strong><br />
Sep 00<br />
Dec 00<br />
Dry Cargo freight rates - Panamax<br />
Mar 01<br />
May 01<br />
countries. Grain trade according to the International<br />
Grain Council should remain stable for the<br />
2002-<strong>2003</strong> season around 207 million tons.<br />
In the industrial sector new mergers were formed in<br />
2002. In Japan, NKK and Kawasaki Steel united<br />
forces in a new entity, JFE Steel, which initiates the<br />
first merger in the steel industry in the country and<br />
follows the example within the European scene<br />
which underwent a profound restructuring two years<br />
earlier. The combined production of the two companies<br />
totals some 28 million tons. At the same time,<br />
NSC, Sumitomo Metals and Kobe Steel have entered<br />
negotiations in view of getting together. And still<br />
within the steel sector, US Steel made a proposal to<br />
take over National Steel for $750 million but as yet<br />
unconfirmed. Also to be noted is the intended acquisition<br />
of the aluminium division of Corus by Pechiney.<br />
Finally, at the end of the year, the IMO against the<br />
better judgement of certain countries, decided to<br />
impose double-hulls on vessels over 150 meters for<br />
all newbuildings. This ruling still has to be ratified<br />
within the context of the SOLAS convention by<br />
January 2004 at the latest. Certain owners having<br />
anticipated this decision, placed orders for doublehulled<br />
ships already during the course of the 2002.<br />
Parallel to the increase in freight rates over the year,<br />
one should not forget the rise in bunker prices. The<br />
price of IFO 380 cst went from $100 per ton in<br />
January, basis delivery Rotterdam, to over $150 per<br />
ton in December, which corresponds for a Capesize<br />
to an increase of 50 cents on an average freight<br />
rate of $ 8,15 on a voyage Brasil – Rotterdam.<br />
Aug 01<br />
Panamax Grain US Gulf / Japan - 54,000 t<br />
Panamax Coal Richards Bay / Le Havre - 70,000 t<br />
Nov 01<br />
Feb 02<br />
May 02<br />
July 02<br />
Oct 02<br />
<strong>BRS</strong> - The Dry Bulk Market in 2002<br />
67
Lake Biwa<br />
53,505 dwt, blt 2002<br />
by Iwagi (Imabari group),<br />
owned by Misuga Kaiun (Japan)<br />
and on long term time<br />
charter to Louis Dreyfus<br />
Armateurs (France).<br />
68<br />
<strong>BRS</strong> - Shipping and Shipbuilding Markets <strong>2003</strong><br />
Capesize<br />
To appreciate the movement of freight increases in the<br />
Atlantic we can cite a few examples. On the iron ore<br />
route from Brazil to China, rates went from $6 ton in<br />
January to $7,50 on average from March to August,<br />
to finish the year at $13,50. Transatlantic cargoes took<br />
off from $4 at the beginning of the year to fix at over<br />
$8 twelve months later. This hike was also repeated<br />
within the coal market out of South Africa. At the start<br />
of 2002, cargoes were fixed to North Europe at under<br />
$5 per ton, to achieve $8 at the end of September,<br />
and finish the year at above $10. In the Pacific, there<br />
was a similar phenomenon despite the fact that the<br />
Atlantic market benefited with a premium over the<br />
Pacific basin. Freights on the iron ore route from Australia<br />
to China doubled between January and December.<br />
Backhaul routes however suffered from the drop<br />
in liftings of minerals from Australia to Europe. This<br />
strong rise in rates was even more pronounced on the<br />
time-charter market. Modern large ships, fixed for<br />
fronthaul trips with delivery Rotterdam to the Far East<br />
via Brazil were achieving $8,000 in January and ended<br />
the year above $26,000. Modern ships of<br />
170,000dwt chartered for 12 months witnessed their<br />
rates reach over $18,000 at the end of the year, some<br />
$7,000 more than they could expect in January 2002.<br />
The Capesize fleet has remained relatively stable and<br />
delivery of new tonnage was limited in 2002. Twenty-five<br />
ships for 4 million dwt were delivered, against<br />
34 in 2001, whereas 17 ships were scrapped (of<br />
which 8 were combined carriers). In <strong>2003</strong> additions<br />
to the fleet will stay limited, despite a small growth,<br />
due to the fact that there were very few major<br />
orders during the period 2000-2001. Thirty-two<br />
additional ships, for 5 million dwt, should come into<br />
service in the course of this year. However the sudden<br />
upsurge in freight rates during the second half<br />
of last year, linked to low construction costs, and the<br />
availability of early slots in certain Japanese shipyards,<br />
plus the creation of new building docks in<br />
China has contributed to a flood of orders to be<br />
delivered as from 2004. No less than 50 ships have<br />
been ordered in 2002, including several big carriers<br />
of 200,000dwt for Japanese account.<br />
In 2001 in line with large tanker owners, some of the<br />
principal players in the Capesize market have created<br />
the pool Cape International which combined some<br />
80 ships. This unit had its difficulties in getting formed,<br />
since in October 2002 Zodiac who had the biggest<br />
contribution to the pool decided to withdraw.<br />
Elsewhere, the Capesize and Panamax fleet of two<br />
other major players in the dry bulk scene Coeclerici<br />
and Ceres Hellenic joined forces. At the end of the<br />
year the Belgian Cobelfret strengthened its position<br />
within the Capesize market by acquiring the 50 %<br />
held by BHP-Billiton in its affiliate Cobam.<br />
Panamax<br />
The Panamax market began the year 2002 at<br />
depressed levels. Inter-zone rates for modern ships<br />
did not surpass $5,500-6,000 per day. The spread<br />
between the two basins, Atlantic and Pacific, have<br />
progressively widened. All newbuildings were delivered<br />
into the Pacific area, and the reduction of
$/day<br />
19,000<br />
18,000<br />
17,000<br />
16,000<br />
15,000<br />
14,000<br />
13,000<br />
12,000<br />
11,000<br />
10,000<br />
9,000<br />
8,000<br />
7,000<br />
6,000<br />
5,000<br />
Jan 00 July 00 Jan 01 July 01 Jan 02 July 02 Jan 03<br />
voyage times (ton/miles), quickly repositioning these<br />
ships into their original area of operation, weighed<br />
heavily on freight levels. As with the Capesizes,<br />
levels from the Atlantic to the Pacific rose during<br />
the first three quarters, with modern vessels obtaining<br />
daily returns rising from about $ 7,500 in<br />
January to nearly $13,000 end December. This<br />
situation lasted until the beginning of the fourth<br />
quarter when volumes of coal coming out of China<br />
primarily for Japanese destination helped push rates<br />
even higher. At the end of the year however the<br />
Pacific market went along with its alter ego in the<br />
Atlantic. Backhaul rates stayed low throughout the<br />
year, with owners having tonnage in the zone being<br />
prepared to make sacrifices in order to return to the<br />
more advantageous Atlantic.<br />
As with the Capesize fleet, the number of Panamaxes<br />
delivered in 2002 was down compared to the previous<br />
year. Fifty-five ships for 4,1 million dwt entered<br />
service, as against 116 in 2001. This drop in deliveries<br />
will be even more marked in <strong>2003</strong>, as only 26 new<br />
ships for less than 2 million dwt, will come out of the<br />
Asian shipyards. For the same reasons as with the<br />
Capes, orders burgeoned during the second half,<br />
mainly with the Japanese yards and to a lesser extent<br />
with the Chinese. As a result, 76 orders were placed<br />
in 2002, with deliveries being spread out over 2004<br />
and 2005. Scrappings remained modest, with only 29<br />
units of which 4 combined ships removed from the<br />
fleet. Finally a new type of Panamax should be noted,<br />
the Kamsarmax, its name being derived from a port<br />
in Guinea and developed by the Japanese shipyard<br />
Tsuneishi, with a deadweight of 82,000 (length of<br />
229 meters, width of 32,26 meters, draught of 14,35<br />
Average time-charter rates for bulk carriers<br />
Modern Handymax - 3/5 months t/c (del./redel. Pacific)<br />
Modern Panamax - 12 months t/c<br />
Modern Capesize - 12 months t/c<br />
meters) and capacity of 97,000cbm and of which<br />
seven units have been ordered.<br />
Handymax/Handysize<br />
The bulk carrier market of Handymax and Handysize<br />
offers a more contrasted picture. On the one<br />
hand, the Pacific market has suffered for a long<br />
time from the high level of newbuildings being<br />
delivered, since on average nearly 3 ships per<br />
week have been coming onto the market in 2002.<br />
Conversely the Atlantic market has been well supported<br />
mainly with traffic to the Far East. Important<br />
volumes of steel, fertilisers, and cereals leaving<br />
the Black Sea, the Mediterranean and North<br />
Europe helped sustain freight rates for a good part<br />
of the year. Consequently large, modern Handymaxes<br />
have been able to obtain rates reaching up<br />
to $14,000 per day for voyages to the Far East.<br />
Satisfactory levels were seen throughout the year,<br />
with levels never falling below $10,000 per day<br />
after April. As with the Panamax, Handymax<br />
owners not wishing to go off into the Pacific zone<br />
at any price, were able to get premiums on these<br />
destinations. At the start of the year the Atlantic<br />
market was hesitant, with the grain trade out of<br />
South America being slow to get off the mark. For<br />
ships between 43 – 45,000 dwt, daily returns for<br />
inter-Atlantic business averaged at $8,500 per day,<br />
the lowest being in January at below $7,000 per<br />
day, and the highest in December at around<br />
$10,000 per day. The Indian Ocean and the<br />
Middle East Gulf zones also benefited from a<br />
generally favourable market due to traffic into<br />
India or China. The Pacific market remained<br />
<strong>BRS</strong> - The Dry Bulk Market in 2002<br />
69
Bulk carrier<br />
loading manganese.<br />
depressed for the first three quarters of 2002, with<br />
levels for inter-zone voyages rarely going over<br />
$ 6,000 per day. During the last quarter freight<br />
rates firmed up steadily to the point of reaching<br />
Atlantic levels right at the end of the year.<br />
Handysize ships traditionally enjoy a less volatile<br />
market and started the year below $6,000 per day<br />
for short periods reached levels near $7,000<br />
during the last quarter. The Handysize fleet is old<br />
and should therefore diminish progressively over<br />
the coming years, and with no new units coming<br />
in to replace those leaving the fleet bringing about<br />
changes mainly in the sugar and fertiliser trade.<br />
The decrease in deliveries of Handymax and Handysizes<br />
in 2002 compared to 2001 had less of an<br />
affect on the large size of dry bulk carriers, but the<br />
persistent flow of nearly 3 ships per week coming<br />
out of the Asian yards put continuous pressure on<br />
the Pacific market. 148 ships for 6,2 million dwt<br />
came into service compared to 155 the previous<br />
year. With the same causes producing the same<br />
effects, orders were extremely high in 2002.<br />
About 160 new contracts were signed with confirmation<br />
this year of the attraction for Super Handymaxes,<br />
ships over 50,000 dwt, for which an<br />
increasing number was ordered with Japanese and<br />
Chinese shipyards. Against these deliveries, there<br />
was an offset of 123 old units which went to<br />
scrap. But contrary to the Capesize and Panamax,<br />
the volume of deliveries will continue to be felt in<br />
<strong>2003</strong> since nearly 130 ships should be delivered.<br />
The new year’s prospects are similar to those at the<br />
end of 2002. Iron ore and coal volumes are on an<br />
upward trend. Moreover, concerning the Capesize<br />
and above all Panamaxes, new deliveries will be<br />
very restricted in <strong>2003</strong>, giving a welcomed respite<br />
for owners. Two uncertainties remain however :<br />
during the course of the year will the hopes of a<br />
world economic revival, repeatedly delayed, give<br />
an additional stimulus to the dry bulk movements?<br />
Will China, the driving force in the dry bulk market,<br />
continue to charge ahead at full speed and for<br />
how long? The American military intervention in<br />
Iraq, even of short duration, will put back this<br />
recovery and would bring about repercussions<br />
which nobody can precisely foresee.<br />
The future is always right!<br />
The Capesize second-hand<br />
market (80,000 dwt and over)<br />
Following as always the freight market with a certain<br />
variation both in time as well as intensity, the<br />
second-hand Capesize market globally tracked the<br />
drop in the last months of 2001 before picking up<br />
at the beginning of 2002.<br />
This increase continued until March / April. Prices<br />
then remained stable before firming up significantly<br />
again as from September. The year finished<br />
on a very strong upbeat.<br />
70 <strong>BRS</strong> - Shipping and Shipbuilding Markets <strong>2003</strong>
We have noted some 36 sales for further trading (17<br />
comprising ships delivered between 1990 and 2002,<br />
and 19 Capesize built between 1981 and 1989).<br />
Nine ships built between 1971 and 1982 were scrapped<br />
this year, roughly 1.14 million dwt, whereas 26<br />
ships were delivered amounting to 4.25 million dwt.<br />
Owners lured by a modest orderbook (about 9.3%<br />
of the existing fleet at the end of 2001), reasonable<br />
prices for construction and historically low<br />
dollar interest rates, were unable to resist the<br />
temptation to order on a massive scale.<br />
There have been about fifty firm orders placed in<br />
the course of the year 2002, for a total capacity of<br />
8.5 million dwt, figures which are worth comparing<br />
with the 20 orders of 2001 representing a<br />
total tonnage of 3.37 million dwt.<br />
The strong rise in freight rates during the last quarter<br />
has however benefited primarily to secondhand<br />
ships available on a prompt basis.<br />
Based on construction in a good shipyard, fully<br />
classed and in good condition, the following prices<br />
apply:<br />
January 2002 December 2002<br />
150 000 dwt about about<br />
built in 1990 $ 14 / 14.25 m $ 17.25 / 17.5 m<br />
150 000 dwt about about<br />
built in 1995 $ 18.5 / 19 m $ 24.5 m<br />
There are some encouraging signs at the end of<br />
2002 and optimism is in the air, even if some of<br />
uncertainties cloud the market, such as the collateral<br />
effects of the war in Iraq, new regulations<br />
being studied for the introduction of double-hulls<br />
for bulk carriers, etc.<br />
One should also not forget that the tonnage on<br />
order has to be absorbed by the market. In <strong>2003</strong>,<br />
there will be some 5.0 million dwt added, followed<br />
by a further 6.4 million dwt in 2004 and with the<br />
firm orders recorded so far, over 2.0 million for 2005.<br />
The Panamax, Handymax<br />
& Handysize bulk carriers<br />
second-hand market<br />
Predicting what the future may bring can be dangerous,<br />
whereas if a prediction proves to be correct<br />
then whoever was bold enough to make it,<br />
can but refer to it.<br />
In our last year’s annual review covering these sizes we<br />
were of the opinion that “values had bottomed out”<br />
and that anyone interested in investing in these sizes<br />
should be inspecting and offering as soon as possible<br />
as we felt that in the near future prices would increase.<br />
In the case of Panamax and Handymax size we<br />
were in fact cautioning prospective buyers of a possible<br />
“stampede”, which would in turn cause prices to<br />
climb faster and without any real logic.<br />
It seems that this is what more or less happened.<br />
Freight rates were rather stable for the first part of<br />
the year but the feeling that prices had reached<br />
the bottom fuelled competition amongst prospective<br />
buyers resulting in higher prices than the last<br />
comparable sales. Then as soon as buyers started<br />
to cool down the freight markets started to firmup<br />
resulting in very good chartering returns for dry<br />
bulk owners, which was the perfect reason for any<br />
potential buyer to go out hunting again.<br />
Prices across the board increased about 10 / 15 %<br />
within a few months, whereas the overall price<br />
increase at the end of 2002 reached a very healthy<br />
25% and in some cases has exceeded 30% when<br />
compared to the beginning of 2002 / end of 2001.<br />
Once this trend was firmly established in buyer’s<br />
minds, it caused a flurry of activity in the sale & purchase<br />
market.<br />
A total of about 330 ships reportedly changed<br />
hands during 2002, this is about double the number<br />
of ships when compared to 2001. A 100 %<br />
increase in the number of transactions.<br />
Looking closer at the three size segments, we<br />
note that when compared to the previous year<br />
there was an increase in the reported number of<br />
sales as follows:<br />
◆ 75 % more Panamax sales<br />
(2002: 70 ships / 2001: 40 ships),<br />
◆ 144 % more Handymax sales<br />
(2002: 117 ships / 2001: 48 ships),<br />
◆ 86 % more Handysize sales<br />
(2002: 143 ships / 2001: 77 ships).<br />
It would seem that the Greek shipping community<br />
was quick to realise this trend and actively participated<br />
in purchasing vessels thus keeping the leading<br />
role amongst the buyers of second-hand bulk<br />
tonnage. Greek buyers bought about 165 vessels<br />
representing about 50 % of the reported sales in<br />
the three size categories under consideration.<br />
Favourite amongst the Greek buyers proved to be<br />
the Panamax size for which they picked up about<br />
64 % of the ships sold during the year, the Handymax<br />
category coming second with about 58 % of<br />
all transactions reported to Greek buyers, leaving<br />
the Handysize in the third place but with a respectable<br />
35 % of the sales being reported to Greeks.<br />
Chinese buyers were always present especially in<br />
the Handymax and Handysize segments the latter<br />
being their favourite “hunting ground”.<br />
<strong>BRS</strong> - The Dry Bulk Market in 2002<br />
71
72<br />
<strong>BRS</strong> - Shipping and Shipbuilding Markets <strong>2003</strong><br />
Korean buyers where more active than in the past<br />
few years, especially in the latter part of 2002 going<br />
after ships in all three categories, although early<br />
1980’s built Panamax and Handymax ships seemed<br />
to have been what they were most keen on.<br />
As one would expect when looking at sales for<br />
demolition, the number of ships reported sold for<br />
recycling during 2002 is significantly less than<br />
those sold during the previous year.<br />
◆ Panamax: about 0.9 million dwt was removed<br />
this year, 13 vessels, representing a decrease of<br />
about 60 % over 2001 figures.<br />
◆ Handymax: about 0.86 million dwt was removed<br />
during 2002, 20 vessels, representing a<br />
decrease of about 24 % over 2001 figures.<br />
◆ Handysize: about 2.12 million dwt were removed<br />
this year, 78 vessels, representing a decrease<br />
of about 15 % over 2001 figures.<br />
Less ships going for recycling resulted in a sharp<br />
increase of prices obtained per light ton displacement<br />
from buyers of such tonnage which at the<br />
end of 2002 for a bulk carrier stands at about US$<br />
170-175 per ton.<br />
Panamax<br />
A total of 70 ships were reported sold during 2002<br />
and among these:<br />
◆ 1 ship was built in 1977 - she was sold for further<br />
trading to Indian buyers,<br />
◆ 49 ships were built in the 1980’s (70 % of the<br />
reported sales), of which 14 were over 20 years old,<br />
28 were 15-20 years old, 7 were 10-15 years old,<br />
◆ 19 ships were built in the 1990’s (27 % of the<br />
reported sales), of which 14 were less than 10<br />
years old,<br />
◆ 1 vessel was built in 2000 – she was sold to<br />
Greek buyers.<br />
At the end of 2002 a 10 years old Panamax bulk<br />
carrier worth about US$ 11.75 / 12.0 million,<br />
representing an increase of about 30 / 33 % over<br />
a period of 12 months, a 5 years old Panamax bulk<br />
carrier worth about US$ 17.0 / 17.25 million,<br />
which represents about 28 % appreciation when<br />
compared to the value one year earlier in December<br />
2001.<br />
Handymax<br />
A total of 117 ships were reported sold during<br />
2002 and among these:<br />
◆ 11 ships were built in the 1970’s (about 9.5 %<br />
of the total Handymax sales), the oldest being a<br />
1976-built vessel sold for further trading to Turkish<br />
buyers,<br />
◆ 67 ships were built in the 1980’s (about 57 % of<br />
the total Handymax sales),<br />
– 3 ships were over 20 years old,<br />
– 59 ships were 15-20 years old,<br />
– 5 ships were built 1988-1989,<br />
◆ 35 ships were built in the 90’s (about 30 % of<br />
the total Handymax sales),<br />
– 27 ships were 5-10 years old,<br />
– 8 ships were 5 years old or younger,<br />
◆ 4 ships were built in 2000 representing about<br />
3.5 % of the total Handymax sales.<br />
At the end of 2002 a 10 years old Handymax bulk<br />
carrier worth about US$ 10.5 / 11.0 million, representing<br />
an increase of about 20 / 22 % over a period<br />
of 12 months, a 5 years old Handymax bulk<br />
carrier worth about US$ 14.25 / 14.5 million<br />
which represents a 16 % appreciation when compared<br />
to one year earlier in December 2001.<br />
Handysize<br />
A total of 143 ships were reported sold during<br />
2002 and among these:<br />
◆ 28 ships were built in the 1970’s (about 19.6 %<br />
of the total Handy sales),<br />
◆ 86 ships were built in the 1980’s (about 60 % of<br />
the total Handy sales),<br />
– 26 ships were over 20 years old,<br />
– 55 ships were 15-20 years old,<br />
– 5 ships were built 1988-1989,<br />
◆ 28 ships were built in the 1990’s (about 19.6 %<br />
of the total Handy sales),<br />
– 3 ships were over 10 years old,<br />
– 18 ships were 5-10 years old,<br />
– 7 ships were 5 years old or younger,<br />
◆ 1 ship built in 2001 was sold to Cuban interests.<br />
At the end of 2002 a 10 years old Handy bulk carrier<br />
worth about US$ 8.0 / 8.25 million, representing<br />
an increase of about 15 % over a period of 12<br />
months, a 5 years old Handy bulk carrier worth<br />
about US$ 11.25 million, which represents a 7 %<br />
appreciation when compared to one year earlier in<br />
December 2001.<br />
◆ ◆ ◆<br />
Concluding this review of the second-hand Panamax,<br />
Handymax and Handysize bulk carrier market<br />
and looking ahead, a lot will obviously depend on<br />
which way the freight markets will be heading for,<br />
but at the end of the year the feeling is that the<br />
dry bulk market maintains it’s momentum and this<br />
should be felt on vessels’ prices.<br />
We would therefore expect values to remain firm<br />
with a slight upward trend over the next few<br />
months. ■
Market<br />
Cargoes<br />
Advancing with shipping professionals<br />
A quality of information you won’t find anywhere else...<br />
Vessel Descriptions<br />
Market intelligence<br />
• Information management<br />
• News and market indexes<br />
• Distance table<br />
• Converters and calculators<br />
Fixtures<br />
Report<br />
Everything you need... at your fingertips<br />
Find the best decision-making tools at:<br />
Tonnage<br />
Chartering & Postfixing<br />
• Online negotiation<br />
• Document editing<br />
• Message management<br />
• Report generation<br />
• Statistical tools<br />
Contact us :<br />
Calculator<br />
tc/voyage<br />
Port Library<br />
Freight derivatives<br />
• Market information<br />
• Trends analysis<br />
• Risk management tools<br />
www.axsmarine.com<br />
Paris CyberVillage - 204 rue de Crimée - 75019 Paris<br />
Office: +33 (0)1 55 26 42 10 - Fax: +33 (0)1 55 26 42 11 - E.mail: axsmarine@axsmarine.com<br />
73
74<br />
ALPHALINER®<br />
Shipping and Shipbuilding Markets <strong>2003</strong><br />
Alphaliner is an on-line information service<br />
on liner shipping markets.<br />
Interactive checking of: ships, owners and<br />
operators as well as services and alliances.<br />
Publication of a monthly newsletter classified<br />
by ship’s size and geographical zones<br />
which is tailored to individual user’s needs.<br />
Daily update of new deliveries, ships on<br />
order and demolitions.<br />
An interactive classification of the top 100<br />
liner operators world-wide.<br />
A detailed analysis on a particular aspect of<br />
the liner shipping sector each month.<br />
Annual subscription for the combined site is e 3,400.<br />
Numerous pages are freely available.<br />
www.alphaliner.com<br />
The data base holds currently:<br />
• over 1200 services<br />
• over 9000 ships<br />
• over 300 operators<br />
Alphaliner is a Barry Rogliano Salles trademark.
THE<br />
CONTAINERSHIP<br />
MARKET<br />
IN<br />
2002<br />
The year 2002 can be summed up as a year of<br />
convalescence, after the 2001 traumas, while<br />
<strong>2003</strong> is hopefully to see full health recovered<br />
– at least in the absence of any unpredictable event.<br />
Indeed, 2002 has been also a transitional year on<br />
another front, as new, stringent rules on container<br />
content monitoring and cargo manifests have been<br />
elaborated by the U.S. administration to prevent<br />
unwanted weapons entering the U.S. The year<br />
<strong>2003</strong> will see these rules coming into force.<br />
Fleet as at 1 st January <strong>2003</strong><br />
During the implementation phase, hiccups will surely<br />
occur, resulting in ship delays. Carriers said that<br />
they will have to pass the costs of these measures<br />
onto shippers, although it is not yet clear if it will<br />
be through rate increases or through a “U.S. cargo<br />
manifest” surcharge.<br />
2002 has been a mixed year, with varying fortunes<br />
witnessed by operators. Some of them expected<br />
to close the year with comfortable profits while<br />
others are deep in the red.<br />
Cellular Box non-cellular<br />
Size range no teu progr. no teu progr.<br />
> 5,000 teu 207 1,254,175 27.4 %<br />
4,000 / 4,999 teu 223 973,341 19.9 %<br />
3,000 / 3,999 teu 249 851,109 2.0 %<br />
2,000 / 2,999 teu 484 1,197,732 7.4 %<br />
1,500 / 1,999 teu 400 672,155 4.4 % 25 44,841 47.6 %<br />
1,000 / 1,499 teu 489 583,419 0.0 % 108 123,741 4.2 %<br />
500 / 999 teu 568 403,994 2.3 % 343 227,499 5.7 %<br />
100 / 499 teu 424 132,509 -1.7 % 1,509 361,582 5.5 %<br />
Source : <strong>BRS</strong>-Alphaliner<br />
Total 3,044 6,068,434 10.3% 1,985 757,663 7.1 %<br />
The Containership Market in 2002<br />
75
76<br />
Shipping and Shipbuilding Markets <strong>2003</strong><br />
Cellular ships : Deliveries / Orders - Year 2002<br />
Charter rates for containerships have increased by<br />
around 75 % on average since the January 2002<br />
lows. At least the rise lasted until November, when<br />
the winter season and its lower volumes of cargoes<br />
started to take effect.<br />
Rates eased slightly during the last weeks of 2002,<br />
but were expected to rise again in the first quarter<br />
of <strong>2003</strong>. Relatively strong rates can be anticipated<br />
for the next summer season, boosted by traditional<br />
high seasonal volumes and a well-balanced supply<br />
/ demand ratio.<br />
The larger the ship, the more volatile the rates. This<br />
is well illustrated by the fluctuation in rates for<br />
modern 3,500 teu ships, which plunged from $ 25<br />
/ 26,000 in the Summer 2000 to $10,000 in January<br />
2002. They have recovered month after month<br />
in the first part of 2002 to stagnate around<br />
$ 17,500 in the second part of the year. Meanwhile,<br />
rates for 1,100 teu ships went down from<br />
$ 9,500 (summer 2000) to $ 5,250 (January 2002),<br />
and $ 7,000 / 7,500 during the last quarter 2002.<br />
Having plunged under the $ 6,000 mark in January<br />
2002, the rates for 1,700 teu ships -such as the<br />
B-170s- have risen to reach $ 9,500 in October<br />
2002 before easing just under $ 9,000 at the year<br />
end. There is some way to go before flirting again<br />
with the $15,000 figure of the summer 2000.<br />
The fleet of cellular ships over 1,000 teu identified<br />
as idle (not including those which underwent routine<br />
general repairs) has decreased from 160,000 /<br />
Deliveries Orders<br />
Size range no teu $ M no teu $ M<br />
> 6,000 evp 26 174,940 1 775 12 89,600 836<br />
5,500 / 5,999 evp 11 62,058 633 12 68,588 634<br />
5,000 / 5,499 evp 6 32,661 366 13 66,392 663<br />
4,500 / 4,999 evp 8 38,247 405 8 37,840 352<br />
4,000 / 4,499 evp 29 123,173 1,339 4 16,882 168<br />
3,500 / 3,999 evp 1 3,739 40<br />
3,000 / 3,499 evp 6 19,340 220 2 6,000 60<br />
2,500 / 2,999 evp 23 60,600 715 15 38,664 540<br />
2,000 / 2,499 evp 20 48,099 610 6 14,868 204<br />
1,750 / 1,999 evp 2 3,600 45<br />
1,500 / 1,749 evp 19 31,694 490 2 3,480 42<br />
1,250 / 1,499 evp<br />
1,000 / 1,249 evp 22 24,693 406 6 17,472 92<br />
750 / 999 evp 11 9,762<br />
500 / 749 evp 19 13,255<br />
Source : <strong>BRS</strong>-Alphaliner<br />
Total 201 642,261 3,885 82 363,386 3,636<br />
180,000 teu during the first four months of 2002<br />
to around 60,000 teu during the summer. Is was<br />
expected to increase slightly after the summer season,<br />
but it did not, thanks to the lock-out in the<br />
USWC ports, which has prolonged artificially the<br />
demand for 1,000 to 2,500 teu ships in order to<br />
scoop up the boxes left in Asia by delayed mainline<br />
ships. At the beginning of <strong>2003</strong>, the idle fleet<br />
stood at 65,000 teu. Interestingly, there were no<br />
large ships identified as mothballed. The situation<br />
is indeed very different from one year ago.<br />
Industrial production is rising again in most south<br />
east Asian countries while the export boom in<br />
China seems endless. As this region of the world<br />
generates high containerised cargo volumes, it<br />
governs the supply/demand balance in container<br />
transportation more than other regions.<br />
In 2001, the world seaborne trade contracted by<br />
1%. It is now growing again. After a period of stalling<br />
during the winter 2001-2002, the demand in<br />
container transportation has, surprisingly, recovered<br />
above all expectations. The volume of containers carried<br />
at sea is expected to grow by 7 or 8% in <strong>2003</strong>,<br />
in line with growth rates observed in the 1990s.<br />
The demand in container transportation may even<br />
surpass these figures. The cellular fleet has risen by<br />
10.8 % per annum over the past 7 years. The way<br />
the market has absorbed this extra capacity is remarkable.<br />
So, with an expected cellular fleet growth of<br />
“only” 7.5 % per annum for the years <strong>2003</strong> and<br />
2004, the market will be on the owners side.
Another factor which may have a strong impact on<br />
rates is the trend of East Asian-U.S. cargoes shifting<br />
from the U.S. West Coast ports to the U.S. East<br />
Coast, to the detriment of rail “landbridges”. The<br />
Panamax ships of 4,000+ teu are much sought<br />
after for the Far East-USEC services that have to<br />
transit the Panama Canal.<br />
The longer transportation distance means that<br />
eight or nine ships are needed on such services instead<br />
of five or six for the Far East-USWC option.<br />
Assuming that, say, four new Far East-USEC routes<br />
are launched, it means that a dozen supplementary<br />
Panamax ships are needed. This can be sufficient<br />
to create a shortage of such ships, and could<br />
send the charter rates soaring for 4,000 teu ships.<br />
Fleet growth versus demand<br />
The fleet growth is expected to match the rise in<br />
demand, at least during the years <strong>2003</strong> and 2004.<br />
A tight market may well even develop if the 10 to<br />
11 % growth in containership demand observed<br />
since the mid-1990s is to continue.<br />
This spectacular growth rate of the cellular fleet<br />
will not be repeated in the two years to come. It<br />
will hover around 7.5 % (see accompanying table).<br />
This will lead to a fleet of 7 million teu in January<br />
2005, up from 6 million teu in January <strong>2003</strong> and<br />
3 million teu in January 1996.<br />
In fact, to keep up with the average yearly increases<br />
of 7 % in the seaborne container trade observed<br />
during the past decade, the cellular fleet should<br />
have grown from 3 million teu in 1996 to 4.8 million<br />
teu in early <strong>2003</strong> (notwithstanding the increase in<br />
average ship speed and box handling productivity).<br />
The dwindling breakbulk services<br />
So, the extra 1.2 million teu of on board capacity<br />
added to reach the 6 million teu figure has been<br />
filled with goods which were either already containerised,<br />
but were moved on general cargo vessels<br />
or simply not containerised half a decade ago.<br />
Breakbulk liner services continue to fade away as<br />
the cargoes they carry shift to the box (see inset).<br />
This leads to think that, in the first instance,<br />
owners and operators were right to invest so massively<br />
in container tonnage. However, the balance<br />
is fragile. Most operators are struggling in trying<br />
to make profits, and economic accidents are catastrophic<br />
for the bottom line.<br />
As for the non-cellular fleet deployed on liner<br />
trades, it includes multipurpose cargo vessels, roro<br />
ships and a few conbulkers. Some of these noncellular<br />
ships are currently deployed on liner<br />
trades, and as far as they can be identified they<br />
total some 1,550 units of 100 teu and over, representing<br />
around 800,000 teu.<br />
By comparison, in early 1996, the figure for these<br />
ships stood at around 2,600 units for almost<br />
1.1 million teu. Thus, the non cellular component<br />
of the liner fleet has lost 1,050 ships for some<br />
0.3 million teu in 6 or 7 years, which can be assumed<br />
to have shifted to cellular ships (and this is a<br />
maximum figure as many general cargo ships and<br />
ro-ros do not make full use of their teu capacity).<br />
This still leaves us with a differential of almost<br />
1 million teu, which can be assumed as having<br />
absorbed cargoes not yet containerised in the mid-<br />
1990s as well as empty boxes carried in larger<br />
quantities than ever before.<br />
In addition, it can be said that these massive investments<br />
spurred competition so that box rates reached<br />
As the container continues to make inroads into the breakbulk sector, the surviving regular<br />
conventional services see their volumes dwindle year after year, vanishing like fading stars. Each<br />
year brings it examples. In 2002, the U.S. Gulf-Brasil service operated by Brasilian operator Global<br />
Transporte Oceanico (<strong>GB</strong>TO) was closed. This service used to be run with up to five 17,000<br />
dwt / 500 teu ships in the mid 1990s (mostly Astrakhan tonnage), then lost progressively its grip<br />
on the market as competitive container services were incessantly upgraded, up to the unavoidable<br />
weekly frequency and with unbeatable transit times. High volumes of specific cargoes (such<br />
as CKDs - Cars Knocked Down) and the boxes still carried on these multipurpose ships were more<br />
and more siphoned off by full container ships, while cheaper box rates helped to attract low value<br />
“breakbulk” cargoes. And as the cargoes flee the conventional ships, less and less sailings were<br />
offered. Eventually, these services lost their remaining appeal with regular shippers.<br />
The Containership Market in 2002<br />
77
78<br />
Shipping and Shipbuilding Markets <strong>2003</strong><br />
Basis: existing fleet and confirmed orders as received at 1 January <strong>2003</strong><br />
Number of ships per quarter<br />
35<br />
6,000 teu and over 5,000/6,000 teu 4,500/5,000 teu 4,000/4,500 teu<br />
30<br />
25<br />
20<br />
15<br />
10<br />
5<br />
0<br />
1995-I<br />
1995-II<br />
1995-III<br />
1995-IV<br />
1996-I<br />
1996-II<br />
1996-III<br />
1996-IV<br />
1997-I<br />
1997-II<br />
such low figures that the container sector now<br />
attracts low value cargoes or goods of a certain<br />
value, which were until recently cheaper to carry in<br />
conventional or bulk carrying tonnage, such as steel<br />
products, forest products or bagged sugar.<br />
No reversal expected<br />
in the box rates downtrend<br />
Should this trend continue, as there are still a lot<br />
of goods that could be containerised, container<br />
tonnage could be ordered massively and yet be<br />
filled. The question is of course the cost for carriers…<br />
It is a nonsense to carry waste paper on<br />
ships plying at 25 knots but such low value cargoes<br />
make a few bucks when repositioning other-<br />
1997-III<br />
1997-IV<br />
1998-I<br />
Evolution of the fleet 1992 - <strong>2003</strong><br />
Containerships over 4,000 teu - Deliveries<br />
1998-II<br />
1998-III<br />
1998-IV<br />
1999-I<br />
1999-II<br />
wise empty boxes, which is better that nothing at<br />
all. Conversely, a lot of not so cheap consumer<br />
goods are carried at a cost representing a tiny fraction<br />
of their prices as displayed on the retail shelf.<br />
The industry is still fragmented, with the “Top 10<br />
carriers” controlling roughly 50 % of the market.<br />
So there is room for bitter rivalry. Intense competition<br />
between carriers and the race for market<br />
share have driven rates down over the years, and<br />
there are no signs of a reversal of this trend. Instead,<br />
the container shipping industry is under<br />
constant pressure not only from shippers -which is<br />
natural- but also, more artificially, from regulators,<br />
which suspect every form of alliance or sharing<br />
agreements to generate cartel-like behaviour.<br />
Cellular Box non-cellular<br />
Year no teu progr. no teu progr.<br />
1992 1,424 2,010,644 891 285,916<br />
1999-III<br />
1999-IV<br />
2000-I<br />
1993 1,520 2,207,466 9.8 % 966 315,529 10.4 %<br />
1994 1,621 2,384,709 8.0 % 1,031 333,697 5.8 %<br />
1995 1,765 2,643,221 10.8 % 1,115 362,399 8.6 %<br />
1996 1,937 2,969,032 12.3 % 1,198 385,059 6.3 %<br />
1997 2,130 3,345,285 12.7 % 1,309 424,505 10.2 %<br />
1998 2,359 3,847,991 15.0 % 1,413 463,420 9.2 %<br />
1999 2,535 4,258,281 10.7 % 1,546 542,197 17.0 %<br />
2000 2,625 4,475,628 5.1 % 1,649 598,795 10.4 %<br />
2001 2,755 4,892,759 9.3 % 1,776 659,997 10.2 %<br />
2002 2,915 5,532,788 13.1 % 1,879 707,250 7.2 %<br />
<strong>2003</strong> 3,044 6,068,434 10.3 % 1,985 757,663 7.1 %<br />
Figures are given at 1 st Januaries of each year. Source : <strong>BRS</strong>-Alphaliner<br />
2000-II<br />
2000-III<br />
2000-IV<br />
2001-I<br />
2001-II<br />
2001-III<br />
2001-IV<br />
2002-I<br />
2002-II<br />
2002-III<br />
2002-IV<br />
<strong>2003</strong>-I<br />
<strong>2003</strong>-II<br />
<strong>2003</strong>-III<br />
(Source: <strong>BRS</strong>-Alphaliner)<br />
<strong>2003</strong>-IV<br />
2004-I<br />
2004-II<br />
2004-III<br />
2004-IV
$/day (Source: <strong>BRS</strong>-Alphaliner)<br />
30,000<br />
25,000<br />
20,000<br />
15,000<br />
10,000<br />
5,000<br />
0<br />
Jan 98<br />
Apr 98<br />
July 98<br />
Oct 98<br />
Containerships time charter rates - evolution 1998-2002<br />
3,500 teu<br />
2,100 teu<br />
1,700 teu<br />
1,100 teu<br />
Jan 99<br />
And with 4,000+ teu ships starting to find their<br />
way on North-South trades, the box rates are<br />
expected to plunge further in the long term on<br />
these trades, in corollary to the economies of scale<br />
that these large ships allow.<br />
Fragmentation, competition pressure and the race<br />
to market share are powerful incentives for mergers<br />
and acquisitions. On the other hand, the des-<br />
Apr 99<br />
July 99<br />
Oct 99<br />
Jan 00<br />
Apr 00<br />
The deadweight comes back in vogue<br />
truction of value, which has followed large mergers<br />
in the recent past (in sectors ranging from the<br />
automotive industry to the telecom and steel<br />
industries) appears as a strong deterrent. There<br />
has been a lull in the consolidations since the late<br />
1990s. A new round of mergers is inevitable. But<br />
who can dare say when it will happen, and in<br />
what context ?<br />
The cargoes which have shifted to the container over the recent years are generally significantly<br />
heavier than the cargoes traditionally stuffed in boxes. The deadweight capacity of containerships<br />
now takes on a greater significance than ever before. With most liner statistics focusing on teu,<br />
the deadweight capacity has been forgotten. It is now time to reinstate it. After all, the cellular<br />
fleet nom reaches 85 million dwt, which represents roughly 10 % of the deadweight tonnage of<br />
the world merchant fleet.<br />
The traditional items carried by containers are light ones, both in their own nature (think of the<br />
volume to weight ratio of a TV set) and because of the packing used (think of the super light polyester<br />
pads which protect this same TV set in its bulky cardboard box) – not to mention boxes full<br />
of Christmas balls which flow periodically out of China. Light boxes have now to share ship slots<br />
with boxes fully laden in weight.<br />
Modern cellular ships are designed in such a way that the average load of teu carried stands at<br />
around 12 to 13 tons per teu, which leaves roughly 10 tons of cargo per teu after subtraction of<br />
the box tares, and allowance for bunker supplies.<br />
Most of the time, ships are today fully laden in weight well before deck cargoes are complete.<br />
Fortunately, empty boxes have often to be repositioned on the legs where the average loaded<br />
box weight is high. Thus, deck cargoes are topped up with these empty boxes, provided that allowance<br />
has been planned to take their light weight into account.<br />
July 00<br />
Oct 00<br />
Jan 01<br />
Apr 01<br />
July 01<br />
Oct 01<br />
Jan 02<br />
Apr 02<br />
July 02<br />
Oct 02<br />
The Containership Market in 2002<br />
79
80<br />
Shipping and Shipbuilding Markets <strong>2003</strong><br />
The operators<br />
The liner shipping industry is not as concentrated<br />
as other industrial sectors. It is scattered among<br />
some 300 operating groups operating 4,650 ships<br />
deployed on liner trades worldwide, representing<br />
6.3 million teu at the closure of the year 2002, of<br />
which only 1 % were inactive, according to <strong>BRS</strong>-<br />
Alphaliner data.<br />
The largest of them, Maersk-SeaLand, operates a<br />
capacity of 825,000 teu, representing 12 % of the<br />
global active capacity in teu terms. The next in size<br />
is MSC, with 6.8 % of the global capacity.<br />
There have been only minor transactions in 2002.<br />
The most significant ones have been the sale by<br />
Andrew Weir & Co of most of its services to Hamburg-Süd<br />
(which bought the Ellerman Line) and<br />
CMA CGM (which bought MacAndrews and<br />
UBC), the sale by D’Amico di Navigazione of Italia<br />
Straight sales<br />
◆ Hamburg-Süd bought the Ellerman Line from<br />
Andrew Weir & Co.<br />
◆ CMA CGM bought MacAndrews and UBC from<br />
Andrew Weir & Co.<br />
◆ C.P. Ships bought Italia Line from D’Amico di<br />
Navigazione.<br />
◆ CSX Corp. (U.S.) reached an agreement to<br />
convey its domestic container shipping unit CSX<br />
Lines LLC to a venture formed with the Carlyle<br />
Group (effective <strong>2003</strong>).<br />
◆ A.P. Möller bought the liner division of Copenhagen-based<br />
Torm A/S D/S.<br />
◆ Navalmar Transportes Maritimo (Boggazzi<br />
Group) bought 50 % of the stock of Nordana Line<br />
A/S from Dannebrog.<br />
◆ CSAV bought the Norsul container shipping<br />
activities (Brasil), which were limited to its participation<br />
in the “Good Hope Express”.<br />
◆ Sea Star Line (U.S.) bought Navieras de Puerto<br />
Rico (U.S.) from Holt (U.S.).<br />
◆ Tropical Shipping (U.S.) bought certain assets of<br />
Tecmarine Lines and TMX Logistics (U.S.).<br />
◆ Seaboard Marine (U.S.) bought the remaining<br />
services of Tecmarine (U.S.).<br />
◆ Wan Hai took over the customer base of Trans<br />
Pacific Line.<br />
Transfers within operating groups<br />
◆ The Preussag Group bought the remaining<br />
Line to C.P. Ships and the sale by CSX of its container<br />
shipping activities to US investors. Interestingly,<br />
the ships owned by the sellers were not involved<br />
in the Andrew Weir and D’Amico deals, and<br />
were merely chartered in. Other transactions are<br />
summed up in the accompanying table.<br />
There are larger deals in the offing. P&O Nedlloyd<br />
could become a target when it will be introduced<br />
on stock exchanges (which was postponed). APL,<br />
which suffers from heavy losses, is also prone to<br />
accept an M&A deal (although APL parent company<br />
NOL is to raise cash from the planned sale of<br />
its tanker subsidiary AET). The privatisations of Zim<br />
and S.C. India are still in the news, although they<br />
have stalled for political reasons.<br />
East-West niche carriers are also downsizing their<br />
operations as they cannot compete with global organisations<br />
employing large, economic ships. In 2002,<br />
Trans Pacific Line (TPL) left the Asia-U.S. trade while<br />
Operators : transactions and significant moves in 2002<br />
0.4 % of Hapag-Lloyd shares, giving it the whole<br />
control of the company.<br />
◆ Tschudi & Eitzen (Norway) gained 100% ownership<br />
of the Estonian Shg Co.<br />
◆ NYK completed its stake in TSK (its intra Asian<br />
arm), gaining 100% ownership.<br />
◆ Evergreen International Storage and Transport<br />
Corp. bought Uniglory (intra Asian arm of Evergreen)<br />
through a share swap.<br />
Cessations of activity<br />
◆ International Shipping Line (ISL) was terminated<br />
after Belgium - based MCL Shipping (Maritime<br />
Chartering & Liner Shipping Company NV, which<br />
managed the ISL service) filed for bankruptcy (ISL<br />
operated a North Europe - West Africa breakbulk<br />
service).<br />
◆ Valuship ceased its activities after the failure of<br />
its WCNA-Europe service.<br />
Significant other moves<br />
◆ Senator Linie (Germany, 75 % Hanjin ownership)<br />
left all the services involving the U.S.<br />
◆ Sinotrans left the China-Europe trade.<br />
◆ Fu Hai Line halted its Far East-South Africa service.<br />
◆ Coral Container Line (Cuba) closed its own<br />
Med-Cuba service and opted for slot buying.<br />
◆ Global Transporte Oceanico (Brasil) closed it U.S.<br />
Gulf-Brazil multipurpose service.<br />
◆ Libyan carrier GNMTC ran into difficulties.
Maersk-SL + Safmarine<br />
Mediterranean Shg Co<br />
P & O Nedlloyd<br />
Evergreen Group<br />
Hanjin / Senator<br />
APL<br />
COSCO Container Lines<br />
CMA-CGM Group<br />
NYK<br />
CP Ships Group<br />
K Line<br />
Mitsui-OSK Lines<br />
Zim<br />
China Shg Group<br />
OOCL<br />
Hapag-Lloyd Group<br />
Hyundai<br />
Yang Ming Line<br />
CSAV Group<br />
Pacific Int'l Lines<br />
Hamburg-Süd Group<br />
Wan Hai Lines<br />
UASC<br />
Delmas Group<br />
Grimaldi (incl. ACL)<br />
0<br />
in '000 teu<br />
100 200 300 400 500 600 700<br />
800<br />
900<br />
Sinotrans left its Asia-Europe trade. Senator Linie has<br />
also left all its U.S.-related trades, which have been<br />
in fact shifted to its parent company Hanjin.<br />
The fleet<br />
The cellular fleet stood at 6,068,000teu on 1 st January<br />
<strong>2003</strong>, shared between 3,044 ships. It has doubled<br />
during the past seven years, in teu terms, meaning<br />
that the average annual growth has been at roughly<br />
10.5%. In 2002, the growth reached 10.3%.<br />
Two hundred and one cellular ships were delivered<br />
during the year 2002, for a total capacity of<br />
642,261 teu. At the same time, 59 cellular ships<br />
were withdrawn for 74,001 teu, leaving a net fleet<br />
increase of 568,260 teu.<br />
Eighty two cellular ships were ordered for<br />
363,000 teu, Their cumulated value is estimated at<br />
$3.6 billion. It is a far cry from the year 2000,<br />
when 1,038,000 teu were ordered for a total value<br />
of $11.5 billion (some of them were however cancelled<br />
in 2002, especially in Polish yards).<br />
In <strong>2003</strong> and 2004, the annual growth should<br />
reach a relatively modest 7.5 %, based on the current<br />
orderbook in January <strong>2003</strong> and taking into<br />
account a deletion rate of 50,000 teu per annum.<br />
The largest ships in service remain the 19 ‘Sovereign’<br />
class series vessels of Maersk-SeaLand, the capacity<br />
of which stands at around 8,000 teu (although<br />
advertised at 6,600teu by A.P. Möller). Four of them<br />
Liner operators ‘Top 25’ - at 1 st January <strong>2003</strong><br />
Operated fleets<br />
Based on existing fleet at 1st January <strong>2003</strong><br />
teu capacity available on board operated ships<br />
- All subsidiaries are consolidated -<br />
(Source: <strong>BRS</strong>-Alphaliner)<br />
were delivered in 2002. A.P. Möller has six “large”<br />
ships on order, for delivery in <strong>2003</strong>-2004. Their size<br />
is undisclosed and it is only when the first ship will<br />
be delivered that their real capacity can be appreciated.<br />
Meanwhile, Seaspan has ordered five ships<br />
of 8,100 teu at Samsung on behalf of a long term<br />
charter by China Shipping Container Lines (CSCL).<br />
There are currently 28 ships of more than<br />
7,000 teu in service, including 25 units owned by<br />
A.P. Möller and three by Hapag-Lloyd. There are<br />
29 more on order : six for A.P. Möller/Maersk-Sea-<br />
Land, eight for OOCL, five for Seaspan/CSCL, five<br />
for Rickmers Schiffahrts/Cosco, four for P&O Nedlloyd<br />
and the remaining ship for Hapag-Lloyd. German<br />
owners have engaged discussions with Hyundai<br />
for a series of ships of 8,450 teu.<br />
With the exception of the six Maersk-SeaLand newbuildings,<br />
for which nothing is known, all the 7,000+<br />
teu ships offer a breadth of 42,80 m, allowing the<br />
stowage on deck of 17 rows of boxes. This is no<br />
coincidence: most of the large terminals are fitted<br />
with gantry cranes with a 17-row or 18-row reach.<br />
As for the six Maersk-SeaLand newbuildings for delivery<br />
this year and next, a breadth of 55 or 56 meters<br />
cannot be ruled out. It corresponds to 22 rows on<br />
deck, in line with the gantry cranes in which Maersk-<br />
SeaLand invested so much over the past three years<br />
for its own terminals. One can reasonably speculate<br />
that such an investment will be matched with the<br />
construction of adequate ships. That means the<br />
10,000teu barrier could be broken. ■<br />
www.alphaliner.com<br />
The Containership Market in 2002<br />
81
82<br />
Shipping and Shipbuilding Markets <strong>2003</strong><br />
The containership second-hand market in 2002<br />
as a vintage was relatively modest but<br />
2002nonetheless respectable concerning the<br />
second-hand market activity, with some 135 containerships<br />
sold for a combined value of $ 1.56 billion. The<br />
relative weakness of the market can be explained for<br />
the most part by the quasi-non-existence of the German<br />
market (except the numerous orders of new ships),<br />
preoccupied by placing the 150 ships already in her<br />
portfolio with local independent investors. On the other<br />
hand, this year can be viewed as one of consolidation<br />
after several seasons rich in mergers and acquisitions.<br />
The breakdown of the sales in 2002 quite accurately<br />
reflects the proportions of the existing fleet with 13<br />
ships over 3,000 teu (of which 5 over 4,000 teu) sold,<br />
30 ships between 2,000 and 3,000 teu, 50 ships 1,000<br />
and 2,000 teu and 42 ships under 1,000 teu.<br />
There were relatively few massive “en bloc” sales this<br />
year, with the exception of the 11 ships built in 1995-<br />
1996 of 650 teu for Elite Shipping sold to the Danish<br />
operator Clipper for a global price of $110 million, and<br />
the 4 ships of 3,500 teu built in 1993-1994 of L+B sold<br />
to MSC following a bareboat charter for about<br />
$ 20.7 million each.<br />
The Greek owner Technomar was extremely active this<br />
year with 5 ships bought in 2002 to bring his total to 13<br />
(of which 4 GX-class, 4 G-class and 4 L-class) bought<br />
from Evergreen on a time charter back for 5 to 7 years.<br />
The small number of ships scrapped this year is worth<br />
noting, 59 ships with a total containership capacity of<br />
74,001teu roughly 1% of the world capacity. This phenomenon<br />
can largely be explained by a freight market,<br />
which on average was rising steadily throughout the year.<br />
A large majority of business contracted in 2002 was<br />
combined with charter employments (longer or shorter<br />
depending on investment sizes) to the liner operators,<br />
which has now become a recurring feature in this sector’s<br />
activity.<br />
As to price variations over the year, it can be summarised<br />
by a rising curve, which saw all sectors appreciate by<br />
some 10 to 20% compared to 2001. Naturally this trend<br />
is more or less pronounced according to the various type<br />
and size of ships. As to be expected the sale prices follow<br />
the tendency of the market, with immediate effect in the<br />
case of a jump in daily rates (which happened this year),<br />
whereas prices are bolstered up for a longer period in the<br />
case of falling freight rates. Consequently although we<br />
have seen rates drop as from November 2002 after the<br />
prolonged strike in ports which blocked a large number<br />
of ships on the U.S. West Coast, ship prices have nonetheless<br />
remained fairly stable over the last two months.<br />
Ships under 1,000 teu<br />
As usual with this size, buyers are fairly heterogeneous.<br />
Given their poor profit-earning capacity in terms of<br />
pure investment, it is rarely speculators but rather pure<br />
liner operators who buy these ships. The market price<br />
has remained very steady. The improvement in rates has<br />
helped reassure buyers as to the high prices being<br />
sought by sellers. It is in these conditions that we have<br />
seen the following:<br />
◆ ‘Flemming Sif’, ‘Kathrin Sif’ 9,750 dwt, 972 teu,<br />
1990 Orskov, change hands at around $ 8.7 million<br />
each.<br />
◆ ‘Green Breeze’, ‘Green Better’ and ‘Green Bridge’,<br />
512 teu, 1984 Hakodate, sold to Bangladesh buyers at<br />
around $ 2.5 million each.<br />
◆ ‘Xin Hai Yi’, 9,734dwt, 612teu, 1985 Japan, sold for<br />
$ 3 million in September 2002 to Chinese buyers.<br />
Ships of 1,000 to 2,000 teu<br />
The market took advantage of a favourable upsurge<br />
after having slumped in the doldrums during the course<br />
of 2001. A large number of ships on order which<br />
can take the place of sold units have been delivered or<br />
are on the point of being so. Sales have for the most<br />
part benefited from time charters back, covering the<br />
interim period up until the delivery of new ships awaited<br />
by the sellers. We can note for example :<br />
◆ ‘Sagittarius’ 23,051 dwt, 2001 Szczecinska,<br />
1,730 teu, 20 knots on 50.5 t, sold by Costa Container<br />
Lines for $ 22 million in September to Lipsi Navigation.<br />
◆ ‘Mapocho’ 21,184dwt, 1999 Hanjin, 1,620teu, sold<br />
to CSAV for $ 17.4 million in September.<br />
◆ ‘Iyo’, 24,370 dwt, 1995 Shin Kurushima, 1,613 teu,<br />
20 knots on 53 t, sold by Fair Wind Navigation to Tsakos<br />
for $ 13.3 million in December 2002.<br />
◆ ‘Box Wave’, ‘Gallant Wave’, 24,083 dwt, 1995 and<br />
1996, Shin Kurushima, 1,510 teu, 19 knots on 45 t,<br />
sold in August to clients of Teo Shipping for $ 14 million<br />
each with a charter-party attached for 18 months<br />
at $ 8,000 per day.<br />
◆ ‘Kuo Lih’, 18,050 dwt, 1995 Imabari, 1,471 teu, 17<br />
knots on 31 t, sold in May to clients of Vroon for about<br />
$ 9.7 million, with a charter-party attached for 12<br />
months at a level of $ 7,500 per day.<br />
◆ ‘Lisboa’, ‘Tavira’ and ‘Miden Agan’, 21,370 dwt,<br />
1982 Warnowwerft, 1,438 teu, 19 knots on 62 t, sold<br />
in October by Sarlis Container Line for about $ 3 million<br />
each.
Ships of 2,000 to 3,000 teu<br />
One can detect a certain hesitancy on the part of buyers<br />
in this market as the future does not have the backing<br />
of a fair number of operators. Some fear that the units<br />
of 2,500 teu will be replaced sooner or later by ships<br />
carrying more than 3,000 containers. This point of view<br />
is supported by an orderbook which carries relatively<br />
few ships of this size. It is true that 1999, 2000, and<br />
2001 produced a large number of units between 2,000<br />
and 2,800 teu. Operators have consequently been prudent,<br />
in concluding several operations mainly secured<br />
against firm employment:<br />
◆ ‘P&O Nedlloyd Xiamen’, ‘Oriental Bay’ and ‘Grand<br />
Vision’, 44,006 dwt, 59,285 dwt and 44,005 dwt, built<br />
in 1991, 1989, and 1991 at Daewoo, with a capacity of<br />
2,797, 4,206, and 2,986 teu were sold en bloc on subjects<br />
to clients of Zodiac for $ 61 million.<br />
◆ ‘MOL Victory’ and ‘MOL Independence’, 40,638dwt<br />
and 38,014 dwt, 1988 and 1986 Imabari, 2,890 and<br />
2,571 teu, 22 knots, sold en bloc in October by Karakoram<br />
Maritima to clients of Danaos for $ 24 million.<br />
◆ ‘MSC Europe’, 45,647 dwt, 1986 Tsuneishi,<br />
2,875 teu, 22.5 knots on 89.5 t, sold in June by Acasia<br />
Shipping to clients of Danaos for $ 12 million.<br />
◆ ‘LT Glory’, ‘LT Grand’, ‘LT Globe’, 43,310 dwt, 1984<br />
Onomichi, 2,728 teu, 20.5 knots on 74 t, sold en bloc<br />
in December by Everglory Line to clients of Technomar<br />
for $ 13 million each with a charter-party attached for<br />
5 years at a rate of $ 12,500 per day.<br />
◆ ‘CMA CGM Claudel’, 34,622 dwt, 2002 STX,<br />
2,602 teu, sold by Efshipping to Schulte Group for<br />
$33.85 million, including a transfer of the charter-party<br />
to CMA CGM until February 2007 at $ 16,600 per day.<br />
◆ ‘Christine Schulte’, 33,871 dwt, 2001 Hyundai,<br />
2,550 teu, sold in December by B. Schulte to German<br />
investors for $33.5 million, including a transfer a 4-year<br />
charter-party to CSAV at $ 16,750 per day.<br />
◆ ‘Ambassador Bridge’, 45,643 dwt, 1986 Tsuneishi,<br />
2,518 teu, 22.5 knots on 89.5 t, sold in May to clients<br />
of Danaos for $ 11 million with a 18 to 24 month charter-party<br />
at $ 12,000 per day.<br />
Ships over 3,000 teu<br />
Only 13 sales were achieved out of more than 600 ships<br />
existing in this category. None or very few sellers showed<br />
themselves. The market was extremely nervous on<br />
the selling side, with owners reluctant to sell for fear of<br />
not finding a replacement unit and this, even if the sale<br />
prices were attractive. Consequently outside of the<br />
“straight” purchase by MSC of 4 ships from L+B, already<br />
under charter to them, the others sales were all<br />
undertaken by operators / investors against charters<br />
back. These operations are more and more sought after<br />
not only by the traditional German investors, but also<br />
by owners such as Zodiac, Technomar, Danaos, Costamare…<br />
◆ ‘CMA CGM Normandie’, 59,600 dwt, 1991 Samsung,<br />
4,734 teu, 24 knots on 158 t sold in September<br />
by CMA CGM to clients of Zodiac for $ 31 million with<br />
a 3-year charter back at $ 21,775 per day.<br />
◆ ‘MSC Sarah’, ‘MSC Ingrid’, and ‘MSC Matilde’,<br />
67,795 dwt, 2000 Samsung, 4,400 teu, 25 knots, sold<br />
in March to Swiss buyers for $40 million each and fixed<br />
for a long period with MSC.<br />
◆ ‘Peloponesian Pride’, 53,240 dwt, 1986 Onomichi,<br />
3,428 teu, 21 knots on 74.5 t, sold in August by Evergreen<br />
Marine to clients of Technomar for $ 21 million<br />
with a 7-year charter back at $ 15,500 per day.<br />
◆ ‘MSC Martina’, ‘MSC Sophie’, ‘MSC Monica’ and<br />
‘MSC Rossela’, 43,600 dwt, 1993, 1994, 1993 and<br />
1994 at Samsung, 3,424 teu, 22.5 knots on 99 t, sold<br />
in February by Hansa Asia to MSC for $ 20.7 each, subjects<br />
lifted following a bareboat charter with purchase<br />
option on the 4 ships.<br />
Nearly all analysts at the end of 2001 were predicting a<br />
vintage 2002 somewhat depressed and a declining<br />
market. Once again as in 2000, the containership market<br />
surprised everybody. In a stagnant world economy,<br />
shipping lines were able to re-distribute the cards to be<br />
able to offer a service tailor-made to the situation. The<br />
specificity of containers allows such flexibility. It is also<br />
this adaptability that reassures investors, who have<br />
found a means of investment which insures regularity,<br />
safety (very few accidents), flexibility to market changes<br />
and - the icing on the cake - tax relief.<br />
At the time of writing, good news has been announced<br />
in France regarding the introduction of “tonnage tax”<br />
system. We can only hope that this tax incentive is as<br />
open and accessible as it has been in Germany, which<br />
thanks to this opening, has experienced the shipping<br />
activity that we all know. ■<br />
CMA CGM Normandie<br />
4,688 teu, 59,600 dwt,<br />
blt 1991 by Samsung,<br />
operated by CMA CGM.<br />
The Containership Market in 2002 83
84<br />
Shipping and Shipbuilding Markets <strong>2003</strong><br />
<strong>BRS</strong> Research and<br />
Information Department<br />
The Research and Information Department maintains<br />
a large data basis and information library which covers all<br />
sectors of activities handled by <strong>BRS</strong>, and is available for<br />
consultation or advice of clients.<br />
This Department handles the information reports, analyses,<br />
studies and statistics covered on the company’s internet site.<br />
It works in co-operation with the brokers in each departments<br />
to meet the needs of clients.<br />
The Research and Information Department also offers its<br />
know-how and the companies’ international network and<br />
expertise available to the shipping world to assist and answer<br />
any queries.<br />
You can reach this service directly<br />
at the following address:<br />
research@brs-paris.com<br />
Or through your broker.
THE<br />
RO-RO<br />
MARKET<br />
IN<br />
2002<br />
Is the ro-ro concept only dedicated to extremes?<br />
The niches where the general ro-ro concept is<br />
likely to remain and be developed are definitely<br />
short-sea trade routes with an increasing<br />
need for fast tonnage and deep-sea trade with rolling<br />
cargoes only. There seems to be very little future<br />
for intermediate distance routes where ro-ro ships<br />
actually load combinations of rolling and containerised<br />
cargoes, because of poor financial returns. The<br />
interaction between the container and the “roll-on<br />
/ roll-off” concepts on main routes often resulted in<br />
ro-ro tonnage being unable to compete against the<br />
operationally cheaper containerships. This trend is<br />
unlikely to reverse. Wilhelmsen’s decision to convert<br />
their four super carrier designed initially to carry<br />
around 2,500 teu into vessels loading only rolling<br />
cargo is a strong example of the limits between flexibility<br />
and economy. To make economic sense on<br />
long haul routes, vessels have to be specialised, large<br />
and fast like the new generation of PCTC. South<br />
America and West Africa are the only significant<br />
areas served by medium-size units plying intermediate<br />
distance routes and loading mixed cargoes.<br />
We feel that there is a clear need of rationalisation<br />
there, and few of the existing operators have really<br />
yet taken concrete steps towards such a change.<br />
The economical crisis in South America in 2002 has<br />
substantially reduced import volumes, and as a<br />
consequence could possibly, in the medium term,<br />
further accelerate this rationalisation process on<br />
lines serving the southern hemisphere from North<br />
Europe and the Mediterranean.<br />
The ro-ro fleet remains quite old and this appears<br />
clearly in the graph page 86. In terms of number of<br />
units, tonnage of 25 years old and over represents<br />
17 % of the total ro-ro fleet. The latter focuses on<br />
tonnage of less than 15,000 dwt which, for statistical<br />
purposes, we have arbitrarily taken as a benchmark<br />
limit of tonnage deployed on short-sea trade.<br />
The Ro-Ro Market in 2002<br />
85
86<br />
dwt<br />
500,000<br />
450,000<br />
400,000<br />
350,000<br />
300,000<br />
250,000<br />
200,000<br />
150,000<br />
100,000<br />
50,000<br />
1970<br />
1971<br />
Shipping and Shipbuilding Markets <strong>2003</strong><br />
0<br />
1972<br />
1973<br />
1974<br />
1975<br />
Ro-ro freighters with a 100% ro-ro capacity, by year of build<br />
1976<br />
Most of the ships that are today 25 years old or more,<br />
will be scrapped in the short / medium term and<br />
scrapping activity for large units in particular has<br />
increased in 2002. Based on the existing figures and<br />
a reasonable scrapping ratio, we expect the average<br />
age of the fleet to be circa 18 years by 2005, and<br />
circa 15 years old by 2010. Over the past few years,<br />
there has been an interesting matching process between<br />
tonnage ordered, tonnage scrapped, and tonnage<br />
delivered. Considering the prospects of an unavoidable<br />
rise in scrapping activity, and the limited<br />
number of ships ordered since 2001 the market could<br />
in theory be characterized by a shortage of tonnage<br />
by 2005. But, bearing in mind that the ro-ro market<br />
is a very small segment, our view is however that<br />
there will be no sudden change in the balance of<br />
available tonnage, but rather a tendency for operators<br />
to continue ordering ships fitting their needs, further<br />
reducing the volume of the time charter activity.<br />
The graph page 87 of forecast for renewal of the<br />
fleet has been made observing that:<br />
◆ Average capacity of 25 year old tonnage is about<br />
1,200 lane metres,<br />
◆ Average capacity of recently delivered ships is<br />
about 2,500 lane metres,<br />
And on assumptions that :<br />
◆ Ro-ro units deployed in deep-sea trade are likely<br />
to be replaced by PCTC and containerships. Benchmark<br />
size for deep-sea traders was set here at<br />
15,000 dwt and above, whereby this projection<br />
focuses on tonnage of less than 15,000 dwt.<br />
1977<br />
1978<br />
1979<br />
1980<br />
1981<br />
1982<br />
(excl. PCC, PCTC & Ro-Lo)<br />
1,500-3,500 dwt 3,500-5,000 dwt 5,000-7,500 dwt 7,500-10,000 dwt 10,000-15,000 dwt<br />
1983<br />
1984<br />
1985<br />
1986<br />
1987<br />
1988<br />
1989<br />
1990<br />
1991<br />
1992<br />
1993<br />
1994<br />
◆ Cargoes carried today by independent shipowners<br />
on the oldest units will be split between containerships<br />
and tonnage deployed by well established<br />
short-sea trade operators, once the oldest units are<br />
scrapped.<br />
◆ Increased speed of new vessels will result in larger<br />
volumes shipped on given routes.<br />
Based on the above and in order to build such a<br />
prediction we have applied a renewal ratio of 3 to<br />
1 between vessels to be scrapped and those to be<br />
delivered for replacement.<br />
When analysing the type of tonnage ordered by<br />
tramp owners and operators in the last 7 years, the<br />
clear tendency has been to order larger units (2,400 /<br />
3,000 lane metres), whilst medium-size ships dedicated<br />
to the tramp market (1,500 / 2,000 lane metres)<br />
seem to have been somehow “forgotten”. We feel<br />
that the next developments to come will call for tonnage<br />
in the 1,500 / 2,000 lane metres segment, built<br />
with rather high specs and flexibility in terms of cargo<br />
configuration (hoistable cardecks, good manoeuvrability)<br />
and speed of 20 knots and over.<br />
Once again, the charter market activity has been predominant<br />
in North Continent and Mediterranean<br />
Sea areas. An important proportion of the chartered<br />
tonnage replaced by own tonnage lead the main<br />
operators to much less activity on the chartering side,<br />
whilst a good proportion of available ships was fixed<br />
for military movements, as observed already over the<br />
past few years. Governmental organisations are now<br />
more acquainted with the use and benefits of ro-ro<br />
1995<br />
1996<br />
1997<br />
1998<br />
1999<br />
2000<br />
2001<br />
2002
No ships<br />
60<br />
50<br />
40<br />
30<br />
20<br />
10<br />
0<br />
Ro-ro Fleet under 15,000 Dwt - Deliveries vs Demolitions & Forecast to 2010<br />
1994 1995 1996 1997 1998 1999 2000 2001 2002 <strong>2003</strong> 2004 2005 2006 2007 2008 2009 2010<br />
tonnage. Most of these old units released from their<br />
time charter commitments were actually sold to<br />
either end-users or mainly Greek tramp owners.<br />
Whilst trade in the Baltic Sea sustained good chartering<br />
activity at the beginning of the year, the Spanish<br />
and Italian markets could prove to become new<br />
grounds for further developments, with local operators<br />
investing in second-hand tonnage. No tramp shipowner<br />
dared however to bet massively on buying<br />
second-hand tonnage to play the market on a speculative<br />
basis, and this is certainly a wise decision.<br />
As a consequence of orders placed during the past<br />
few years, the average age of tonnage owned by<br />
the main operators has been lowered substantially<br />
and the ratio of chartered tonnage in their global<br />
operated fleet has also been reduced. On the other<br />
hand, very few tramp owners are able to offer<br />
today modern tonnage for the charter market, but<br />
they will definitely be the ones to whom the operators<br />
will go when their development will call for<br />
extra capacity. Short-sea trade is in our opinion the<br />
real window for future development and will lead<br />
to an upturn of the chartering activity.<br />
Given the incentive subsidies dedicated to the<br />
Marco Polo programme that the EU is due to support<br />
and the increasing demand of tonnage from<br />
military organisations, the market could rebound in<br />
the coming year. The age profile of the fleet is also<br />
an element on which we expect a market upturn<br />
due to a probable tonnage scarcity during <strong>2003</strong> and<br />
2004 for good quality ships. There are numerous<br />
projects to open new services, in particular those to<br />
(Need for replacement on a 1 for 3 basis)<br />
Past deliveries/demolitions<br />
Need for renewal & expected demolitions<br />
Deliveries<br />
Demolitions<br />
fight road congestion and the success of new routes<br />
will be one of the major catalysts for expansion of<br />
the fleet in the longer run. The longer distance the<br />
“sea highways” will cover, the more standard unaccompanied<br />
trailer ships will be needed.<br />
Out of 25 pure ro-ro ships on order by end 2002<br />
(leaving out PCTC and large ro-pax) only 6 are due<br />
to join the tramp market : three from Stena, two<br />
from AWSR and one from Bogazzi (sistership to the<br />
Stena SEC built), all ranging from 2,600 to 3,000<br />
lane metres. This clearly highlights how narrow the<br />
market can be when it comes to availability of<br />
modern tonnage for the charter market as seen<br />
from a charterer’s point of view. The drawback for<br />
tramp shipowners is that they have a very limited<br />
number of serious players in front of them.<br />
The economic downturn affecting the European<br />
economies in 2002 inevitably impacted the<br />
volumes of ro-ro cargo, and due to the delivery of<br />
new vessels, the charter market has become quite<br />
depressed during the whole year 2002 to the<br />
extent that a number of large newly delivered units<br />
could hardly find employment. The balance is<br />
however fragile and its sensibility extreme in one<br />
direction or the other. Without any doubt, there<br />
will still be a need for ro-ro tonnage in the future<br />
and some segments of the market will need to see<br />
rejuvenation of the fleet by means of further<br />
orders. In view of the competitive prices at which<br />
tonnage can be built in China in particular, it is<br />
quite likely that this country will provide a good<br />
proportion of the ro-ro fleet in the coming years.<br />
The Ro-Ro Market in 2002<br />
87
88<br />
Cetam Massilia<br />
12,300 dwt,<br />
3,000 lane meters,<br />
22 knots, built 2002<br />
by Dalian shipyard,<br />
chartered to CETAM.<br />
No ships<br />
35<br />
30<br />
25<br />
20<br />
15<br />
10<br />
5<br />
0<br />
Finnlines<br />
Cargo Service<br />
Grimaldi<br />
Naples<br />
Shipping and Shipbuilding Markets <strong>2003</strong><br />
P&0<br />
DFDS Tor Line<br />
Some newly established operators have opted for an<br />
interesting alternative, buying good quality ships likely<br />
to have another 5 to 8 years of life. The bet is quite<br />
interesting as they will find themselves in some occasions<br />
fighting the majors with ships purchased at low<br />
prices and operated at low costs. In the container<br />
sector, Mediterranean Shipping Company has proven<br />
that this option can generate success stories.<br />
Future Race to gigantism?<br />
Similarly to the container market, there seems to be<br />
thoughts in the market of building larger and larger<br />
units. Projects exist to order trailer carriers with a<br />
capacity in excess of 6,000 lane metres (about 3<br />
times larger than the largest ships deployed in dedicated<br />
trailer trades some 8 years ago). Of course the<br />
larger the ships are, the greater the economies of<br />
Fleet Status of Major Ro-ro Operators as at mid-2002<br />
UECC<br />
Suardiaz<br />
Chartered in<br />
Owned<br />
Cobelfret<br />
Grimaldi<br />
Genova<br />
UND Ro-Ro<br />
This graph shows the globally high ratio of owned units versus<br />
chartered units for the big majority of ro-ro short sea players.<br />
The "exceptions" of Finnlines and Transfennica do not even<br />
balance this phenomenon as their chartered units are to be<br />
considered as "captive". The only real exception is Ferryways<br />
recently established in short sea trade.<br />
Harms<br />
Transfennica<br />
Norse<br />
Merchant<br />
Neptune Lines<br />
Dart Lines<br />
scale can be achieved. However one should always<br />
bear in mind that to make these economies of<br />
scale, vessels have concretely to attract enough<br />
cargo to be loaded at a satisfactory level. Furthermore,<br />
on many trade routes, the speed of loading<br />
and discharging operations can significantly affect<br />
transit-times that are amongst key performance<br />
factors of the ro-ro concept, and gigantism could<br />
eventually be an enemy to these.<br />
Saying this, one should consider these challenges as<br />
really serious and not those of dreamers. Despite<br />
intentions to increase vessels’ size, the exercise of<br />
deploying very large ro-ros on short-sea trades, will<br />
probably be limited due to ports restrictions. However,<br />
long term works to improve port infrastructures and<br />
harbours will run in parallel to this trend with a view<br />
to match ship specifications and shore facilities. ■<br />
Stena Lines<br />
Norfolkline<br />
Ferryways<br />
SOL<br />
Niver Line
THE<br />
REEFERSHIP<br />
MARKET<br />
IN<br />
2002<br />
Light at the end of the tunnel?<br />
At the onset of 2002, an air of optimism<br />
swept through the sector leading many to<br />
believe that perhaps the 5 year-long depression<br />
was finally coming to an end. As it turned<br />
out, it was only a case of high hopes.<br />
Over the past 5 to 6 years, reeferships have been<br />
caught in a difficult context caused by both a surplus<br />
of tonnage and a fierce competition from<br />
containerships. Without a substantial reduction in<br />
the transport capacity of conventional reefers,<br />
freight rates stand no chance of seeing any real<br />
improvement.<br />
Although in terms of global commercial exchanges<br />
the volume of perishable goods continues to grow<br />
at a rate of about 2.5 % per annum, the capacity<br />
of transport at regulated temperatures has increased<br />
at a far greater pace with the introduction of<br />
modern containerships.<br />
Transport capacity for ships over 1,000teu rose by<br />
11% in 2002 (171 ships delivered for 6,190,000teu),<br />
equivalent to 180 million cubic feet of refrigerated<br />
space, calculated on the basis of 13 % of the<br />
40-feet reefer boxes capacity of containerships or<br />
the equivalent of about 79,000 reefer plugs.<br />
Competition<br />
from containerships<br />
Given the ongoing rivalry between pools of reefer<br />
owners and container line operators, the time is<br />
righ for a rationalisation of the industry.<br />
After numerous mergers occurring during the previous<br />
year, in February 2002 we witnessed the<br />
creation of a new pool, “Reefer Ship”, which combines<br />
the ships of Armada Reefer, Eco Ship and<br />
Eastwind. The object of this new pool is to marry<br />
a part of the fleet of small ships of Eastwind and<br />
Armada with the larger ones of Lauritzen-Cool,<br />
thus achieving better coverage of market requirements.<br />
Together they represent approximately<br />
50 ships and 20 million cubic-feet, including<br />
<strong>BRS</strong> - The Reefership Market in 2002<br />
89
Cote d'Ivoirian Star<br />
565,384 cu ft, 174 feu,<br />
110 reefer sockets, 21 kn,<br />
10,350 dwt, delivered 1998 by<br />
Shikoku Dockyard,<br />
operated by NYK STAR Reefers.<br />
90<br />
<strong>BRS</strong> - Shipping and Shipbuilding Markets <strong>2003</strong><br />
a considerable share of ships specialised in transporting<br />
frozen food.<br />
As with all recently formed pools, Reefer Ship members<br />
seek to focus their energies on cost-cutting<br />
measures and boosting the efficiency of their fleets,<br />
rather than on competing against one another.<br />
Important structural changes in exporting countries,<br />
such as New Zealand and South Africa, have<br />
forced owners to become more flexible in order to<br />
face the container-based competition. A deregulation<br />
in apple export procedures in New Zealand,<br />
for example, accelerated the switch to containers.<br />
As a result, if up until 1997, nearly all apples were<br />
transported in reefers, today, one third of them is<br />
moved via containers.<br />
If previously reefer operators, such as NYK-Star<br />
Reefers, Seatrade and Lauritzen-Cool, were used<br />
to dealing only with large organisations, today, in<br />
order to meet the needs of a multitude of small<br />
exporters, they have set up “parcel” services in the<br />
main fruit exporting countries of the Southern<br />
Hemisphere.<br />
NYK-Star Reefer launched two new seasonal services.<br />
The first kicks off in New Zealand, with port<br />
calls at Nelson and Napier, and serves Antwerp<br />
and Sheerness for a transit time of 26 days. The<br />
second trades between South Africa and Russia.<br />
This situation has certainly benefited those exporters<br />
fast enough to exploit the container-based<br />
competition to put pressure on reefer owners. The<br />
latter have countered by proposing fast ships,<br />
equipped to fit refrigerated containers on deck,<br />
and often with atmospheric control systems.<br />
By maintaining the pressure on freight rates and<br />
demanding a constant improvement in the quality<br />
of transportation, shippers stand to gain the most<br />
from the rivalry between reefer and containership<br />
operators.<br />
In the medium term, unless freight levels are high<br />
enough to pay for the renewal of ships, there will<br />
be such an imbalance that owners will be turned<br />
away from the conventional reefer market.<br />
Containerships are in the process of increasing<br />
their market share at the expense of reefer vessels<br />
on a number of routes. Already, nearly all frozen<br />
food exports from South America (with the exception<br />
of fish transhipments) destined to the Far East<br />
travel in containers.<br />
Exports in refrigerated containers out of Argentina,<br />
Chile, and Brazil heading to the U.S. and Europe<br />
are also on the rise.<br />
Containership owners have been anticipating<br />
events:<br />
◆ Maersk-Sealand has put into service 6 ships of<br />
4,500 teu, 800 reefer plugs, 24 knots, to operate<br />
from the East Coast of South America to Europe<br />
replacing ships of 2,800 teu.
◆ During the autumn of 2002, P&O-Nedlloyd<br />
launched a new generation of containerships of<br />
4,100 teu, 1,200 refrigerated plugs and 25 knots.<br />
These 10 ships (7 P&O-Nedlloyd and 3 CP Ships)<br />
replace the 2,700 teu ships on the Australia / New<br />
Zealand to Europe / U.S. run.<br />
◆ At the start of <strong>2003</strong>, MSC is introducing a new<br />
weekly service New Zealand / Europe competing<br />
against P&O-Nedlloyd.<br />
If in the past containerships, relative to reefers,<br />
were characterised by slower speeds and inflexible<br />
transit times, today, they steam at 25 knots and,<br />
thanks to transhipment systems, are able to better<br />
serve shippers’demands, be they small regular<br />
volumes or more important seasonal sizes.<br />
Despite these developments and the fact that the<br />
global capacity of containerships fitted with reefer<br />
plugs is more than double that of the specialised<br />
fleet measured in cubic-feet, in reality only half of<br />
perishable goods travel in containers. Thus, owners<br />
of conventional refrigerated ships remain highly<br />
efficient in their fleet operations and refrigerated<br />
containers have yet to adapt to the most widespread<br />
fruit trades, namely bananas and citrus fruit.<br />
However, recent very low levels of freight rates<br />
have discouraged owners from renewing their fleet<br />
of conventional reefer ships. Were this situation to<br />
persist, one has to question what the future of this<br />
sector will hold. The prospects are all the more<br />
dubious if in the meantime liner operators reduce<br />
the transit times for refrigerated containers and<br />
US cents/Cu ft/30 days<br />
140<br />
130<br />
120<br />
110<br />
100<br />
90<br />
80<br />
70<br />
60<br />
50<br />
40<br />
30<br />
20<br />
10<br />
Reefer vessels spot time charter seasonal rates<br />
(400,000 / 500,000 cu ft)<br />
improve the efficiency of positioning empty boxes<br />
in production zones in line with seasonal cycles.<br />
The fleet<br />
At the end of 2002, the orderbook was virtually<br />
empty with only 3 ships under construction. Rock<br />
bottom demolition prices meant that demolition<br />
remained extremely low throughout the year.<br />
Eighteen ships for a total of 6 million cubic feet<br />
were sent to the scrapyards.<br />
Paradoxically, activity on the second-hand market<br />
for 10 to 15 year old ships was relatively buoyant.<br />
There are two main reasons: first, purchases by existing<br />
pool members of ships belonging to owners<br />
who were seeking to exit the sector and secondly,<br />
purchases by shippers or importers seeking a greater<br />
degree of independence in their operations. The<br />
latter was, for example, the case for Russian fruit<br />
importers as well as for the fishing sector.<br />
As a result, we witnessed a concentration of the<br />
fleet in the hands of few owners – per se, not a<br />
new phenomenon.<br />
In terms of newbuildings, the market is in a state<br />
of limbo, as prospects offer little encouragement<br />
to investors for the moment. Activity is likely to<br />
return when some 100 to 150 ships of over<br />
250,000 cu ft built before 1978 are scrapped.<br />
It is also worth noting that the latest large refrigerated<br />
ships being delivered have a service speed of<br />
23-24 knots and offer various innovations: pallet<br />
0<br />
Jan 1 Jan 15 Feb 1 Feb 15 Mar 1 Mar 15 Apr 1 Apr 15 May 1 May 15 Jun 1 Jun 15 Jul 1 Jul 15<br />
1998<br />
1999<br />
2000<br />
2002<br />
2001<br />
<strong>BRS</strong> - The Reefership Market in 2002<br />
91
92<br />
US cents/Cu ft/30 days<br />
100<br />
<strong>BRS</strong> - Shipping and Shipbuilding Markets <strong>2003</strong><br />
90<br />
80<br />
70<br />
60<br />
50<br />
40<br />
30<br />
20<br />
end 83<br />
end 4<br />
Older/Palletized<br />
Conventional<br />
Modern/Palletized/Good speed, cont. cap. & gear<br />
end 85<br />
end 86<br />
end 87<br />
loading by lift, lateral doors independent from<br />
container loading on deck, the absence of hatchcovers,<br />
and an impressive refrigerated container<br />
capacity reaching up to 70 % of the hold capacity.<br />
These ships of about 600,000 cu ft, 12,000 dwt,<br />
have a combined capacity (hold + deck) of 8,500<br />
to 9,000 pallets.<br />
Major events in the year 2002<br />
Beginning in March 2002, there was a Russian<br />
embargo on American poultry for sanitary reasons<br />
(antibiotics, salmonella, etc.), which lasted until<br />
mid May. It is estimated that American exports to<br />
Russia dropped by 35 % over the year 2002. The<br />
previous year Russia imported 1,36 million tons of<br />
chicken and turkey, of which 1 million came from<br />
the U.S..<br />
Unfavourable weather conditions and the ensuing<br />
torrential rains damaged the banana crop in Ecuador,<br />
Costa Rica and Honduras. Australia, on the<br />
other hand, suffered from an exceptional drought.<br />
Amer Reefer reached an agreement with the New<br />
York bankruptcy court and specifically with creditors<br />
Vroon and Aston Financial Int. Its 7 ships will<br />
remain in the Leonina pool of Lauritzen-Cool.<br />
In Argentina, the crisis and the consequent devaluation<br />
of the peso spurred exports. Despite the<br />
fact that apple (1 million tons) and pear (500,000<br />
tons) production fell by 20 % compared to 2001,<br />
turnover from fruit exports increased by 20 %,<br />
end 88<br />
Reefer vessels - time charter rates<br />
(400,000 / 500,000 cu ft - 12 months)<br />
end 89<br />
end 90<br />
end 91<br />
end 92<br />
end 93<br />
end 94<br />
end 95<br />
end 96<br />
end 97<br />
primarily towards Europe, the Mediterranean area,<br />
and Russia.<br />
In Panama, Chiquita plans to sell 3,000 hectares of<br />
plantation to a co-operative of agricultural workers.<br />
$90 million losses have accumulated in the<br />
last 5 years in this country where irrigation costs<br />
are extremely high.<br />
A dock strike affected 29 ports on the West Coast of<br />
the U.S. for 10 days in September, forcing a re-routing<br />
of containerships as well as some banana carriers.<br />
Some 260 ships were affected by this strike.<br />
In Chile, fruit exports increased by approximately<br />
9 %, riding on a strong dollar. 670,000 tons were<br />
exported to the U.S., 437,000 tons towards Europe,<br />
and 127,000 tons to Asia. Inversely, a strong<br />
euro could lead to a preference of sales towards<br />
Europe in <strong>2003</strong>. Consequently, shipowners face<br />
the enticing prospect of seeing tonnage employed<br />
on the longer routes between Chile and Europe.<br />
In New Zealand poor weather affected the squash<br />
production and exports, mainly to Japan, fell between<br />
25 to 30 %. The apple crop increased by<br />
4 % compared to 2001 (17,7 million cardboard<br />
boxes). With heavy frosts having affected the<br />
apple orchards in the Nelson region, the outlook<br />
for <strong>2003</strong> appears to be bleak, the next crop is<br />
expected to produce 14,5 million cardboard<br />
boxes. On the kiwi front, bad spring frosts, the<br />
worst in 20 years, as well as hailstorms damaged<br />
some of the plantations. The precise result of<br />
end 98<br />
end 99<br />
end 00<br />
end 01<br />
end 02
Million cu ft<br />
400<br />
390<br />
380<br />
370<br />
360<br />
350<br />
340<br />
330<br />
320<br />
310<br />
300<br />
end 86<br />
end 87<br />
end 88<br />
end 89<br />
these climatic conditions remains to be determined,<br />
but one can expect total kiwi production<br />
volumes to be lower.<br />
In Brazil, beef exports were strongly up (910,000<br />
tons in 2002, 826,000 in 2001 and 575,000 in<br />
2000) and the forecast for <strong>2003</strong> is 1,15 million<br />
tons, thus becoming the second largest exporter<br />
in the world after Australia.<br />
Banana production in Ecuador declined, because<br />
of both climatic reasons (heavy rain and cold temperatures<br />
in March and April) and the mushroom<br />
“black sigatoka”. In addition, threats concerning<br />
a rise of Panama Canal tolls may endanger the<br />
bulk of Ecuadorian exports as 60 % of exports take<br />
the Canal route.<br />
In South Africa the deregulation of the old commercial<br />
system and the weakness of the rand helped<br />
fruit exports (1,7 million tons of which:<br />
950,000 tons of citrus fruit, 650,000 tons of<br />
apples, pears, and grapes, and 100,000 tons of<br />
avocados and other various fruit) resulting in a 6 %<br />
increase in volume over 2001 and 10 % rise in<br />
value, with two-thirds going to Europe.<br />
In Costa Rica, between May and June the country<br />
was hard hit by torrential rains, the resulting floods<br />
damaging 40 % of its banana plantations. Consequently,<br />
banana exports fell by approximately 6 %<br />
in the year and the country could find itself being<br />
displaced by the Philippines as the second largest<br />
world exporter.<br />
end 90<br />
Reefer vessels fleet evolution<br />
(vessels of 40,000 cu ft and above)<br />
end 91<br />
end 92<br />
end 93<br />
end 94<br />
end 95<br />
end 96<br />
end 97<br />
end 98<br />
The freight market for conventional<br />
ships of 350,000 to 500,000 cu ft.<br />
First and foremost, the high season only lasted several<br />
weeks. The market peaked at 90 cents and started<br />
to drop off at the end of March. By the end of<br />
April, some 50 ships were already idle in Cristobal.<br />
Relative to 2001, the first quarter performed better,<br />
but the second fared worse.<br />
Having plunged in May, the market picked up in<br />
June thanks to strong activity in citrus fruit, the<br />
renewed movements of frozen chicken into Russia<br />
and a reduction in the spot fleet, as numerous<br />
ships had been laid up after a particularly disappointing<br />
high season. It is estimated that during<br />
the summer approximately sixty ships were laid up<br />
with about 25 million cubic-feet capacity.<br />
At the end of July 2002, the impact of the drop in<br />
volume of banana exports from Ecuador (2 million<br />
cardboard boxes less per week or the equivalent of<br />
10 ships) was heavily felt in the spot market.<br />
The low season has now increasingly shifted to<br />
September / October, as during the period from<br />
May to August transport demand for citrus fruit in<br />
the Southern Hemisphere remains fairly strong.<br />
There was an excess of optimism in the market<br />
during the summer when freight rates were fixed<br />
during the Canary Island export season (from<br />
November to May each year) with an increase of<br />
5 % to 75 cents, but there were only 6 ships fixed<br />
of 420,000 to 440,000 cu ft instead of the usual 8.<br />
end 99<br />
end 00<br />
end 01<br />
end 02<br />
<strong>BRS</strong> - The Reefership Market in 2002<br />
93
94<br />
<strong>BRS</strong> - Shipping and Shipbuilding Markets <strong>2003</strong><br />
After that we had to wait until November for the<br />
“Majors” (Chiquita, Dole, DelMonte, Fyffes-Geest)<br />
to renew 12-month time charters at practically the<br />
same conditions as last year, namely 62 cents for<br />
the fastest ships with large deck capacity for<br />
containers and on average 57 cents for ships of<br />
450,000 to 500,000 cu ft (20 knots, 50–80 reefer<br />
plugs for containers on deck).<br />
For standard palletised ships of 400,000 to<br />
500,000 cu ft (18 knots, without container capacity)<br />
the market lingered around 40 cents for a 12<br />
month period, but fixtures for longer periods (over<br />
a year) remain a rarity, as operators prefer the pooling<br />
system rather than to take risks on hypothetical<br />
time charters.<br />
In the small sizes (about 200,000 to 250,000 cu ft)<br />
the market kicked off to a good first quarter then<br />
in April fell back compared to the previous year.<br />
The average yearly spot market was around 50<br />
cents.<br />
Conclusion<br />
The number of players in the market of conventional<br />
ships has been steadily shrinking. Two developments<br />
lie at the heart of this. First, organisations<br />
that have a monopoly on exports in the<br />
Southern Hemisphere have broken up and,<br />
second, containers have absorbed a share of the<br />
market, either on the deck of conventional reefer<br />
vessels, or on pure container vessels.<br />
The spot market depends in practice on a selected<br />
number of goods : fresh fruit such as bananas,<br />
citrus fruit, apples, pears, kiwis, and pineapples ;<br />
plus frozen chicken, mainly for bigger vessels and<br />
fish, generally for smaller ones.<br />
Russia continues to play a determinant role as a<br />
regular charterer of full ships in terms of bananas<br />
and fruit from the southern hemisphere and<br />
Morocco, as well as American poultry. The recent<br />
decision by Russians to acquire second-hand<br />
conventional ships will probably lead to a reduction<br />
in the number of fixtures on the spot market.<br />
Competition remains fierce between the two<br />
modes of transport (containers versus reefers) and<br />
will become increasingly selective. Whilst the<br />
container has taken a preponderant share in the<br />
meat, milk products, and seafood sectors, conventional<br />
refrigerated ships should be able to hold<br />
their position in transporting fruit between specialised<br />
ports and ports endowed with state-ofthe-art<br />
fruit terminals. The latter control loading<br />
programmes and focus on the re-distribution of<br />
fruit to its final destination, thus playing a role as<br />
a centre of distribution in a sector where the delivery<br />
into the product market is sometimes too<br />
complicated for liner owners to operate. To each<br />
his own business… ■
THE<br />
MARINE<br />
INSU<strong>RA</strong>NCE<br />
MARKETS<br />
IN<br />
2002<br />
The year 2001 was hit with the biggest single<br />
event in the history of insurance, now known<br />
as the “9/11”, provisionally some $32 to $50<br />
billion. One of the consequences has been the substantial<br />
increase in premiums in 2001 covering all<br />
sectors of the market. There was no way of foretelling<br />
an event of such dimensions and the premiums,<br />
which would have allowed insurers to meet<br />
such an eventuality, were far from being collected.<br />
Without specific premiums to cover claims, insurers<br />
have had to empty their reserves. Substantial<br />
resources have been brought into play by insurers<br />
to try to handle all claims being made. Very likely,<br />
insurers will fulfil their commitments and considerable<br />
indemnities have already been paid out.<br />
The market for marine insurance<br />
and transport<br />
The scope of losses generated over several years,<br />
certain risky underwriting and the fall in the financial<br />
markets, have either led to the disappearance<br />
of several insurance players (notably marine) or<br />
otherwise caused a plunge in the financial stan-<br />
“A series of disasters”<br />
ding of most insurance and re-insurance companies.<br />
To try to meet these new difficulties, the<br />
trend towards upping the premiums, begun in<br />
2000, has had to be extended with a substantial<br />
quickening of the pace in 2002.<br />
This reversal of the cycle has however not produced<br />
a strong growth since 1999 and the losses are far<br />
from being absorbed. A study carried out by Norwegian<br />
insurers and published by the IUMI in 2002<br />
shows that overall premiums for hull and cargo<br />
have increased but remain below the level of 1998.<br />
Prestige<br />
81,564 dwt tanker, blt 1976,<br />
sinking off spanish coast<br />
The Marine Insurance Markets in 2002<br />
95
96<br />
Shipping and Shipbuilding Markets <strong>2003</strong><br />
According to analysts of the London market, premiums<br />
are still insufficient to redress the balance.<br />
Premium evolution 1999-2001<br />
US$ million 2001 2000 1999<br />
Index*<br />
1999/2000<br />
Index*<br />
2000/2001<br />
Global Hull 2,811 2,860 2,765 -0.90% -1.70%<br />
Transport Cargo 6,224 6,622 6,752 -8.10% -5.90%<br />
Marine Liability 656 699 528 32.40% -6.00%<br />
Offshore/Energy 832 789 611 24.10% 5.40%<br />
Total 10,534 10,980 10,753 -2.60% -4.00%<br />
(IUMI – August 2002)<br />
* This index is based on 44 out of 55 members of IUMI who<br />
have published figures for their countries. It reflects the<br />
movements in marine market volumes of these countries but<br />
does not constitute an index for renewals. Certain countries<br />
do not list out their premiums by category, therefore the total<br />
of categories can be inferior to the overall total.<br />
Trends in marine and transport<br />
insurance in 2002<br />
At the beginning of the year, the relative improvement<br />
in the market gave some hope to marine insurers.<br />
In fact, premiums were increased by a considerable<br />
amount of around 15 % and for some<br />
owners, increases of over 100 % for premiums and<br />
also an increase of deductibles.<br />
Placing old fleets or small units (one or two ships)<br />
and/or presenting bad loss records to insurers, has<br />
become extremely difficult without increasing rates<br />
considerably and reducing the scope of cover tempting<br />
some players to work with insurers whose creditworthiness<br />
cannot always be counted on.<br />
Despite the broad scope of measures taken by insurers<br />
the year 2002 has proved to be a catastrophic vintage<br />
for European insurers in general including marine<br />
insurance. The two main reasons are as follows:<br />
First a bad series of accidents:<br />
During the months of September and October<br />
2002, some twenty major and particularly dramatic<br />
incidents absorbed between them nearly a third of<br />
the volume of annual premiums in marine insurance.<br />
The fire on the ‘Diamond Princess’, the attack<br />
on the ‘Limburg’, the running aground of the ‘Hual<br />
Europe’, ‘Ocean Lexington’ and ‘Treasure Bay’…<br />
came to more than $900 million in the books of<br />
marine insurers and their re-insurers.<br />
Globally the results of the Clubs, members of the IG Group are negative:<br />
$’000 20 Feb. 2002 20 Feb. 2001 20 Feb. 2000<br />
Underwriting Result<br />
And balance sheet results too :<br />
- 109,004 - 266,379 - 387,514<br />
Investment Income (net) - 50,121 90,569 360,096<br />
Forex,Tax, etc - 56,307 - 59,081 - 41,745<br />
Overall result<br />
Source : Elysian<br />
- 215,432 - 234,891 - 69,163<br />
Very few insurers have escaped this series of disasters,<br />
particularly as the misfortunes continued to<br />
carry on throughout the last two months of the<br />
year 2002 with notably:<br />
◆ November 11th 2002: fire on board the containership<br />
‘Hanjin Pennsylvania’ – a cost that could<br />
reach close to $100 million,<br />
◆ November 13th and 19th 2002: leak and shipwreck<br />
of the tanker ‘Prestige’ off the Spanish coast<br />
– a cost of some $ 42 million (including P&I),<br />
◆ December 1st 2002: fire on board the sail schooner<br />
‘Wind Song’ in Polynesia – costing $26 million<br />
(total loss),<br />
◆ December 14th 2002: collision in the English<br />
Channel between the containership ‘Kariba’ and<br />
the car-carrier ‘Tricolor’ - a cost which could slightly<br />
exceed $100 million.<br />
Even marine insurers, who might have been spared<br />
from any of the above catastrophes, are however<br />
deeply affected by the increase in re-insurance<br />
costs. The hike in re-insurance premiums is the<br />
result of disasters affecting the marine sector but<br />
also other sectors such as natural disasters where<br />
the losses, according to Munich Re, amount to $55<br />
billion in 2002 of which $11.5 billion are insured.<br />
Aviation insurance which has had a run of calamities<br />
(hull and liabilities) of more than $6 billion in<br />
2001, has turned around quickly in 2002 with total<br />
claims estimated at $1.06 billion.<br />
The P&I market is also affected. The P&I Club members<br />
of the International Group (IG Group) have not<br />
been spared by the losses over the last 3 years despite<br />
a relatively stable level of accident claims.<br />
For accounts ending February 20th 2002, it helps to<br />
distinguish 3 groups of clubs:<br />
◆ those more or less close to a balanced position<br />
(North, Gard, West),<br />
◆ the big losers (Swedish, London, UK, Britannia),<br />
◆ the “enhanced profit” group, namely American<br />
Club / Skuld and Steamship whose profits stem<br />
from the inclusion of results of the significant<br />
“excess calls” they made.<br />
The average increase in P&I premiums in 2002 was<br />
around 22 %, excluding excess calls imposed by<br />
some Clubs. Market analysts predict losses situated<br />
between $ 75 and $ 125 million for the underwriting<br />
year ending February 20 th <strong>2003</strong>.<br />
For renewals as from February 20 th <strong>2003</strong>, the Clubs<br />
have announced general increases of 15 to 25 %<br />
before re-insurance costs. The cost of the main programme<br />
of re-insurance of the IG Group has increased<br />
by about 40 %, this hike being differently<br />
apportioned according to the type of ship.
Secondly, the drop in Stock Exchange performances<br />
and its repercussions on the marine insurance<br />
world:<br />
The period when the financial results subsidised<br />
the technical underwriting deficits has definitely<br />
come to an end. The Dow Jones Stoxx Insurance<br />
index lost 51 % after having dropped by 30.5 % in<br />
2001. The first 10 European insurers (excluding<br />
ING) have lost 192.2 billion euros in stock valuation<br />
within a year. One has to add together the top<br />
eight European stock exchange capitalisation, to<br />
be able to match the number one in the world, the<br />
American AIG.<br />
The drop in the stock exchange market has continued<br />
in 2002, primarily due to a lack of confidence<br />
among investors following the shortcomings of big<br />
companies particularly in the U.S..<br />
The direct consequence for insurers (including)<br />
marine is the absolute necessity to get balanced<br />
technical results, without being able to count on<br />
hypothetical financial profits.<br />
At the same time, insurers have a tendency to look<br />
for additional protection from their reinsurers,<br />
whilst similarly, reinsurers have a tendency to reduce<br />
their risk exposure, thus their cover capacity, as<br />
they are themselves having a hard time to obtain<br />
the cover they would like from their retrocessionaires<br />
partners.<br />
It is becoming more and more difficult for insurers<br />
to balance the need for a return on investment and<br />
at the same time to satisfy their shareholders, while<br />
keeping sufficiently strong capital reserves as<br />
demanded by their clients.<br />
In such an unfavourable context and in an increasingly<br />
uncertain climate, especially with the terrorist<br />
threats, insurers have come out with what could be<br />
called a “survival guide”:<br />
◆ a more restrictive underwriting policy with as<br />
consequence a lack of capacity,<br />
◆ an increase in retention,<br />
◆ coverages which are sometimes more restrictive<br />
with notably the introduction of new exclusions:<br />
- Institute Extended Radioactive Contamination<br />
Exclusion Clause 01/11/02 (Cl. 356 A),<br />
- Institute Chemical, Biological, Bio-Chemical, Electromagnetic<br />
Weapons and Cyber Attack Exclusion<br />
Clause 01/11/02 (Cl. 365).<br />
The French market preserves<br />
its financial standing<br />
Despite a fairly depressing year 2002, the main<br />
French companies involved in marine insurance<br />
have put up a good resistance in the face of exceptional<br />
deteriorating conditions.<br />
They have posted solvency ratios above European<br />
norms and the French market remains one of the<br />
world top markets.<br />
◆ French insurance market is number 5 within<br />
world rankings, 2nd in Europe for life insurance, and<br />
3rd in damage insurance.<br />
◆ French insurance remains 2nd in the placement of<br />
“International hulls” in the world (excluding Japan<br />
which is mainly domestic).<br />
◆ French credit insurance is number 1 in the world.<br />
French companies in the market have a capacity to<br />
adapt and have advantages linked to their size and<br />
geographical coverage. Nonetheless they remain<br />
cautious as to the future development in their operational<br />
performance, given the volatility and uncertainties<br />
in the financial markets.<br />
Current difficulties are causing a new change in<br />
outlook and are upsetting the classical approach to<br />
risk finance. The catastrophes of the last two years<br />
have forced insurers to reorganise themselves, to<br />
reinforce their capital reserves and improve their<br />
management skills.<br />
Owners and other clients<br />
In the particularly dismal context of marine insurance,<br />
where many players are fighting for their survival,<br />
actors in the shipping sector are also being<br />
subjected to their own constraints within the market.<br />
Operating ships is becoming more and more<br />
costly, as much with international standards, which<br />
are raising levels of responsibility of owners as with<br />
the reinforced rules of security.<br />
Insurers, who want to be attentive and selective in<br />
their commitments, do not directly control either<br />
the security or the quality of shipping operations or<br />
the qualification of crews.<br />
Due to this situation, insurers are tending to impose<br />
technical constraints and supplementary charges<br />
to their clients by introducing loss prevention programmes.<br />
Nonetheless an intelligent and practical collaboration<br />
between insurers and owners can also make<br />
a considerable contribution towards market<br />
results. The role of an insurance broker in establishing<br />
a better communication between parties<br />
and an appreciation of the constraints and susceptibilities<br />
of both parties, should make for better<br />
competitiveness and an improved quality of<br />
services offered. ■<br />
The Marine Insurance Markets in 2002<br />
97
98<br />
Shipping and Shipbuilding Markets <strong>2003</strong><br />
Cap-Marine<br />
Assurances & Réassurances S.A.<br />
Shipping and transport insurance and re-insurance broker<br />
Headquarter<br />
4/12, Bd des Belges - BP n° 10 - 76001 Rouen Cedex - France<br />
Tel : + 33 (0)2 35 98 26 46 - Fax: + 33 (0)2 35 98 32 58 - E.mail : rouen@cap-marine.com<br />
Paris office<br />
32, rue Notre-Dame des Victoires - 75002 Paris - France<br />
Tel : + 33 (0)1 53 00 94 00 - Fax: + 33 (0)1 53 00 94 10 - E.mail : paris@cap-marine.com<br />
Nantes office<br />
92, quai de la Fosse - BP n°78704 - 44187 Nantes Cedex 4 - France<br />
Tel : + 33 (0)2 40 69 31 96 - Fax: + 33 (0)2 40 69 29 55 - E.mail : nantes@cap-marine.com
FRENCH SHIPYARDS<br />
DELIVERIES AND ORDERBOOK<br />
IN 2002<br />
Chantiers de l’Atlantique<br />
Ships delivered in 2002<br />
U 31 Constellation 2002 Royal Caribbean Cruises<br />
Cruise vessel 91,000 gt – 1,019 cabins 294 m x 32.20 m on 8.50 m<br />
1,950 lower berths Gas / Steam turbines - POD 39,000 kW 24 K.<br />
X 31 European Stars 2002 Festival Cruises<br />
Cruise vessel 58,600 gt – 783 cabins 251 m x 28.80 m on 6.60 m<br />
1,566 lower berths POD 2 x 10,000 kW 21.7 K.<br />
A 32 Mohammed V 2002 Moroccan Royal Navy<br />
Frigate 2,950 gt 93.67 m x 14 m on 4.01 m<br />
4 x 2,400 kW 20.5 K.<br />
C 32 Coral Princess 2002 P&O Princess Cruises<br />
Cruise vessel 88,000 gt – 987 cabins 294 m x 32.20 m on 8.00 m<br />
1,950 lower berths Diesel electric - 2 x 20,000 kW 24 K.<br />
Ships on order as at 1/1/<strong>2003</strong><br />
B 32 Hassan II <strong>2003</strong> Moroccan Royal Navy<br />
Frigate 2,730 gt 93.67 m x 14 m on 4.01 m<br />
4 x 2,400 kW 20.5 K.<br />
D 32 Island Princess <strong>2003</strong> P&O Princess Cruises<br />
Cruise vessel 88,000 gt – 987 cabins 294 m x 32.20 m on 8.00 m<br />
1,950 lower berths Diesel electric - 2 x 20,000 kW 24 K.<br />
G 32 Queen Mary 2 <strong>2003</strong> Cunard<br />
Cruise vessel 150,000 gt – 1,310 cabins 345 m x 40 m on 10.00 m<br />
2,620 lower berths POD 4 x 20,000 kW each 29.35 K.<br />
H 32 Crystal Serenity <strong>2003</strong> NYK<br />
Cruise vessel 68,000 gt – 550 cabins 250 m x 32.20 m on 7.60 m<br />
1,080 lower berths 2 x 13,000 kW 22.75 K.<br />
I 32 Mistral 2004 DCN<br />
J 32 Tonnerre 2005 -<br />
LPD 199 m x 32 m on 6.20 m<br />
Diesel electric - 15,000 kW 19 K.<br />
K 32 MSC Lirica <strong>2003</strong> MSC<br />
L 32 MSC Opera 2004 -<br />
Cruise vessels 58,600 gt – 765 cabins 251 m x 28.80 m on 6.60 m<br />
1,530 lower berths 2 x 10,000 kW 21.7 K.<br />
M 32 Gaz de France Energy 2004 Gaz de France<br />
LNG tanker 74,130 cbm 219.50 m x 34.95 m on 9.33 m<br />
Diesel gas electric - 18,560 kW 18.20 K.<br />
French Shipyards Deliveries and Orderbook<br />
99
100<br />
Alstom Leroux Naval<br />
Shipping and Shipbuilding Markets <strong>2003</strong><br />
Ship on order as at 1/1/<strong>2003</strong><br />
827 Beautemps-Baupre <strong>2003</strong> DGA<br />
Research vessel 80.60 m x 14.90 m on 6.20 m<br />
Accomodations : 25 pers. Mitusubishi diesel electric - 4 x 1,000 kW 14.50 K.<br />
Constructions Mécaniques de Normandie<br />
Ships delivered in 2002<br />
Heloval 2002 Société Maritime Héloval<br />
Motor yacht 42.10 m x 8.60 m on 2.75 m<br />
Caterpillar 3508B M.E. - 2 x 895 kW 13.8 K.<br />
- 2002 CFT<br />
- 2002 -<br />
Tank barges 637 t - 3,000 t 79.00 m x 11.40 m<br />
- 2002 CFT<br />
Tank barge 660 t - 3,130 t 82.50 m x 11.40 m<br />
Ships on order as at 1/1/<strong>2003</strong><br />
Lady B <strong>2003</strong> Sugiton<br />
Catamaran 32 m x 14 m on 1.80 m to 4.50 m<br />
Yanmar 6LY2-STE M.E. - 2 x 309 kW 18 K.<br />
- <strong>2003</strong><br />
105 foot sailing ship 31.50 m x 7.20 m<br />
Cummins CTA 8 300 bhp 11 K.<br />
Mari-Cha IV <strong>2003</strong><br />
Racing sailing ship 43.00 m x 9.00 m<br />
Vigilente <strong>2003</strong> Affaires maritimes<br />
Patrol boat 52.50 m x 9.00 m on 2.80 m<br />
MTU 16V 4000M 70 21 K.
Chantiers Piriou<br />
Ships delivered in 2002<br />
C237 Albius 2002 Armement Sapmer<br />
C238 Cap Horn I 2002 Armement Cap Bourbon<br />
C240 Ile de la Réunion 2002 Comata - La Reunion<br />
Long liners 55.49 m x 11 m<br />
Caterpillar M.E. - 1,800 kW at 720 rpm 15 K.<br />
C241 Jean Louis Vincent 2002 Scotto - Sete<br />
Fishing boat 24.90 m x 7.20 m<br />
ABC at 316 kW<br />
C242 Surfer 198 2002 Surf<br />
Crew boat 19.20 m x 6.00 m<br />
Man 2842 LE 3 x 560 kW 28 K.<br />
C243 Surfer 254 2002 Surf<br />
C247 Surfer 255 2002 -<br />
Crew boats 25.95 m x 6.20 m<br />
MTU 12V 183 TE 72 4 x 610 kW 28 K.<br />
C244 Nuevo Panchilleta<br />
C245 Nuevo Elorz 2002 Fuentes<br />
Tuna purse seiners 43.15 m x 9.50 m<br />
Caterpillar 2 x 811 bhp<br />
Ships on order as at 1/1/<strong>2003</strong><br />
250 Cap Saint Georges 2004 Armement Le Garrec<br />
Trawler 44 m x 11 m<br />
Mak 1,850 kW<br />
252 - <strong>2003</strong> Surf<br />
253 - <strong>2003</strong> -<br />
Fast Intervention Support vessels 53.55 m x 10 m on 2.35 m<br />
4 KTA 50-2 - 5,372 kW 27 K.<br />
256 2004 Surf<br />
AHTS UT 721 1,500 dwt 69.70 m x 17.20 m on 6.10 m<br />
2,600 gt 4 BERGEN BMH8 x 3,600 bhp DP 2 FIFI 1 16 K.<br />
259 <strong>2003</strong> Les Abeilles<br />
Tug 30.30 m x 10.40 m on 4.50 m<br />
(diesel) 2 ABC 8 D2C - 1,766 kW 12 K.<br />
French Shipyards Deliveries and Orderbook<br />
101
102<br />
Ships delivered in 2002<br />
Shipping and Shipbuilding Markets <strong>2003</strong><br />
FRENCH ORDERS<br />
TO FOREIGN SHIPYARDS<br />
IN 2002<br />
Treci Maj (Croatia)<br />
679 Bro Ellen 2002 Broström Tankers SA<br />
Product and chemical tanker 37,300 dwt - 16 tanks 184 m x 30 m on 10.5 m<br />
IMO II Sulzer 7,900 kW 15 K.<br />
Orskov (Denmark)<br />
221 N' Zinga 2002 Surf<br />
236 N' Duva 2002 -<br />
Platform supply vessels 72 m x 16 m on 5.90 m<br />
UT 755L Bergen KR MB 9 2 x 2,005 kW 14.5 K.<br />
Fincantieri (Italy)<br />
6081 Danielle Casanova 2002 SNCM<br />
Ro-ro passenger ferry 44,500 gt - 2,204 pass. 175 m x 30.40 m on 6.60 m<br />
Wärtsila 9L46C type 37,800 kW 23 K.<br />
Niestern Sander (Netherlands)<br />
814 Adour 2002 Petromarine<br />
Product and chemical tanker 14,800 dwt 140 m x 21 m on 8.06 m<br />
IMO II MAK 6M43 5,400 kW 13.5 K.<br />
Van der Giessen de Noord (Netherlands)<br />
985 Mont-Saint-Michel 2002 Brittany Ferries<br />
Ro-ro passenger ferry 34,800 gt 173.40 m x 28.50 m on 6.20 m<br />
2,120 pass. 21,600 kW 21.5 K.<br />
Viana do Castelo (Portugal)<br />
211 FS Vanessa 2002 Fouquet Sacop<br />
Product and chemical tanker 15,500 dwt 140 m x 23 m on 8.30 m<br />
IMO II MAK 6,300 kW 14 K.<br />
Astilleros Zamakona SA (Spain)<br />
C-505 La Gironde 2002 Conseil Général de la Gironde<br />
Double end ferry 3,324 gt - 600 pass. 71 m x 18.30 m on 2.60 m<br />
135 cars 4 x 950 kW 14 K.<br />
Izar (Spain)<br />
365 Daniel Laval 2002 GIE Dragage-Ports<br />
Trailing suction hopper 7,000 dwt - 5,000 cum 104 m x 22 m on 6.00 m<br />
Dredger 2 x Wärtsila-9L26A 2,925 kW / 2,700 kW 13 K.<br />
366 Samuel de Champlain 2002 GIE Dragage-Ports<br />
Trailing suction hopper 12,150 dwt - 8,500 cum 117 m x 24 m on 8.00 m<br />
Dredger 2 x Wärtsila-CW16V200 2 x 3,200 kW 13 K.<br />
Yardimci (Turkey)<br />
25 FS Diane 2002 Fouquet Sacop<br />
Product and chemical tanker 10,048 dwt 118.37 m x 19 m on 8.22 m<br />
MAN-B&W 4,440 kW 14 K.<br />
Nacks (China)<br />
008 Orientor 2 2002 Setaf-Saget<br />
Bulk carrier 47,980 dwt 187.50 m x 31 m on 11.75 m<br />
MAN-B&W 6,880 kW 16 K.
Zhejiang (China)<br />
093 Artha 2002 Petromarine<br />
Bitumen tanker IMO II 4,300 dwt 106.30 m x 15.80 m on 6.00 m<br />
MAK 2,880 kW 14 K.<br />
Keppel (Singapore)<br />
3637 Athena 2002 Surf<br />
MPSV 2,600 dwt 86.80 m x 73.50 m on 6.00 m<br />
VS 4501 MAK 2 x 4,320 kW 14 K.<br />
Hanjin (South Korea)<br />
098 René Descartes 2002 FT Marine<br />
Cable layer 8,150 dwt 142.50 m x 22 m on 7.40 m<br />
13,500 gt 16,400 kW 16 K.<br />
099 CMA CGM Eiffel 2002 CMA CGM<br />
100 CMA CGM Puget 2002 -<br />
Container carriers 58,000 dwt - 4,367 teu 280 m x 32.26 m on 13.00 m<br />
24 K.<br />
652 Elisa Delmas 2002 Delmas<br />
653 Flora Delmas 2002 -<br />
654 Gaby Delmas 2002 -<br />
Container carriers 21,200 dwt - 1,634 teu 168.00 m x 27.20 m on 9.21 m<br />
MAN-BW 15,805 kW 20.5 K.<br />
Hyundai Mipo (South Korea)<br />
002 Ile de Batz 2002 J/V Alda Marine<br />
030 Ile de Bréhat 2002 -<br />
Cable layers 8,200 dwt 139.70 m x 23.40 m on 7.20 m<br />
DP II Diesel electr. 16,000 kW 15.5 K.<br />
013 Kerel 2002 Socatra<br />
Product tanker 37,000 dwt 185.50 m x 27.34 m on 11.20 m<br />
IMO III 9,400 kW 15 K.<br />
Samho (South Korea)<br />
1033 Kergoat 2002 Socatra<br />
Product tanker 7,500 dwt 115 m x 19.40 m on 6.50 m<br />
Wärtsilä - twin screw 4,440 kW 13.5 K.<br />
China SB (Taiwan)<br />
773 Marie Delmas 2002 Delmas<br />
774 Catherine Delmas 2002 -<br />
775 Nicolas Delmas 2002 -<br />
776 Julie Delmas 2002 -<br />
Container carriers 31,000 dwt - 2,226 teu 195.60 m x 30.20 m on 10.50 m<br />
B&W 17,506 kW 22 K.<br />
Ships on order as at 1/1/<strong>2003</strong><br />
Meyer Werft (Germany)<br />
Pont-Aven 2004<br />
Roro passenger ferry 40,000 gt – 650 cabins 185 m x 31 m<br />
2,200 pass. 58,000 bhp 27 K.<br />
Damen (Netherlands)<br />
511205 <strong>2003</strong> Surf<br />
511206 <strong>2003</strong> -<br />
511207 <strong>2003</strong> -<br />
ASD-Tugs 32.22 m x 11.70 m on 5.30 m<br />
2 Ulstein Bergen 4,060 bhp 12.7 K.<br />
Niestern Sander (Netherlands)<br />
815 Dordogne <strong>2003</strong> Petromarine<br />
Product and chemical tanker 14,800 dwt 140 m x 21 m on 8.06 m<br />
IMO II MAK 6M43 5,400 kW 14 K.<br />
816 2004 CMN<br />
Research vessel 101.75 m x 15.85 m<br />
Accomodations : 110 crew 2 x 2,970 kW 16.3 K.<br />
French Orders to Foreing Shipyards 103
104<br />
Shipping and Shipbuilding Markets <strong>2003</strong><br />
Van der Giessen de Noord (Netherlands)<br />
988 Pascal Paoli <strong>2003</strong> SNCM<br />
Freight passenger ferry 35,000 gt 176 m x 30.50 m on 6.60 m<br />
2,260 pass. 37,800 kW 23 K.<br />
De Hoop International Lobith (Netherlands)<br />
393 2004 Surf<br />
Maintenance vessel 77.30 m x 18 m on 5.00 m<br />
4 x 1,425 kW 13 K.<br />
212 FS Thais <strong>2003</strong> Fouquet Sacop<br />
Product and chemical tanker 15,500 dwt 140 m x 23 m on 8.30 m<br />
IMO II MAK 6,300 kW 14 K.<br />
Aker Brattvaag (Norway)<br />
104 2004 Surf<br />
PSV UT 755 L 72 m x 16 m on 5,91 m<br />
2 x 2,005 kW<br />
Yardimci (Turkey)<br />
26 FS Mila <strong>2003</strong> Fouquet Sacop<br />
Product and chemical tanker 10,048 dwt 118.37 m x 19 m on 8.22 m<br />
IMO II MAN-B&W 4,440 kW 14 K.<br />
Jinling (China)<br />
02-0503 2004 Broström Tankers SA<br />
02-0504 2004 -<br />
Product and chemical tankers 37,500 dwt 185 m x 31 m on 9.50 m<br />
IMO II MAN-B&W 8,580 kW<br />
JLZ020401 Sea Plane One 2004 Louis Dreyfus / Hoegh<br />
Roro carrier 5,200 dwt 150 m x 24 m on 6.60 m<br />
2 x 8,400 kW<br />
Nacks (China)<br />
O26 2004 Setaf-Saget<br />
Bulk carrier 55,000 dwt 189 m x 32.26 m on 11.10 m<br />
MAN-B&W 8,200 kW 15.9 K.<br />
Samsung (South Korea)<br />
1457 2004 CMA CGM<br />
1458 2004 -<br />
1459 2004 -<br />
1460 2004 -<br />
1461 2004 -<br />
1462 2004 -<br />
1463 2004 -<br />
1464 2004 -<br />
Container carriers 72,500 dwt - 5,700 teu 263 m x 40 m on 14.50 m<br />
MAN-B&W 26 K.<br />
STX (South Korea)<br />
1131 2004 Socatra<br />
1132 2005 -<br />
Product tankers IMO III 45,800 dwt 183 m x 32.20 m on 11.00 m<br />
MAN-B&W 11,640 bhp 14.5 K.<br />
China SB (Taiwan)<br />
777 Louis Delmas <strong>2003</strong> Delmas<br />
778 Irma Delmas <strong>2003</strong> -<br />
Container carriers 31,000 dwt - 2,226 teu 195.60 m x 30.20 m on 10.50 m<br />
B&W 17,506 kW 22 K.<br />
796 CMA CGM Saint Louis <strong>2003</strong> CMA CGM<br />
797 CMA CGM Saint Pierre <strong>2003</strong> -<br />
798 CMA CGM Sainte Marie <strong>2003</strong> -<br />
799 CMA CGM Saint Georges 2004 -<br />
Container carriers 30,450 dwt - 2,200 teu 197.70 m x 30.20 m on 10.50 m<br />
17,506 kW 21.5 K.
Shipbrokers since 1856<br />
12-14, Rond-Point des Champs-Élysées - 75008 PARIS<br />
Phone : 33 (0)1 44 35 12 34<br />
E-mail : info@brs-paris.com - Web site : www.brs-paris.com<br />
Fax E-mail<br />
Newbuilding 33 (0) 1 44 35 13 59 newbuilding@brs-paris.com<br />
Sale & Purchase 33 (0) 1 44 35 11 29 snp@brs-paris.com<br />
Dry Bulk 33 (0) 1 44 35 12 29 bulk@brs-paris.com<br />
Liner 33 (0) 1 44 35 11 49 liner@brs-paris.com<br />
Tanker 33 (0) 1 53 76 07 19 tanker@brs-paris.com<br />
Chemical 33 (0) 1 44 35 13 49 chemical@brs-paris.com<br />
Gas 33 (0) 1 44 35 11 08 gas@brs-paris.com<br />
Offshore 33 (0) 1 44 35 13 59 offshore@brs-paris.com<br />
Research 33 (0) 1 44 35 13 79 rsc@brs-paris.com