Palo Alto Economic Development Strategies

Create successful ePaper yourself
Turn your PDF publications into a flip-book with our unique Google optimized e-Paper software.
Millions<br />
BUSINESS ENVIRONMENT ASSESSMENT<br />
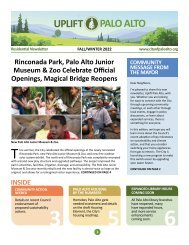
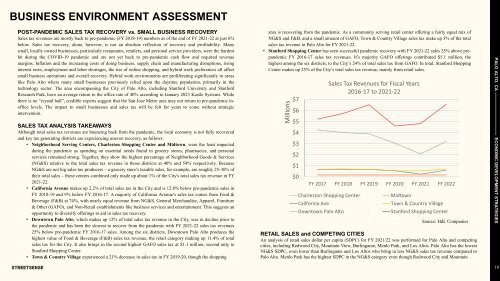
POST-PANDEMIC SALES TAX RECOVERY vs. SMALL BUSINESS RECOVERY<br />
Sales tax revenues are mostly back to pre-pandemic (FY 2018-19) numbers as of the end of FY 2021-22 at just 6%<br />
below. Sales tax recovery, alone, however, is not an absolute reflection of recovery and profitability. Many<br />
small, locally owned businesses, particularly restaurants, retailers, and personal service providers, were the hardest<br />
hit during the COVID-19 pandemic and are not yet back to pre-pandemic cash flow and required revenue<br />
margins. Inflation and the increasing costs of doing business, supply chain and manufacturing disruptions, rising<br />
interest rates, employment and labor shortages, the rise of online shopping, and hybrid work preferences all affect<br />
small business operations and overall recovery. Hybrid work environments are proliferating significantly in areas<br />
like <strong>Palo</strong> <strong>Alto</strong> where many small businesses previously relied upon the daytime population, primarily in the<br />
technology sector. The area encompassing the City of <strong>Palo</strong> <strong>Alto</strong>, including Stanford University and Stanford<br />
Research Park, have an average return to the office rate of 40% according to January 2023 Kastle Systems. While<br />
there is no “crystal ball”, credible experts suggest that the San Jose Metro area may not return to pre-pandemic inoffice<br />
levels. The impact to small businesses and sales tax will be felt for years to come without strategic<br />
intervention.<br />
SALES TAX ANALYSIS TAKEAWAYS<br />
Although total sales tax revenues are bouncing back from the pandemic, the local economy is not fully recovered<br />
and key tax generating districts are experiencing uneven recovery, as follows:<br />
• Neighborhood Serving Centers, Charleston Shopping Center and Midtown, were the least impacted<br />
during the pandemic as spending on essential needs found in grocery stores, pharmacies, and personal<br />
services remained strong. Together, they show the highest percentage of Neighborhood Goods & Services<br />
(NG&S) relative to the total sales tax revenue in those districts at 40% and 54% respectively. Because<br />
NG&S are not big sales tax producers – a grocery store’s taxable sales, for example, are roughly 25-30% of<br />
their total sales – these centers combined only made up about 1% of the City's total sales tax revenue in FY<br />
2021-22.<br />
• California Avenue makes up 2.2% of total sales tax in the City and is 12.8% below pre-pandemic sales in<br />
FY 2018-19 and 9% below FY 2016-17. A majority of California Avenue’s sales tax comes from Food &<br />
Beverage (F&B) at 74%, with nearly equal revenue from NG&S, General Merchandise, Apparel, Furniture<br />
& Other (GAFO), and Non-Retail establishments like business services and entertainment. This suggests an<br />
opportunity to diversify offerings to aid in sales tax recovery.<br />
• Downtown <strong>Palo</strong> <strong>Alto</strong>, which makes up 12% of total sales tax revenue in the City, was in decline prior to<br />
the pandemic and has been the slowest to recover from the pandemic with FY 2021-22 sales tax revenues<br />
25% below pre-pandemic FY 2016-17 sales. Among the six districts, Downtown <strong>Palo</strong> <strong>Alto</strong> produces the<br />
highest value of Food & Beverage (F&B) sales tax revenue, the retail category making up 11.4% of total<br />
sales tax for the City. It also brings in the second highest GAFO sales tax at $1.1 million, second only to<br />
Stanford Shopping Center.<br />
• Town & Country Village experienced a 21% decrease in sales tax in FY 2019-20, though the shopping<br />
area is recovering from the pandemic. As a community serving retail center offering a fairly equal mix of<br />
NG&S and F&B, and a small amount of GAFO, Town & Country Village sales tax make up 3% of the total<br />
sales tax revenue in <strong>Palo</strong> <strong>Alto</strong> for FY 2021-22.<br />
• Stanford Shopping Center has seen successful pandemic recovery with FY 2021-22 sales 25% above prepandemic<br />
FY 2016-17 sales tax revenues. It’s majority GAFO offerings contributed $5.1 million, the<br />
highest among the six districts, to the City’s 24% of total sales tax from GAFO. In total, Stanford Shopping<br />
Center makes up 25% of the City’s total sales tax revenue, mainly from retail sales.<br />
$7<br />
$6<br />
$5<br />
$4<br />
$3<br />
$2<br />
$1<br />
$0<br />
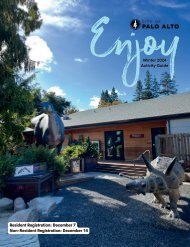
Sales Tax Revenues for Fiscal Years<br />
2016-17 to 2021-22<br />
FY 2017 FY 2018 FY 2019 FY 2020 FY 2021 FY 2022<br />
Charleston Shopping Center<br />
California Ave<br />
Downtown <strong>Palo</strong> <strong>Alto</strong><br />
Midtown<br />
Town & Country Village<br />
Stanford Shopping Center<br />
Source: HdL Companies<br />
RETAIL SALES and COMPETING CITIES<br />
An analysis of retail sales dollar per capita (SDPC) for FY 2021/22 was performed for <strong>Palo</strong> <strong>Alto</strong> and competing<br />
cities, including Redwood City, Mountain View, Burlingame, Menlo Park, and Los <strong>Alto</strong>s. <strong>Palo</strong> <strong>Alto</strong> has the lowest<br />
NG&S SDPC, even lower than Burlingame and Los <strong>Alto</strong>s who bring in less NG&S sales tax revenue compared to<br />
<strong>Palo</strong> <strong>Alto</strong>. Menlo Park has the highest SDPC in the NG&S category even though Redwood City and Mountain<br />
PALO ALTO, CA —————————— ECONOMIC DEVELOPMENT STRATEGIES<br />
10