2023 11 17 WHO WE ARE

You also want an ePaper? Increase the reach of your titles
YUMPU automatically turns print PDFs into web optimized ePapers that Google loves.
Operated by:<br />
QUALITY OF LIFE:<br />
<strong>WHO</strong> <strong>WE</strong> <strong>ARE</strong>
][<br />
Quality of Life Subcommittee<br />
Dariel Bateman<br />
Beth Blowes<br />
Jeneane Fast<br />
Kehlar Hillyer<br />
Leah Kennedy<br />
Joelle Lamport-Lewis<br />
Barb Leavitt<br />
Robin Spence Haffner<br />
Jennifer Rojas<br />
Nancy Summers<br />
Kathy Vassilakos<br />
Special thanks given to advisors<br />
from Huron Perth Public Health:<br />
Erica Clark, PhD<br />
Angela Willert<br />
The Social Research & Planning Council is funded by:<br />
City of Stratford, Town of St. Marys,<br />
County of Perth, through the Department of Social Services,<br />
the County of Huron, and United Way Perth-Huron.<br />
Thank you to all the community partners who<br />
contributed to this project. We value your contribution.<br />
Social Research & Planning Council<br />
United Centre, 32 Erie St., Stratford, ON N5A 2M4<br />
Tel: 519-271-7730<br />
Email: srpc@perthhuron.unitedway.ca<br />
www.perthhuron.unitedway.ca/social-research-planning-council
Who We Are<br />
In this section, you will find demographic statistics from the<br />
most recent Census of Canada (2021) and a few estimators from<br />
Environics Analytics. Understanding the demographics of a<br />
community is like having a roadmap to meet unique needs. Who<br />
We Are provides crucial information about the people who make<br />
up the Perth-Huron region. Knowledge and understanding of<br />
details such as age, gender, family composition and geography<br />
help tailor programs and services that resonate with the<br />
community’s specific needs.<br />
Page 3 Demographics
Perth & Huron Counties<br />
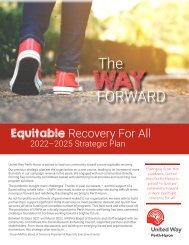
The counties of Perth and Huron are located in southwestern<br />
Ontario. Huron County borders the southeast shore of Lake<br />
Huron and Perth County is located to the east of Huron. Together<br />
with Bruce and Grey Counties, they make up the Stratford-Bruce<br />
Peninsula Economic Region. Perth County is on the traditional<br />
territory of the Mississauga, Anishinaabe, Haudenosaunee<br />
(Iroquois) and Attiwandaronk (Neutral) peoples. Huron County<br />
is on the traditional territory of the Haudenosaunee (Iroquois),<br />
Ojibway/Chippewa, Attiwandaronk (Neutral) and Anishinaabe<br />
peoples. The territory of Perth and Huron is covered by the Huron<br />
Tract registered as Treaty 29 in the Upper Canada Treaties of 1827<br />
and by the Saugeen Tract registered as Treaty 45 ½ in 1836.<br />
Identified as a rural area, Perth-Huron is a rich agricultural region<br />
with more than 4,850 farms and around 8<strong>11</strong>,637 farm area-acres;<br />
two-thirds of which are in Huron County. 1<br />
As significant population centres, the City of Stratford and the<br />
Town of St. Marys are within the Perth County census division.<br />
However, they have their own single-tier municipal governments.<br />
Goderich is identified as Huron County’s largest community.<br />
Land Area & Dwellings Characteristics Perth Huron Stratford<br />
Total private dwellings* 34,062 29,455 15,388<br />
Population density per square kilometre 36.8 18.1 1,107.0<br />
Land area in square kilometeres 2,218 3,398 30.02<br />
Private dwellings occupied by usual residents** 32,772 25,334 14,743<br />
Table 1<br />
Source: Statistics Canada, Census 2021. Population and dwellings section.<br />
* Private dwelling refers to a separate set of living places with a private entrance either from<br />
outside the building or from a common hall, lobby, vestibule or stairway inside the building.<br />
** A private dwelling occupied by usual residents refers to a private dwelling in which a<br />
person or a group of persons is permanently residing.<br />
Page 4 Who We Are
Diagram 1: Borders of Southwestern Ontario<br />
Source: 2 3 4<br />
Map features are an approximate representation and are not intended to provide a high level of<br />
accuracy
Population Size and Growth<br />
According to the last three censuses, Canada is maintaining a<br />
consistent rate of growth. Overall, the population changed by 5.2%.<br />
However, Ontario has a more rapid increase of 5.8%. 5<br />
Canada<br />
Census Population Population<br />
Change<br />
Census<br />
Ontario<br />
Population Population<br />
Change<br />
20<strong>11</strong> 33,476,688 20<strong>11</strong> 12,851,821<br />
5%<br />
4.60%<br />
2016 35,151,728 2016 13,448,495<br />
5.20%<br />
5.80%<br />
2021 36,991,981 2021 14,223,942<br />
Table 2: Population Change, Canada-Ontario<br />
Source: Statistics Canada, Census 20<strong>11</strong>, 2016 and 2021. Population and dwellings section.<br />
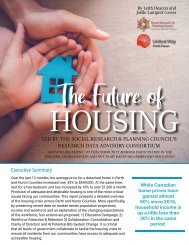
Perth Expected to Have a Greater Population<br />
Increase Than Huron by 2032<br />
According to the most recent census (2021), 81,565 and 61,366<br />
people live in Perth and Huron respectively. The population has<br />
increased by 6,822 new people and Huron had a smaller increase<br />
than Perth. Some municipalities have declined in population over<br />
the last few years. Based on some estimates, the total population<br />
in Perth-Huron will change by <strong>11</strong>% in 2032. 6<br />
Perth-Huron<br />
population<br />
increased by<br />
6,822<br />
in five years<br />
Graph 1: Total Population, 20<strong>11</strong>–2021, Perth-Huron<br />
Source: Statistics Canada, Census 20<strong>11</strong>, 2016 and 2021. Population and dwellings section.<br />
100,000<br />
90,000<br />
80,000<br />
75,<strong>11</strong>2 76,812<br />
81,565<br />
88,141<br />
85,992<br />
93,450<br />
70,000<br />
60,000<br />
59,100 59,297<br />
61,366<br />
63,681 64,6<strong>11</strong><br />
66,822<br />
50,000<br />
40,000<br />
30,000<br />
20,000<br />
10,000<br />
0<br />
20<strong>11</strong> 2016 2021 2025 2027 2032<br />
Page 4 Who We Are<br />
Perth Huron
Central Population 2016 2021 % Change<br />
PERTH 76,812 81,565 6.20%<br />
North Perth 13,130 15,538 18.30%<br />
Perth East 12,277 12,595 2.60%<br />
Perth South 3,805 3,776 -0.80%<br />
St. Marys 7,265 7,386 1.70%<br />
Stratford 31,470 33,232 5.60%<br />
West Perth 8,865 9,038 2.00%<br />
HURON 59,297 61,366 3.50%<br />
Ashfield-Colborne-Wawanosh 5,422 5,884 8.50%<br />
South Huron 10,096 10,063 -0.30%<br />
North Huron 4,932 5,052 2.40%<br />
Morris-Turnberry 3,496 3,590 2.70%<br />
Huron East 9,138 9,512 4.10%<br />
Howick 3,873 4,045 4.40%<br />
Goderich 7,628 7,881 3.30%<br />
Central Huron 7,576 7,799 2.90%<br />
Bluewater 7,136 7,540 5.70%<br />
Table 3: Population Growth by Central Populations, 2016–2021<br />
Source: Statistics Canada, Census 2016 and 2021. Census subdivision. Population and<br />
dwellings section.
The Median Age in Perth and Huron<br />
is Higher Than the Province<br />
The current median age is 42.4 in Perth and 46.8 in Huron; both<br />
higher than the provincial median of 41.6. The median age in the area<br />
hasn’t changed over the last five years. The distribution of population<br />
across broad age categories has not changed significantly. The<br />
proportion of the population aged 65 and older is projected to<br />
increase by 2032. Individuals aged 60–64 are the largest percentage<br />
of the population. 7<br />
Diagram 2: Age of Population, Perth-Huron 2021<br />
Source: Statistics Canada, Census 2021. Age characteristics.<br />
<strong>17</strong> % 59%<br />
2 1%<br />
3%<br />
0-14 Years<br />
15-64 years 65 to 84 years<br />
85 years+
Graph 2: Population by Age and Gender* distribution, Perth-Huron, 2021<br />
Source: Statistics Canada, Census 2021. Age characteristics.<br />
100 years and over<br />
95 to 99 years<br />
90 to 94 years<br />
85 to 89 years<br />
80 to 84 years<br />
75 to 79 years<br />
70 to 74 years<br />
65 to 69 years<br />
60 to 64 years<br />
Age group<br />
55 to 59 years<br />
50 to 54 years<br />
45 to 49 years<br />
40 to 44 years<br />
35 to 39 years<br />
30 to 34 years<br />
25 to 29 years<br />
20 to 24 years<br />
15 to 19 years<br />
10 to 14 years<br />
5 to 9 years<br />
0 to 4 years<br />
-10.0% -8.0% -6.0% -4.0% -2.0% 0.0% 2.0% 4.0% 6.0% 8.0% 10.0%<br />
Population<br />
Women+<br />
Men+<br />
*Gender refers to an individual’s personal and social identity as a<br />
man, woman or non‐binary person (a person who is not exclusively<br />
a man or a woman). Some people may not identify with a specific<br />
gender. Beginning in 2021, the variable “gender” is expected to<br />
be used by default in most social statistics. However, the “+”<br />
sign covers other identities that may not be disaggregate due to<br />
the sampling. Men+ includes men, boys and some non-binary<br />
persons. Women+ includes women, girls and some non-binary<br />
persons. (Statistics Canada: Dictionary, Census Population, 2021)<br />
Page 9 Who We Are
Birth Rate Has Remained Relatively Stable<br />
The birth rate in Perth–Huron has remained stable since 20<strong>11</strong> and<br />
higher than the provincial average since 2018. The average age<br />
at which a mother has her first infant is 27 years, lower than the<br />
provincial average (29.3). 41,870 children were recorded in the last<br />
census, 12% of whom live in a one-parent family. 8<br />
Families and Households<br />
The following pages describe the main features of family composition in<br />
Perth and Huron Counties based on Census 2021 findings.<br />
Page 10 Who We Are
PERTH<br />
Diagram 3: PERTH, Household Feature 9<br />
#<br />
Total private<br />
32,770 households<br />
Private Households<br />
28% 1 person<br />
12%<br />
4 persons<br />
38% 2 persons<br />
9%<br />
5 or more<br />
persons<br />
13%<br />
3 persons<br />
2<br />
Average number of<br />
children in private<br />
household<br />
Married Couple Common-law couple One-parent families<br />
with children<br />
48%<br />
with children<br />
39%<br />
parent is<br />
man+<br />
23%<br />
without<br />
52%<br />
without<br />
61%<br />
parent is<br />
woman+<br />
77%
Diagram 4: HURON, Household Feature 10<br />
#<br />
25,335<br />
Total private<br />
households<br />
Private Households<br />
29% 1 person<br />
40% 2 persons<br />
<strong>11</strong>%<br />
9%<br />
4 persons<br />
5 or more<br />
persons<br />
12%<br />
3 persons<br />
2<br />
Average number of<br />
children in private<br />
household<br />
Married Couple Common-law couple One-parent families<br />
with children<br />
43%<br />
with children<br />
37%<br />
parent is<br />
man+<br />
26%<br />
without<br />
57%<br />
without<br />
63%<br />
parent is<br />
woman+<br />
74%<br />
Page 12 Who We Are<br />
HURON
Ontarians Relocating is Main Contributor<br />
to Population Growth<br />
The main factor contributing to population growth in the Stratford-Bruce<br />
Peninsula is the net intraprovincial migration of individuals moving from<br />
elsewhere in Ontario, with rates increasing significantly over the last five<br />
years. In the last year’s period (2020 to 2021) the net interprovincial<br />
loss (individuals moving out of province) of 469 people was the<br />
most significant loss over the last five years. The number of net nonpermanent<br />
residents (also referred to as temporary residents) decreased<br />
drastically in 2019-2020 as a result of the COVID-19 pandemic and<br />
restrictions, rebounding in 2020-2021. Overall migration numbers have<br />
remained comparable from 2016 to 2021. <strong>11</strong><br />
Graph 3: Population Mobility<br />
Source: Statistics Canada, Annual Demographic Estimates: Sub-provincial Areas. Population estimates and growth.<br />
2020-2021<br />
-469<br />
296<br />
366<br />
4146<br />
2019-2020<br />
-94<br />
91<br />
304<br />
4,033<br />
2018-2019<br />
-<strong>17</strong><br />
196<br />
370<br />
3,504<br />
620<br />
296<br />
3,594<br />
2020-2021 -469<br />
87<br />
4146<br />
366 370<br />
91<br />
2019-2020<br />
295<br />
-94<br />
4,033<br />
-95 304<br />
3,319<br />
196 320<br />
2018-2019 -<strong>17</strong><br />
3,504<br />
370 422<br />
1,575<br />
-134 620<br />
20<strong>17</strong>-2018<br />
87<br />
3,594<br />
370<br />
325<br />
-18 295<br />
2016-20<strong>17</strong> -95<br />
769<br />
3,319<br />
-483 320<br />
232<br />
422<br />
2015-2016 -134<br />
1,575<br />
-39 325<br />
356<br />
-470 -18<br />
2014-2015 -483<br />
237769<br />
232<br />
-39<br />
55<br />
2013-2014 -470<br />
356 733<br />
-442 237 252<br />
55<br />
2012-2013 -442<br />
733<br />
-15<br />
-308 252<br />
-351<br />
218<br />
-351<br />
-308<br />
-15<br />
20<strong>11</strong>-2012<br />
218<br />
-1000 0 1000 2000 3000 4000 5000<br />
-1000 0 1000 2000 3000 4000 5000<br />
20<strong>17</strong>-2018<br />
2016-20<strong>17</strong><br />
2015-2016<br />
2014-2015<br />
2013-2014<br />
2012-2013<br />
20<strong>11</strong>-2012<br />
Net non-permanent residents<br />
Net intraprovincial migration<br />
Net interprovincial migration Inmigrants<br />
Net non-permanent residents Net intraprovincial migration Net interprovincial migration Immigrants
More Than 90% of the Population Has Remained<br />
in the Same Residence<br />
Less than 10% of the population has changed their place of<br />
residence (“mover”) over the last year. Of those who did, most<br />
moved intraprovincially (from elsewhere within Ontario). The<br />
proportion of intraprovincial migrants in Perth and Huron Counties<br />
is higher than the provincial average. The proportion of external<br />
migrants (those who come from outside Canada) is very low<br />
in Perth-Huron, as is the proportion of interprovincial migrants<br />
(people who have moved from other provinces). Five years ago, the<br />
proportion of people who moved residences was higher across all<br />
categories. 12<br />
Net interprovincial represents the difference<br />
between in-migrants and out-migrants for a<br />
given province or territory involving a change in<br />
the usual place of residence.<br />
Net intraprovincial represents the difference<br />
between in-migrants and out-migrants in a given<br />
region. A region can be defined as an economic<br />
region.<br />
Non-mover refers to a person who lived in the<br />
same residence one and five years earlier<br />
Non-migrants refers to people who move within<br />
their same census subdivision. 8<br />
Non-permanent residents are persons<br />
lawfully in Canada on a temporary basis<br />
under the authority of a temporary<br />
resident permit, along with members of<br />
their family living with them. This includes<br />
foreign workers, foreign students, the<br />
humanitarian population and other<br />
temporary residents. The humanitarian<br />
population includes refugee claimants and<br />
temporary residents allowed to remain in<br />
Canada on humanitarian grounds and are<br />
not categorized as either foreign workers or<br />
foreign students.<br />
Immigration in Perth-Huron is<br />
Lower Than the Province<br />
The 2021 Census of Canada reported that 9.1% of the total<br />
population are immigrants in Perth and 6.9% in Huron. These rates<br />
are lower than the provincial rate of 29.97%. Representation by<br />
gender is similar in both counties. 13<br />
The percentage<br />
of immigrants in<br />
Perth-Huron is<br />
significanly lower<br />
than the Ontario<br />
average<br />
Page 14 Who We Are
Graph 4: Immigrant arrival as a percentage of total population,<br />
Perth, Huron & Ontario, 20<strong>11</strong> to 20<strong>17</strong><br />
Source: Rural Ontario Institute, Trend in annual immigrant arrivals to census divisions in Ontario, 1997 to 20<strong>17</strong>.<br />
0.9<br />
0.8<br />
0.7<br />
0.76 0.77<br />
0.75<br />
0.65<br />
0.8<br />
0.7<br />
0.6<br />
0.5<br />
0.4<br />
0.3<br />
0.2<br />
0.1<br />
0<br />
0.22 0.21<br />
0.22<br />
0.<strong>17</strong><br />
0.07<br />
0.13<br />
0.<strong>11</strong><br />
0.02<br />
0.04 0.03<br />
0.08 0.07<br />
20<strong>11</strong>-2012 2012-2013 2013-2014 2014-2015 2015-2016 2016-20<strong>17</strong><br />
Huron Perth Ontario<br />
6.9% of<br />
Huron population<br />
are immigrants<br />
9.1% of Perth<br />
population are<br />
immigrants<br />
The highest level of immigrant arrival documented in Perth<br />
was in 20<strong>11</strong>-2012 and 2015-2016. Huron shows a lower<br />
percentage of immigrant arrival in general and its most<br />
significant increase was in 2015-2016 when immigration<br />
numbers in Canada spiked as a response to the war in Syria<br />
and the Government of Canada’s response. According to<br />
Immigration, Refugees and Citizenship Canada (IRCC) data,<br />
over 25,000 Syrian refugees landed in Canada between<br />
December 1, 2015 and the end of February, 2016.
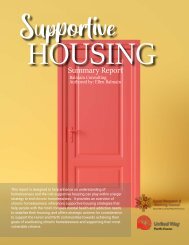
Graph 5: Immigrants by place of birth, Perth & Huron, 2021 Census, Canada<br />
Source: Statistics Canada, Census of Population, 2021.<br />
57% Europe<br />
<strong>17</strong>% Asia<br />
22%<br />
America<br />
3%<br />
1%<br />
Africa<br />
Oceania
References<br />
1 Ontario Ministry of Agriculture, Food and Rural Affairs Statistics. County Profile: Agriculture.<br />
Food and Business. Western Ontario. Data from Agriculture Census Canada 2021. Retrieved from<br />
https:// data.ontario.ca/dataset/ontario-farm-data-by-county<br />
2 Burrell, M. (n.d.) Ontario County Map. Retrieved from https://www.google.com/<br />
maps/d/u/0/embed?mid=1kKPz6L-BMydiGF0UHmJYfjgBuoY&ll=43.97243203622612%2C-<br />
81.86231472408687&z=8<br />
3 Map of Ontario treaties and reserves. Retrieved from https://www.ontario.ca/page/mapontario-treaties-and-reserves<br />
4 Native Land Map. Retrieved from https://native-land.ca/<br />
5 Statistics Canada. 2022. (table). Census Profile. 2021 Census of Population. Statistics Canada<br />
Catalogue no. 98-316-X2021001. Ottawa. Released October 26, 2022. Retrieved from www12.statcan.<br />
gc.ca/census-recensement/2021/dp-pd/prof/index.cfm?Lang=E<br />
6 Statistics Canada. 2022. (table). Census Profile. 2021 Census of Population. Statistics Canada<br />
Catalogue no. 98-316-X2021001. Ottawa. Released October 26, 2022. Retrieved from www12.statcan.<br />
gc.ca/census-recensement/2021/dp-pd/prof/index.cfm?Lang=E<br />
7 Statistics Canada. 2022. (table). Census Profile. 2021 Census of Population. Statistics Canada<br />
Catalogue no. 98-316-X2021001. Ottawa. Released October 26, 2022. Retrieved from www12.statcan.<br />
gc.ca/census-recensement/2021/dp-pd/prof/index.cfm?Lang=E<br />
8 Statistics Canada. 2022. (table). Census Profile. 2021 Census of Population. Statistics Canada<br />
Catalogue no. 98-316-X2021001. Ottawa. Released October 26, 2022. Retrieved from www12.statcan.<br />
gc.ca/census-recensement/2021/dp-pd/prof/index.cfm?Lang=E<br />
9 Statistics Canada. 2022. (table). Census Profile. 2021 Census of Population. Statistics Canada<br />
Catalogue no. 98-316-X2021001. Ottawa. Released October 26, 2022. Retrieved from www12.statcan.<br />
gc.ca/census-recensement/2021/dp-pd/prof/index.cfm?Lang=E<br />
10 Statistics Canada. 2022. (table). Census Profile. 2021 Census of Population. Statistics Canada<br />
Catalogue no. 98-316-X2021001. Ottawa. Released October 26, 2022. Retrieved from www12.statcan.<br />
gc.ca/census-recensement/2021/dp-pd/prof/index.cfm?Lang=E<br />
<strong>11</strong> Statistics Canada. 2022. (table). Census Profile. 2021 Census of Population. Statistics Canada<br />
Catalogue no. 98-316-X2021001. Ottawa. Released October 26, 2022. Retrieved from www12.statcan.<br />
gc.ca/census-recensement/2021/dp-pd/prof/index.cfm?Lang=E<br />
12 Statistics Canada. 2022. (table). Census Profile. 2021 Census of Population. Statistics Canada<br />
Catalogue no. 98-316-X2021001. Ottawa. Released October 26, 2022. Retrieved from www12.statcan.<br />
gc.ca/census-recensement/2021/dp-pd/prof/index.cfm?Lang=E<br />
13 Statistics Canada. 2021. Dictionary, Census of population. Census year 2021. Released<br />
November 7, 2021. Retrieved from https://www12.statcan.gc.ca/census-recensement/2021/ref/dict/<br />
az/index-eng.cfm<br />
About the SRPC<br />
The Social Research & Planning Council (SRPC), operated by United Way Perth-<br />
Huron, is comprised of community representatives who are dedicated to the collection,<br />
analysis and distribution of information relating to social trends and issues in Perth and<br />
Huron Counties. The SRPC approaches its work in two ways:<br />
1. Commissioning research into specific social issues.<br />
2. Developing recommendations for community improvement based on local findings<br />
and working collaboratively with community members to implement change.
WRITING<br />
Areeba Ahmad<br />
Kristin Crane<br />
Will Wellington<br />
EDITING<br />
Chad Alberico<br />
DESIGN<br />
Sonya Heyen<br />
Copyright © The Social Research & Planning<br />
Council <strong>2023</strong>. This work is copyrighted. It<br />
may be reproduced in whole or in part for<br />
educational use subject to the inclusion of an<br />
acknowledgement of the source.<br />
Icons made by SlidesToGo.