2023-12-05 A Clean Environment

Create successful ePaper yourself
Turn your PDF publications into a flip-book with our unique Google optimized e-Paper software.
Operated by:<br />
QUALITY OF LIFE:<br />
A CLEAN ENVIRONMENT
Quality of Life Subcommittee<br />
Dariel Bateman<br />
Beth Blowes<br />
Jeneane Fast<br />
City of Stratford Social Services Staff<br />
Leah Kennedy<br />
Joelle Lamport-Lewis<br />
Barb Leavitt<br />
Robin Spence-Haffner<br />
Jennifer Rojas<br />
Nancy Summers<br />
Kathy Vassilakos<br />
Special thanks given to advisors<br />
from Huron Perth Public Health:<br />
Erica Clark, PhD<br />
Angela Willert<br />
Page 2 <strong>Environment</strong><br />
The Social Research & Planning Council is funded by:<br />
City of Stratford, Town of St. Marys,<br />
County of Perth (through the Department of Social Services),<br />
the County of Huron and United Way Perth-Huron.<br />
Thank you to all the community partners who<br />
contributed to this project. We value your contribution.<br />
Social Research & Planning Council<br />
United Centre, 32 Erie St., Stratford, ON N5A 2M4<br />
Tel: 519-271-7730<br />
Email: srpc@perthhuron.unitedway.ca<br />
www.perthhuron.unitedway.ca/social-research-planning-council
A CLEAN ENVIRONMENT<br />
The environment around us is key to our existence. Our forests,<br />
rivers, lakes and soil provide us with the food we eat, the water<br />
we drink and the air we breathe. Our health and prosperity rely<br />
on the natural world and we must keep it healthy to survive. For<br />
Indigenous peoples, their relationship with the land is spiritual,<br />
whereas the Western worldview largely sees the land and its<br />
resources as commodities to develop and extract for the benefit<br />
of humans. In our region, there are reasons to be concerned about<br />
the environment, from a rise in Special Air Quality Statements to<br />
the state of our forests and wetlands.
Air<br />
Special Air Quality Statements Are On the Rise<br />
Ontario uses a two-level air quality alert system. The first level is a<br />
Special Air Quality Statement (SAQS). This level warns of reduced<br />
air quality expected to last one to two hours. 1 The second level is a<br />
Smog and Air Health Advisory (SAHA). This level warns of reduced<br />
air quality expected to last three or more hours. From 2017 to 2022,<br />
there were nine SAQS and one SAHA in Perth and Huron.<br />
The number of Special Air Quality Statements has been<br />
increasing since 2019, going from zero to three per year.<br />
Worsening air quality can be attributed to pollutants — including<br />
greenhouse gas (GHG) emissions — as well as the impacts of<br />
climate change, chiefly increasing temperatures and more wildfires. 2<br />
Higher levels of ozone can cause reduced lung function and<br />
irritation of breathing passages. Common sources include<br />
industrial and automobile emissions, gasoline vapours and<br />
electrical utilities.<br />
Similarly, nitrogen dioxide in the atmosphere can be caused<br />
by automobile emissions and electricity generation and<br />
can also lead to inflammation and irritation of breathing<br />
passages. Particulate matter can be caused by construction<br />
sites, fires and unpaved roads. Higher concentrations in the<br />
atmosphere can increase the risk of an irregular heartbeat,<br />
irritation of breathing passages and worsening of asthma. 3
Our Climate is Changing<br />
Climate change refers to shifts in temperature and weather<br />
patterns (such as precipitation and wind) over long periods of<br />
time, often decades or more. 4 Because of the deep connection<br />
Indigenous cultures maintain with the natural world, they were<br />
among the first to notice the changing climate.<br />
Fossil fuels are the biggest contributor to climate change.<br />
Globally, they account for over 75% of GHG emissions<br />
and 90% of carbon dioxide emissions. Power generation,<br />
manufacturing of goods, deforestation, transportation and food<br />
production are all causes of climate change. Climate change can<br />
lead to warmer temperatures, greater severity of storms, drought,<br />
rising ocean levels, extinction of species and food shortages. 5<br />
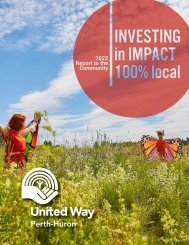
The following chart shows projected average annual<br />
temperatures for Perth-Huron, which are expected to rise<br />
dramatically by 2100:<br />
2081–2100<br />
2<strong>05</strong>1–2080<br />
2021–2<strong>05</strong>0<br />
1971–2000<br />
16<br />
14<br />
<strong>12</strong><br />
10<br />
8<br />
6<br />
4<br />
2<br />
0<br />
Projected Annual Temperatures In Perth,<br />
Stratford and Huron (ºC)<br />
Date Range Perth Stratford Huron<br />
1971–2000 6.8 7 7<br />
2021–2<strong>05</strong>0 9.3 9.4 9.5<br />
2<strong>05</strong>1–2080 11.4 11.6 11.6<br />
2081–2100 13.2 13.4 13.4<br />
Table 1: Projected Annual Temperatures in<br />
Perth, Stratford and Huron (C)<br />
Source: <strong>Environment</strong> and Climate Change Canada (<strong>2023</strong>,<br />
January 26). Perth, ON. Climate Data Canada. 8,9<br />
Perth Stratford Huron<br />
1971-2000 2021-2<strong>05</strong>0 2<strong>05</strong>1-2080 2081-2100<br />
Average annual precipitation is also projected to increase.<br />
In both Perth and Huron, average annual precipitation is expected<br />
to rise <strong>12</strong>% from 2<strong>05</strong>1–2080 6,7 and 16% from 2081–2100. In Stratford,<br />
the increase is projected to be 11% and 16% respectively during the<br />
same periods.<br />
In both counties, winters are becoming shorter each year with<br />
fewer and fewer frost days. In Huron, the number of annual frost<br />
days is projected to decrease from <strong>12</strong>4 in the 2020s to 97 in the<br />
2<strong>05</strong>0s and 74 in the 2080s. In Perth, annual frost days are expected<br />
to drop from 132 in the 2020s to <strong>12</strong>2 in the 2<strong>05</strong>0s.<br />
Page 5 A <strong>Clean</strong> <strong>Environment</strong>
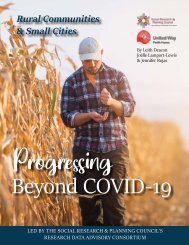
Greenhouse Gas Emissions<br />
Climate change is caused by an increase in concentrations of<br />
GHGs in the atmosphere. This increase is caused by human<br />
activities including agriculture and the consumption of fossil<br />
fuels. In Canada, emissions are put into seven categories. 10<br />
In 2009, the province passed the Green Energy and Green<br />
Economy Act (GEA) requiring that all public agencies in Ontario<br />
publish annual reports on GHG emissions. Both Perth County<br />
and Huron County prepare and publish yearly reports. The<br />
following is a look at this region’s largest industrial emitters.<br />
In comparison to the large emitters, county facilities reported<br />
significantly lower GHG emissions.<br />
See Page 22<br />
Graph 1: Canadian Green House Gas Emitter Categories<br />
Source: <strong>Environment</strong> and Climate Change Canada. (<strong>2023</strong>, April 14). Canada’s National<br />
Greenhouse Gas Inventory (1990–2021).<br />
28% Oil and Gas<br />
10%<br />
Agriculture<br />
22% Transportation<br />
8%<br />
Electricity<br />
13%<br />
Buildings<br />
7%<br />
Waste and<br />
others B<br />
11%<br />
Heavy Industry A<br />
A<br />
Heavy industry is emissions from non-coal, oil & gas mining, smelting &<br />
refining and production of industrial products such as cement, paper and<br />
chemicals.<br />
B<br />
Other emissions refers to coal production, light manufacturing,<br />
construction and forest resource extraction.<br />
Page 6 A <strong>Clean</strong> <strong>Environment</strong>
C<br />
The GHGs included are<br />
carbon dioxide (CO2), methane<br />
(CH4), nitrous oxide (N2O),<br />
hydrofluorocarbons (HFC),<br />
perfluorocarbons (PFC) and<br />
sulphur hexafluoride (SF6).<br />
D<br />
Currently St. Marys Cement<br />
uses petroleum coke and natural<br />
gas as fuels, however, the facility<br />
has applied to use Alternative<br />
Low Carbon Fuels including but<br />
not limited to wood and plastic<br />
wastes. The fuel substitution is<br />
estimated to reduce the facility’s<br />
overall CO2 emissions by 20%.<br />
*<br />
For more information about<br />
St. Marys Cement’s planned<br />
GHG reductions, you can visit<br />
the project website at:<br />
https://stmaryscement.com/<br />
Pages/Sustainability/St-Marys-<br />
Alternative-Low-Carbon-Fuels.<br />
aspx.<br />
Our Six Largest Industrial Emitters<br />
The national Greenhouse Gas Reporting Program (GHGRP) collects<br />
information annually on GHG emissions from facilities emitting 10<br />
kilotonnes of GHGs or more. C The GHGRP is mandatory and data is<br />
reported to <strong>Environment</strong> and Climate Change Canada.<br />
Industry is a backbone of Canada’s economy and is significant to<br />
the Perth-Huron economy. In Perth-Huron, six facilities meet the<br />
threshold and must report: St. Marys Cement (St. Marys), Compass<br />
Minerals (Goderich), Hendrickson Canada ULC (Stratford), Stackpole<br />
International (Stratford), Lactalis Canada Inc. (West Perth) and<br />
Suntastic Hothouse Inc (South Huron).<br />
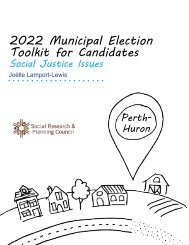
Consistent with Canada’s industrial sector GHG emissions,<br />
St. Marys Cement is the largest emitter, emitting more than five<br />
times as much as the other five Perth-Huron facilities combined.<br />
Their emissions data, for the years these companies reported in the<br />
last five years, are shown in the following tables. The data reported<br />
in 2020 and 2021 was affected by COVID-related production slowdowns<br />
and reduced demand. Other factors affecting emissions<br />
levels in recent years include lower coal consumption and fuel<br />
switching. 11,D<br />
Graph 2: GHG Emissions (kt) of Large Emitter Facilities<br />
Source: Statistics Canada. Greenhouse Gas Reporting Program (GHGRP).<br />
Suntastic Hothouse Inc. (Exeter)<br />
Compass Minerals Canada Coporation<br />
(Goderich)<br />
St. Marys Cement (St. Marys)<br />
Hendrickson Springs (Stratford)<br />
Lactalis Canada Inc. (Mitchell)<br />
Stackpole International (Stratford)<br />
0 100000 200000 300000 400000 500000 600000<br />
2021 2020 2019 2018 2017
Climate change mitigation focuses on the reduction or prevention of climate<br />
change and its impacts. To mitigate climate change, actions must be taken to<br />
decrease GHG emissions. Preserving, planting and restoring natural carbon<br />
sinks such as wetlands, forests, trees and soil will also help remove excess<br />
emissions from the atmosphere. <strong>12</strong><br />
RECOMMENDATION<br />
Individuals, organizations and governments find other<br />
ways to heat buildings and replace fueled vehicles and<br />
equipment with electric options.
WATER<br />
Years of Pollution, Shoreline Erosion and Climate<br />
Change are Affecting Our Coastal <strong>Environment</strong><br />
Climate scientists predict a more turbulent atmosphere, causing<br />
more frequent weather and wind events and leading to more<br />
erosion. Less ice cover also offers less protection to the shoreline<br />
during winter months. In Lake Huron, water levels could<br />
lower almost 20 inches by mid-century. From 1973 to 2010,<br />
seasonal ice on the lake decreased by 71%. This is due to rising<br />
water temperatures, which are projected to increase 2–4 degrees<br />
by 2100. As temperatures keep rising, the decline in lake ice will<br />
continue. 13<br />
Every year, the Lake Huron Coastal Centre publishes a coast<br />
watchers report based on data collected by volunteer coast<br />
watchers in the area. Years of pollution, shoreline erosion and<br />
climate change have caused concern for the coastal environment<br />
in our region.<br />
Coastal Conditions<br />
In 2022, coast watchers recorded 283 instances where litter or<br />
microplastics were found on beaches. Microplastics are plastic<br />
items less than 5 mm in size, such as microbeads, fragments<br />
and foam. Most commonly, coast watchers found cigarette butts,<br />
food wrappers, plastic bags and plastic bottles. Plastic poses a<br />
health and safety risk to both humans and animals on the<br />
shoreline. Litter can lead to choking, starvation, bioaccumulation<br />
or biomagnification if consumed by wildlife or if wildlife becomes<br />
entangled in it. A total of 80 kg of litter was removed by coast<br />
watchers in 2022. This number was 80.5 kg in 2021 and 61.2 kg in<br />
2020. 14 https://www.lakehuron.ca/coastwatchers<br />
Page 9 A <strong>Clean</strong> <strong>Environment</strong>
Beach Water Quality is Impacted by Many Factors and<br />
Fluctuates Year to Year<br />
Huron Perth Public Health (HPPH) regularly takes samples of beach<br />
water for bacteria. When levels of E. coli exceed the Ministry of Health<br />
guidelines, HPPH recommends that people do not swim. If people<br />
still choose to swim, they are at risk of being exposed to bacteria that<br />
can cause diarrhea and infections in the eyes, throat and skin. HPPH<br />
recommends swimmers be aware of the following when assessing<br />
whether it is safe to swim:<br />
• Are you unable to see your feet while standing waistdeep<br />
in water?<br />
• Has there been heavy rainfall in the last 24–48 hours?<br />
If your answer to these questions is yes, then the E. coli levels on the<br />
beach are too high and it is unsafe to swim. E. coli bacteria levels are<br />
measured at 18 beaches in Perth-Huron. The geometric mean tells us the<br />
typical value for E. coli bacteria concentration on a beach. Any mean over<br />
200 indicates an unsafe beach for swimming. In 2019 and 2020 none of<br />
the beaches had values above 200, but in 2021 four beaches had values<br />
over 200 and in 2022 three beaches had values over 200. 15<br />
HPPH samples beach water from mid-June until Labour Day weekend.<br />
The following table displays the public beaches in Perth-Huron and the<br />
geometric mean collected every August from 2019–2022.<br />
Beach 2019 2020 2021 2022<br />
Amberley Beach 14 66 66 103<br />
Ashfield Township Park Beach 41 90 90 278<br />
Black's Point Beach 10 16 16 20<br />
Goderich - Main Beach 11 13 13 983<br />
Goderich - Rotary Cove 10 23 23 286<br />
Goderich - St. Christopher's Beach <strong>12</strong> N/A N/A 141<br />
Hay Township Park Beach 17 N/A N/A 32<br />
Howard Street Beach<br />
(Bayfield Main Beach)<br />
N/A 11 11 <strong>12</strong><br />
Pier Beach 11 11 44<br />
Port Albert Beach 18 24 24 149<br />
Port Blake Beach 16 15 15 189<br />
St. Joseph's Beach <strong>12</strong>3 15 15 17<br />
St. Marys Quarry 10 10 23<br />
Sunset Beach 10 10 10 17<br />
Wildwood Conservation Area Beach N/A 15 15 49<br />
Table 2: Public beach August E. coli geometric mean<br />
Source: Huron Perth Public Health<br />
Page 10 A <strong>Clean</strong> <strong>Environment</strong>
High E. coli levels can be caused by a variety of factors, including:<br />
Storm drains<br />
& rivers<br />
Septic<br />
systems E<br />
E. coli<br />
Causes<br />
Domestic and<br />
wild animals<br />
Birds<br />
Groundwater<br />
Swimmers<br />
RECOMMENDATION<br />
Individuals perform simple actions<br />
to have a positive impact on E.<br />
coli levels in surface waters and<br />
improve beach water quality.<br />
E<br />
Septic systems are tanks that<br />
are underground and watertight.<br />
These systems are designed<br />
to provide primary wastewater<br />
treatment by holding wastewater<br />
long enough to allow solids to<br />
separate from oil and grease<br />
before being dispersed into soil<br />
where it is naturally filtered.
Watershed Indicators For<br />
Conservation Authority Areas<br />
A watershed is an area of land that catches rain and snow and<br />
drains or seeps into groundwater, a marsh, stream, river or lake. 16<br />
Most of Perth-Huron is covered by three conservation authorities:<br />
Maitland Valley, Ausable Bayfield and Upper Thames River.<br />
Map 1: Southwest Ontario Watersheds<br />
Source: Conservation Ontario
These three conservation authorities release watershed report cards<br />
measuring groundwater quality, surface water quality, forest conditions<br />
and wetland conditions. The report cards allow authorities to benchmark<br />
conditions, measure change, identify issues and track progress for actions.<br />
The following grading system is used to evaluate the condition of these<br />
areas:<br />
Grades<br />
A: Excellent – Very healthy watershed conditions<br />
B: Good – Healthy watershed conditions<br />
C: Fair – Watershed conditions require improvement<br />
D: Poor – Poor watershed conditions, require improvement<br />
F: Very Poor – Watershed significantly degrading, require much<br />
improvement<br />
Insufficient Data<br />
Surface Water Scores Are Consistent With Provincial<br />
Average<br />
Surface water makes up rivers, lakes and streams. Surface water quality<br />
is assessed by measuring several indicators F for water chemistry and the<br />
health of small organisms living in streams and on riverbeds. Findings from<br />
Ontario indicate surface water quality decreases the closer the source of<br />
water is to an urban area. There can be multiple sources of discharge in<br />
highly populated areas, including winter salt application or stormwater<br />
runoff. The average score for surface water in Ontario is C, indicating<br />
“fair” surface water quality. 17 Both Maitland Valley and Ausable Bayfield<br />
Conservation Authorities matched the provincial average with C scores. 18,19<br />
Upper Thames Conservation Authority also averaged a C score but<br />
received slightly more D scores in some areas. 20<br />
F<br />
The quality indicators are as follows: total phosphorus concentrations,<br />
benthic macroinvertebrates (small organisms whose numbers indicate the<br />
level of pollution in water), E. coli levels and salts (e.g., road salt and de-icers).<br />
RECOMMENDATIONS<br />
Individuals can improve surface water quality by<br />
reducing or eliminating the use of chemicals such as<br />
backyard pesticides.<br />
Individuals and businesses limit the use of<br />
chemicals, including fertilizers and winter salt, and<br />
always use and store these chemicals correctly to<br />
help protect groundwater.<br />
Page 13 A <strong>Clean</strong> <strong>Environment</strong>
Groundwater Scores Are Better Than Provincial Average<br />
Groundwater is an important source of drinking water found in cracks<br />
in soil, sand and rock. In Ontario, 23% of the population, including most<br />
rural homes and businesses, depends on groundwater. In some areas this<br />
is the only source of water. The contamination of local groundwater<br />
is a growing concern. Contaminants from industrial, residential and<br />
agricultural activities can enter groundwater through cracks in exposed<br />
bedrock. Sometimes this contamination is impossible to resolve.<br />
Contaminants include: 21<br />
• Fertilizers<br />
• Septic systems<br />
• Water treatment effluent<br />
• Manure<br />
• Winter salt runoff<br />
• Water softeners<br />
• Uncapped or unused wells can provide an access point for groundwater<br />
contaminants<br />
Groundwater quality is assessed by measuring the concentration of nitrite<br />
and nitrate (from fertilizers, manure and leaky septic systems) and the<br />
concentration of chloride (from natural or human causes). The provincial<br />
average grade for groundwater quality is B (good) for both nitrite and<br />
nitrate and for chloride. Maitland Valley scored higher than the provincial<br />
average with an A (excellent) for both indicators. Ausable Bayfield received<br />
mostly A (excellent) grades, but two monitored wells received F (very poor)<br />
grades. It is likely the F (very poor) grade for nitrite and nitrate was the<br />
result of surface water contamination through nearby sinkholes. The F (very<br />
poor) grade for chloride might be attributed to the well’s location in deep<br />
bedrock and susceptibility to contamination. Upper Thames River did not<br />
report grades for groundwater quality. 22<br />
RECOMMENDATIONS<br />
Individuals and businesses work to<br />
protect groundwater sources by properly<br />
disposing of chemicals.<br />
Individuals ensure unused wells are<br />
decommissioned and agricultural<br />
landowners consult OMAFRA’s source<br />
protection guide for best practices to<br />
protect vulnerable groundwater sources.<br />
Page 14 A <strong>Clean</strong> <strong>Environment</strong>
Forests and Wetlands Score Lower Than Provincial<br />
Average<br />
Forests, wetlands and riparian areas (trees, shrubs and plants near bodies<br />
of water) provide important support for the ecosystem. They serve as<br />
habitats for wildlife, shade and help purify air and water. They also protect<br />
soil, reducing the risk of erosion and flooding. Forests absorb greenhouse<br />
gases and act as a natural “air conditioner” for the land. Forest conditions<br />
are measured by assessing the area covered by forest within a watershed<br />
and the amount of forest interior providing habitat for wildlife. In addition<br />
to the number of trees, the variety of native species of trees and vegetation<br />
indicates the resilience of a forest and its surrounding area to climate<br />
change impacts. 23<br />
Between 2010 and 2015 approximately 353 hectares of forest<br />
were cleared for urban and agricultural uses in the Upper Thames<br />
River Conservation Authority area. During the same period, 781<br />
hectares of forest were gained thanks to forest succession and<br />
improvements in mapping. 24<br />
In the residential areas of Stratford, tree canopy percentages range from<br />
30–35%. This is higher than average urban forest numbers in Ontario. If<br />
industrial and commercial areas are added to the equation, the overall<br />
percentage comes down to 25–28% in Stratford.<br />
Conservation authorities in Perth and Huron all report on wetlands,<br />
although many other Ontario conservation authorities do not. The<br />
greatest threats to forests, wetlands and riparian areas are<br />
urbanization, changes to natural water levels, pollution, climate<br />
change and invasive species. There are three indicators used to assess<br />
forest conditions: per cent forest cover, per cent forest interior and per cent<br />
riparian zone forested. On average, all three of the conservation authorities<br />
covering Perth-Huron received C (fair) or D (poor) grades for both forest<br />
and wetland conditions. Overall, the grades were lower than the provincial<br />
average of C (fair). 25<br />
Conservation authorities can help by providing details on native species<br />
and include guides and information on their websites. Ausable Bayfield<br />
and Upper Thames River Conservation Authorities also offer programs to<br />
purchase native species at affordable prices. 26<br />
https://www.abca.ca/<br />
assets/files/Native_Plant_<br />
Guide_2021_LR.pdf<br />
https://thamesriver.on.ca/<br />
watershed-health/nativespecies/recommendedtrees-and-shrubs/<br />
RECOMMENDATIONS<br />
Landowners, community groups, governments and<br />
businesses increase the forest cover and improve the<br />
sustainability of woodlots and urban forests in consultation<br />
with local conservation authorities.<br />
Page 16 A <strong>Clean</strong> <strong>Environment</strong>
Bio-diversity protects forests from insects and diseases, improves<br />
resilience to climate variations and provides resources for wildlife.<br />
Woodlots and urban forest are habitat for wildlife.<br />
RECOMMENDATIONS<br />
Individuals, community organizations and municipal<br />
governments increase the tree coverage in woodlots and<br />
urban forests with a diverse number of native species.<br />
Municipal governments share information on the benefits<br />
of urban forests to increase knowledge and awareness of<br />
the importance of the canopy in improving the land, air and<br />
water quality. They can also support private landowners<br />
through stewardship programs to preserve and enhance<br />
woodlots, among other environmental protection activities,<br />
and even offer access to provincial tax relief programs.
Waste is Up, Recycling is Steady<br />
The following charts display recycling and waste by households in the<br />
region. While trends for the different areas remained consistent from<br />
2016 to 2022, changes can be explained by a variety of factors. For<br />
example, the jump in recycling and waste for Bluewater is the result of<br />
an automated collection launch, meaning the area went from bag tags<br />
to a wheelie bin system. Another jump occurred in 2021, explained by<br />
an upsize in the waste bin sizes available in rural areas.<br />
While recycling trends vary across municipalities, waste per<br />
household has increased in every municipality.<br />
Recyling 2016 2017 2018 2019 2020 2021 2022<br />
Bluewater 107 114 1<strong>12</strong> 114 152 171 172<br />
Central Huron 200 201 194 192 190 207 190<br />
Goderich 298 304 329 313 279 272 252<br />
Morris-Turnberry 224 232 221 221 210 220 206<br />
South Huron 318 310 300 286 265 264 262<br />
North Perth 262 268 261 267 251 246 232<br />
Perth East 165 199 216 233 234 239 228<br />
Perth South 137 199 196 198 203 216 216<br />
West Perth 275 276 277 285 271 265 263<br />
St. Marys 341 332 328 334 325 347 308<br />
Table 3: Recycling by household (kg/hhld)<br />
Source: Bluewater Recycling Association<br />
Page Page 18 <strong>Clean</strong> 18 Environement <strong>Environment</strong>
Waste 2016 2017 2018 2019 2020 2021 2022<br />
Bluewater <strong>12</strong>2 136 146 143 220 274 256<br />
Central Huron 226 239 260 279 298 341 320<br />
Goderich 249 273 288 299 325 336 338<br />
Morris-Turnberry 381 385 398 406 425 442 414<br />
South Huron 345 375 398 429 492 482 480<br />
North Perth 106 197 299 314 339 353 337<br />
Perth East 147 254 282 279 300 316 3<strong>05</strong><br />
Perth South 377 385 401 406 465 444 447<br />
West Perth 445 443 449 463 478 510 479<br />
St. Marys 341 332 328 334 325 347 308<br />
Table 4: Waste by household (kg/hhld)<br />
Source: Bluewater Recycling Association<br />
Page 19 Environement
Diversion Rates<br />
This chart displays the diversion rates for Perth and Huron as well as<br />
Stratford:<br />
Region kg/hhld/yr 2019 2020 2021<br />
Perth and Huron<br />
Stratford<br />
Waste 289.97 322.49 345.94<br />
Recycling 230.04 229.24 238.78<br />
Diversion % 44% 42% 41%<br />
Waste 394.74 365.37 349.33<br />
Recycling 259.93 311.69 343.88<br />
Diversion % 40% 46% 50%<br />
Table 5: Diversion Rates<br />
Source: Bluewater Recycling Association, City of Stratford.<br />
RECOMMENDATION<br />
Provincial government legislates closed-loop<br />
recycling, requiring producers to ensure all<br />
packaging is recyclable.<br />
As citizens and consumers we need to change our perspective that<br />
recycling is the solution to waste. Recycling systems were never designed<br />
to manage the large volume and complexity of materials we have today. 27<br />
RECOMMENDATION<br />
Municipal governments ensure that all residents,<br />
including small, rural and remote communities,<br />
have access to recycling.
Green Infrastructure<br />
The use of natural and green infrastructure upgrades will reduce costs in<br />
the long term. Green infrastructure can cost 5 to 30% less to construct<br />
and can be 25% less costly over its life span, than similar traditional<br />
infrastructure.<br />
RECOMMENDATION<br />
Provincial and federal governments increase<br />
funding to green infrastructure programs, with a<br />
dedicated stream for natural infrastructure projects,<br />
particularly with an aim to replace and readapt<br />
aging water, wastewater and stormwater systems.<br />
The federal government has the Green Infrastructure stream to support greener and<br />
more resilient communities. Eligible projects target climate change and disaster<br />
mitigation, greenhouse gas emissions reduction, renewable technologies, water and<br />
wastewater systems upgrades, soil and air pollutants.<br />
Side by side with federal government support there is the use of natural infrastructure,<br />
which is the preservation, restoration or enhancement of ecosystem features and<br />
materials to meet infrastructure needs at the same time as offering environmental,<br />
economic and community health and well-being. Natural infrastructure has an added<br />
benefit of allowing access to nature by communities that don’t have green spaces or<br />
lack natural protected area, in addition to providing critical infrastructure.<br />
RECOMMENDATIONS<br />
Municipalities in Perth-Huron, along with<br />
associated community organizations, promote the<br />
benefits of compost and best practices for using<br />
compost.<br />
Compost needs to be made convenient and<br />
accessible to residents, community groups,<br />
farmers and services who could benefit from using<br />
this product.<br />
Page 21 A <strong>Clean</strong> <strong>Environment</strong>
The Air Quality Health Index (AQHI) is a scale designed by<br />
the Government of Canada showing how the air around us<br />
affects our health. Its aim is to limit exposure to air pollution by<br />
monitoring levels at any given time. The AQHI is calculated by<br />
assessing risks associated with a combination of the following<br />
air pollutants: ozone at ground level, particulate matter (PM) and<br />
nitrogen dioxide (NO2).<br />
In 2022, scores in Perth-Huron (measured at Grand Bend) were,<br />
on average, in the “low risk” category. In the spring and summer<br />
months there were some “moderate risk” scores with one “high<br />
risk” score in late June.<br />
1 2 3 4 5 6 7 8 9 10 +<br />
Low Risk Moderate Risk High Risk<br />
The AQHI is measured on a scale of 1 to 10+. The diagram above<br />
displays this scale.<br />
• Scores of 1–3 = Low risk. This is the ideal air quality.<br />
• Scores of 4–6 = Moderate risk. There is no need to modify<br />
your usual activities unless you experience coughing, throat<br />
irritation or related symptoms.<br />
• Scores of 7–10 = High risk. Reducing strenuous activities is<br />
recommended.<br />
• Scores above 10 = Very High risk. Strenuous activities should<br />
be avoided.<br />
Very<br />
High<br />
Risk<br />
GHG Emissions For PERTH COUNTY Facilities<br />
The following chart displays GHG emissions (in kg) for Perth<br />
County buildings. Due to gaps in data and reporting errors,<br />
accurate data is not currently available for 2014–2016 and 2020.<br />
The jump in numbers for emergency medical services in 2018<br />
can be attributed to the inclusion of Stratford EMS services,<br />
which was not included in previous years.<br />
Page 22 A <strong>Clean</strong> <strong>Environment</strong>
Graph 3: GHG Emissions (kg) of County Owned Facilities in Perth<br />
Source: Perth County<br />
County Courthouse<br />
Emergency Medical Services<br />
Public Works<br />
County Registry Building<br />
Stratford-Perth Archives<br />
0 100000 200000 300000 400000 500000 600000 700000<br />
2019 2018 2017 2013 20<strong>12</strong><br />
GHG Emissions For HURON COUNTY Facilities<br />
This chart displays GHG emissions (in kg) for Huron County<br />
facilities.<br />
Graph 4: GHG Emissions (kg) of County Owned Facilities in Huron<br />
Source: Huron County<br />
Office Facilities<br />
Museums<br />
Emergency medical services<br />
Long-term care<br />
Public Works<br />
0 2000000 4000000 6000000 8000000 10000000<br />
20<strong>12</strong> 2013 2014 2015 2016 2017 2018 2019 2020
Recommendation<br />
Individual &<br />
Community<br />
Businesses<br />
&<br />
Organization<br />
Municipal<br />
Gov.<br />
Provincial<br />
/Federal<br />
Gov.<br />
1<br />
2<br />
3<br />
4<br />
5<br />
6<br />
Individuals, organizations and governments find<br />
other ways to heat buildings and replace fueled<br />
vehicles and equipment with electric options. (p.8)<br />
Individuals can perform simple actions to reduce E.<br />
coli levels in surface water and improve beach water<br />
quality for everyone. (p.11)<br />
Actions include:<br />
• Proper disposal of animal and human waste<br />
• Prevention of livestock grazing near lakes<br />
• Maintaining septic systems and decreasing the<br />
use of fertilizer and manure near lakes<br />
• Not feeding wildlife — particularly geese and<br />
seagulls — at home and in public spaces<br />
• Reducing or eliminating the use of backyard<br />
pesticides<br />
• Implementing farming best practices including<br />
keeping manure storage in a flat area and<br />
covered to limit runoff<br />
• Implementing measures including buffer zones<br />
near lakes to prevent livestock grazing, as well<br />
as effectively managing stormwater runoff, could<br />
also have positive impacts on E. coli levels<br />
Individuals can improve surface water quality by<br />
reducing or eliminating the use of chemicals such as<br />
backyard pesticides. (p.13)<br />
Individuals and businesses limit the use of chemicals,<br />
including fertilizers and winter salt, and always use<br />
and store these chemicals correctly to help protect<br />
groundwater. (p.13)<br />
Individuals and businesses work to protect<br />
groundwater sources by properly disposing of<br />
chemicals. (p.14)<br />
Individuals ensure unused wells are decommissioned<br />
and agricultural landowners consult OMAFRA’s<br />
source protection guide for best practices to protect<br />
vulnerable groundwater sources. (p.14)<br />
Page 24 A <strong>Clean</strong> <strong>Environment</strong>
Recommendation<br />
Individual &<br />
Community<br />
Businesses<br />
&<br />
Organization<br />
Municipal<br />
Gov.<br />
Provincial<br />
/Federal<br />
Gov.<br />
7<br />
8<br />
9<br />
10<br />
11<br />
<strong>12</strong><br />
13<br />
14<br />
Landowners, community groups, governments and<br />
businesses increase the forest cover and improve<br />
the sustainability of woodlots and urban forests in<br />
consultation with local conservation authorities.<br />
(p.16)<br />
Individuals, community organizations and municipal<br />
governments increase the tree coverage in woodlots<br />
and urban forests with a diverse number of native<br />
species. (p.17)<br />
Municipal governments share information on the<br />
benefits of urban forests to increase knowledge<br />
and awareness of the importance of the canopy in<br />
improving the land, air and water quality. They can<br />
also support private landowners through stewardship<br />
programs to preserve and enhance woodlots, among<br />
other environmental protection activities, and even<br />
offer access to provincial tax relief programs. (p.17)<br />
Provincial government legislates closed-loop<br />
recycling, requiring producers to ensure all<br />
packaging is recyclable. (p.20)<br />
Municipal governments ensure that all residents,<br />
including small, rural and remote communities, have<br />
access to recycling.. (p.20)<br />
Provincial and federal governments increase funding<br />
to green infrastructure programs, with a dedicated<br />
stream for natural infrastructure projects, particularly<br />
with an aim to replace and readapt aging water,<br />
wastewater and stormwater systems. (p.21)<br />
Municipalities in Perth-Huron, along with associated<br />
community organizations, promote the benefits of<br />
compost and best practices for using compost. (p.21)<br />
Compost needs to be made convenient and<br />
accessible to residents, community groups, farmers<br />
and services who could benefit from using this<br />
product. (p.21)<br />
Page 25 A <strong>Clean</strong> <strong>Environment</strong>
References<br />
1 Government of Ontario, Ministry of the <strong>Environment</strong> (2022). Air Quality Health Index (AQHI). Air<br />
Quality Ontario. http://www.airqualityontario.com/aqhi/<br />
2 Ministry of the <strong>Environment</strong>, Conservation and Parks (2017). Air Quality Health Index and<br />
air quality alerts. Government of Ontario. https://www.ontario.ca/document/air-quality-ontario-<br />
2017-report/air-quality-health-index-and-air-quality-alerts#:~:text=The%20first%20level%20is%20<br />
a,%2Dterm%2C%20transient%20event<br />
3 Nathanson, J. A. (<strong>2023</strong>, July 21). Air Pollution. Encyclopedia Britannica. https://www.<br />
britannica.com/science/air-pollution<br />
4 United Nations. (<strong>2023</strong>). Climate Action. United Nations. https://www.un.org/en/climatechange<br />
5 United Nations. (<strong>2023</strong>). Climate Action. United Nations. https://www.un.org/en/climatechange<br />
6 <strong>Environment</strong> and Climate Change Canada. (<strong>2023</strong>, January 26). Perth, ON. Climate Data<br />
Canada. https://climatedata.ca/explore/location/?loc=FCCRW&location-select-temperature=tx_<br />
max&location-select-precipitation=r1mm&location-select-other=frost_days<br />
7 <strong>Environment</strong> and Climate Change Canada. (<strong>2023</strong>, January 26). Huron, ON. Climate Data<br />
Canada. https://climatedata.ca/explore/location/?loc=FEQRI&location-select-temperature=tx_<br />
max&location-select-precipitation=r1mm&location-select-other=frost_days<br />
8 <strong>Environment</strong> and Climate Change Canada. (<strong>2023</strong>, January 26). Perth, ON. Climate Data<br />
Canada. https://climatedata.ca/explore/location/?loc=FCCRW&location-select-temperature=tx_<br />
max&location-select-precipitation=r1mm&location-select-other=frost_days<br />
9 <strong>Environment</strong> and Climate Change Canada. (<strong>2023</strong>, January 26). Huron, ON. Climate Data<br />
Canada. https://climatedata.ca/explore/location/?loc=FEQRI&location-select-temperature=tx_<br />
max&location-select-precipitation=r1mm&location-select-other=frost_days<br />
10 Government of Canada. (<strong>2023</strong>, April). Greenhouse Gas Emissions : Canadian <strong>Environment</strong>al<br />
Sustainability Indicators. https://www.canada.ca/content/dam/eccc/documents/pdf/cesindicators/<br />
ghg-emissions/2021/greenhouse-gas-emissions-en.pdf<br />
11 <strong>Environment</strong> and Climate Change Canada (<strong>2023</strong>) Canadian <strong>Environment</strong>al Sustainability<br />
Indicators: Greenhouse gas emissions from large facilities. https://www.canada.ca/en/environmentclimate-change/services/environmental-indicators/greenhouse-gas-emissions/large-facilities.html<br />
<strong>12</strong> United Nations. (<strong>2023</strong>). Climate Action. United Nations. https://www.un.org/en/climatechange<br />
13 Huron County. (2021). Climate Projections for Huron County<br />
14 Lake Huron Coastal Centre. (2022). Annual Coast Watchers Report. Lake Huron Coastal<br />
Centre. https://www.lakehuron.ca/_files/ugd/697a03_897f15e104ee408ca3b7df887406af6b.pdf<br />
15 Huron Perth Public Health. (2022). Beach Water Quality. Huron Perth Public Health. https://<br />
www.hpph.ca/en/partners-and-professionals/beach-water-quality.aspx<br />
16 Conservation Ontario. (<strong>2023</strong>, March 24). State of Ontario’s Watersheds. Conservation Ontario.<br />
https://storymaps.arcgis.com/stories/14a8022345b145e3965b30e96197b134<br />
17 Conservation Ontario. (<strong>2023</strong>, March 24). State of Ontario’s Watersheds. Conservation Ontario.<br />
https://storymaps.arcgis.com/stories/14a8022345b145e3965b30e96197b134<br />
Page 26 A <strong>Clean</strong> <strong>Environment</strong>
18 Ausable Bayfield Conservation Authority. (<strong>2023</strong>). Watershed Report Card <strong>2023</strong>. Ausable<br />
Bayfield. https://www.abca.ca/assets/files/WRC_Summary_Brochure_<strong>2023</strong>_LR_ACK_March_20_<strong>2023</strong>.<br />
pdf<br />
19 Maitland Valley Conservation Authority. (2018). Watershed Report Card 2018. Maitland Valley.<br />
https://www.mvca.on.ca/wp-content/uploads/2018/03/Watershed-Reportcard-2018.pdf<br />
20 Upper Thames River Conservation Authority. (<strong>2023</strong>, June 26). Watershed Report Card 2022.<br />
Upper Thames River . https://thamesriver.on.ca/watershed-health/watershed-report-cards/<br />
21 https://storymaps.arcgis.com/stories/14a8022345b145e3965b30e96197b134<br />
22 Conservation Ontario. (<strong>2023</strong>, March 24). State of Ontario’s Watersheds. Conservation Ontario.<br />
https://storymaps.arcgis.com/stories/14a8022345b145e3965b30e96197b134<br />
23 Conservation Ontario. (<strong>2023</strong>, March 24). State of Ontario’s Watersheds. Conservation Ontario.<br />
https://storymaps.arcgis.com/stories/14a8022345b145e3965b30e96197b134<br />
24 Conservation Ontario. (<strong>2023</strong>, March 24). State of Ontario’s Watersheds. Conservation Ontario.<br />
https://storymaps.arcgis.com/stories/14a8022345b145e3965b30e96197b134<br />
25 Conservation Ontario. (<strong>2023</strong>, March 24). State of Ontario’s Watersheds. Conservation Ontario.<br />
https://storymaps.arcgis.com/stories/14a8022345b145e3965b30e96197b134<br />
26 Afforestation Guide for Southern Ontario OMNRF. 2019. Afforestation Guide. Toronto: Queen’s<br />
Printer for Ontario. 320 pp. ISBN: 978-1-4868-2421-2 (PDF)<br />
27 <strong>Environment</strong>al Defence Canada. (2020, August 24). Ontario - Recycling is the last<br />
resort. <strong>Environment</strong>al Defence https://environmentaldefence.ca/ontario-recycling-is-the-lastresort/#:~:text=Currently%2C%20less%20than%20seven%20per,landfills%20and%20incinerators%20<br />
every%20year%20.<br />
About the SRPC<br />
The Social Research & Planning Council (SRPC), operated by United Way Perth-<br />
Huron, is comprised of community representatives who are dedicated to the collection,<br />
analysis and distribution of information relating to social trends and issues in Perth and<br />
Huron counties. The SRPC approaches its work in two ways:<br />
1. Commissioning research into specific social issues.<br />
2. Developing recommendations for community improvement based on local findings<br />
and working collaboratively with community members to implement change.
WRITING<br />
Areeba Ahmad<br />
Kristin Crane<br />
Will Wellington<br />
EDITING<br />
Chad Alberico<br />
DESIGN<br />
Sonya Heyen<br />
Copyright © The Social Research & Planning<br />
Council <strong>2023</strong>. This work is copyrighted. It<br />
may be reproduced in whole or in part for<br />
educational use subject to the inclusion of an<br />
acknowledgement of the source.<br />
Icons made by SlidesToGo