2023-12-05 A Clean Environment

Create successful ePaper yourself
Turn your PDF publications into a flip-book with our unique Google optimized e-Paper software.
Beach Water Quality is Impacted by Many Factors and<br />
Fluctuates Year to Year<br />
Huron Perth Public Health (HPPH) regularly takes samples of beach<br />
water for bacteria. When levels of E. coli exceed the Ministry of Health<br />
guidelines, HPPH recommends that people do not swim. If people<br />
still choose to swim, they are at risk of being exposed to bacteria that<br />
can cause diarrhea and infections in the eyes, throat and skin. HPPH<br />
recommends swimmers be aware of the following when assessing<br />
whether it is safe to swim:<br />
• Are you unable to see your feet while standing waistdeep<br />
in water?<br />
• Has there been heavy rainfall in the last 24–48 hours?<br />
If your answer to these questions is yes, then the E. coli levels on the<br />
beach are too high and it is unsafe to swim. E. coli bacteria levels are<br />
measured at 18 beaches in Perth-Huron. The geometric mean tells us the<br />
typical value for E. coli bacteria concentration on a beach. Any mean over<br />
200 indicates an unsafe beach for swimming. In 2019 and 2020 none of<br />
the beaches had values above 200, but in 2021 four beaches had values<br />
over 200 and in 2022 three beaches had values over 200. 15<br />
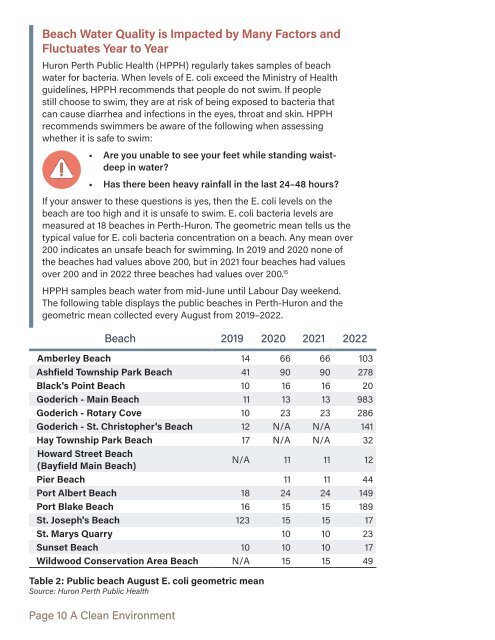
HPPH samples beach water from mid-June until Labour Day weekend.<br />
The following table displays the public beaches in Perth-Huron and the<br />
geometric mean collected every August from 2019–2022.<br />
Beach 2019 2020 2021 2022<br />
Amberley Beach 14 66 66 103<br />
Ashfield Township Park Beach 41 90 90 278<br />
Black's Point Beach 10 16 16 20<br />
Goderich - Main Beach 11 13 13 983<br />
Goderich - Rotary Cove 10 23 23 286<br />
Goderich - St. Christopher's Beach <strong>12</strong> N/A N/A 141<br />
Hay Township Park Beach 17 N/A N/A 32<br />
Howard Street Beach<br />
(Bayfield Main Beach)<br />
N/A 11 11 <strong>12</strong><br />
Pier Beach 11 11 44<br />
Port Albert Beach 18 24 24 149<br />
Port Blake Beach 16 15 15 189<br />
St. Joseph's Beach <strong>12</strong>3 15 15 17<br />
St. Marys Quarry 10 10 23<br />
Sunset Beach 10 10 10 17<br />
Wildwood Conservation Area Beach N/A 15 15 49<br />
Table 2: Public beach August E. coli geometric mean<br />
Source: Huron Perth Public Health<br />
Page 10 A <strong>Clean</strong> <strong>Environment</strong>