2023-12-05 A Clean Environment

You also want an ePaper? Increase the reach of your titles
YUMPU automatically turns print PDFs into web optimized ePapers that Google loves.
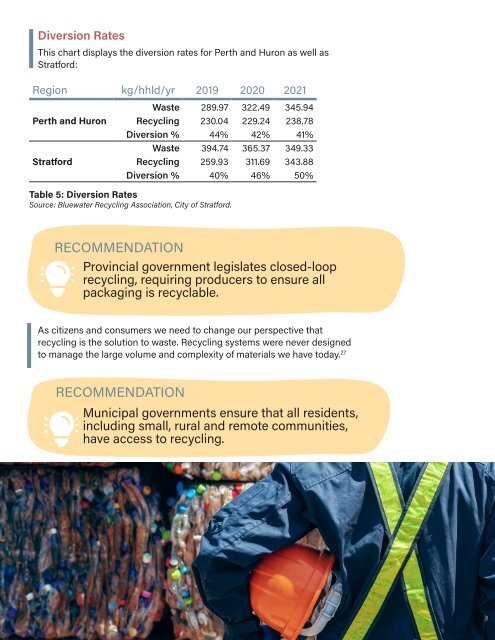
Diversion Rates<br />
This chart displays the diversion rates for Perth and Huron as well as<br />
Stratford:<br />
Region kg/hhld/yr 2019 2020 2021<br />
Perth and Huron<br />
Stratford<br />
Waste 289.97 322.49 345.94<br />
Recycling 230.04 229.24 238.78<br />
Diversion % 44% 42% 41%<br />
Waste 394.74 365.37 349.33<br />
Recycling 259.93 311.69 343.88<br />
Diversion % 40% 46% 50%<br />
Table 5: Diversion Rates<br />
Source: Bluewater Recycling Association, City of Stratford.<br />
RECOMMENDATION<br />
Provincial government legislates closed-loop<br />
recycling, requiring producers to ensure all<br />
packaging is recyclable.<br />
As citizens and consumers we need to change our perspective that<br />
recycling is the solution to waste. Recycling systems were never designed<br />
to manage the large volume and complexity of materials we have today. 27<br />
RECOMMENDATION<br />
Municipal governments ensure that all residents,<br />
including small, rural and remote communities,<br />
have access to recycling.