
You also want an ePaper? Increase the reach of your titles
YUMPU automatically turns print PDFs into web optimized ePapers that Google loves.
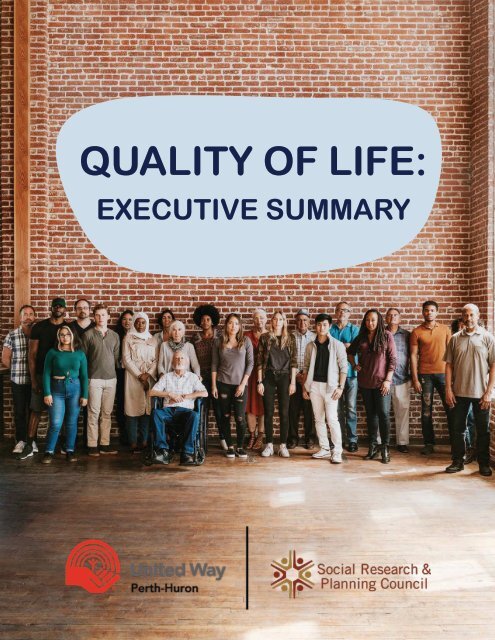
QUALITY OF LIFE:<br />
EXECUTIVE SUMMARY
Quality of Life Subcommittee<br />
Dariel Bateman<br />
Beth Blowes<br />
Jeneane Fast<br />
City of Stratford Social Services Staff<br />
Leah Kennedy<br />
Joelle Lamport-Lewis<br />
Barb Leavitt<br />
Robin Spence-Haffner<br />
Jennifer Rojas<br />
Nancy Summers<br />
Kathy Vassilakos<br />
Special thanks given to advisors<br />
from Huron Perth Public Health:<br />
Erica Clark, PhD<br />
Angela Willert<br />
The Social Research & Planning Council is funded by:<br />
City of Stratford, Town of St. Marys,<br />
County of Perth, through the Department of Social Services,<br />
the County of Huron, and United Way Perth-Huron.<br />
Thank you to all the community partners who<br />
contributed to this project. We value your contribution.<br />
Social Research & Planning Council<br />
United Centre, 32 Erie St., Stratford, ON N5A 2M4<br />
Tel: 519-271-7730<br />
Email: srpc@perthhuron.unitedway.ca<br />
www.perthhuron.unitedway.ca/social-research-planning-council
QUALITY OF LIFE<br />
Welcome to Quality of Life in Perth & Huron County <strong>2023</strong>. This series of reports provides<br />
a holistic look at quality of life in Perth and Huron Counties. We present findings we can<br />
celebrate and issues we can work on. We hope these reports will act as catalysts for<br />
community discussions and collaborations and help leaders — elected and otherwise —<br />
make informed policy and funding decisions.<br />
Background<br />
This is the Social Research & Planning Council’s fourth time reporting on the quality of<br />
life in our region. Our first two reports, published in 2004 and 2008, focused on Perth<br />
County. Our 2014 report expanded to include Huron County.<br />
Since then, our approach to publishing local data has changed. We created a digital<br />
platform, myPerthHuron, to provide ongoing access to quality data about our region. We<br />
shifted away from printed reports in favour of digital reports.<br />
In the past few years, as Canada coped with COVID-19, we decided it was time for<br />
another look at quality of life.<br />
Methodology: How Do You Measure Quality of Life?<br />
Quality of life refers to the general well-being of individuals and society defined in terms<br />
of health and happiness, rather than wealth. Purely economic indicators like GDP (Gross<br />
Domestic Product) are not sufficient to measure well-being. A broad range of factors play<br />
into quality of life. This report looks at the subject from many angles.<br />
Multiple frameworks have been developed to measure quality of life. Our last Quality of<br />
Life report used the Canadian Index of Wellbeing (CIW) framework. For this report, we<br />
wanted a broader scope.<br />
We began by designing our own framework. This framework combined elements<br />
from the CIW, the United Nations’ Sustainable Development Goals (SDGs), the Social<br />
Determinants of Health and the Pillars of Sustainable Development.<br />
However, as we began crafting the report we continued to discover other indicators we<br />
wanted to include.<br />
In the end, rather than strictly following a framework we allowed the report to develop<br />
more organically based on the information available to us in consultation with our<br />
volunteers and community partners.<br />
As the report progressed, and the number of indicators increased, we decided the<br />
amount of information was too vast to contain within a single report. As such, Quality<br />
of Life in Perth & Huron County <strong>2023</strong> became a series of five reports: Who We Are, A<br />
Diverse Community, A Strong Economy, A Healthy Well-Being, and A Clean Environment.<br />
Each report is accompanied by a data summary.
Recommendations<br />
Throughout the process of creating this report, we<br />
collaborated closely with diverse community partners to<br />
develop recommendations based on our findings. We provide<br />
recommendations for different levels of government, for community<br />
organizations and businesses and sometimes for individuals.<br />
Sources and Limitations<br />
The data in this report is drawn from a wide variety of local,<br />
provincial and national sources. These sources vary in their scope<br />
and applicability. Some accurately reflect the whole population.<br />
Others may only reflect part of the population. And it is always<br />
possible that errors or omissions have been made. Additionally, the<br />
COVID-19 pandemic seriously disrupted all types of organizations,<br />
often affecting their ability to collect consistent data. With this in<br />
mind, we should exercise caution as we interpret and analyze this<br />
data and we should hesitate to draw firm conclusions.
Who We Are<br />
Located in Southwestern Ontario, Perth and Huron Counties are<br />
rich agricultural regions with more than 4,850 farms and around<br />
8<strong>11</strong>,637 farm area-acres, two-thirds of which are in Huron County.<br />
The City of Stratford and the Town of St. Mary’s are the most<br />
significant population centres in Perth and have their own municipal<br />
governments. Goderich is Huron County’s largest community.<br />
17<br />
2,300<br />
Municipalities<br />
People identify as<br />
Indigenous<br />
4,850<br />
Farms<br />
58,105<br />
Households<br />
8.1%<br />
of the Population<br />
are Immigrants<br />
Size and Population Growth<br />
According to the last three censuses, Canada is maintaining a<br />
consistent rate of growth. Overall, the population changed by 5.2%,<br />
however, Ontario has a more rapid increase of 5.8%.<br />
Canada<br />
Ontario<br />
Census Population<br />
Population<br />
Change<br />
Census Population<br />
20<strong>11</strong> 33,476,688 20<strong>11</strong> 12,851,8<strong>21</strong><br />
2016 35,151,728 5% 2016 13,448,495<br />
20<strong>21</strong> 36,991,981 5.20% 20<strong>21</strong> 14,223,942<br />
Population<br />
Change<br />
4.60%<br />
5.80%<br />
Table 1: Population Change, Canada-Ontario<br />
Source: Statistics Canada, Census 20<strong>21</strong>, 2016, and 20<strong>21</strong>. Population and dwellings section.<br />
PERTH<br />
81,565<br />
HURON<br />
61,366<br />
143,130<br />
grew by<br />
5% (6,822)<br />
in five years
The Median Age in Perth and Huron is Higher Than the Province<br />
17% 59% <strong>21</strong>% 3%<br />
0-14 Years<br />
15-64 years 65-84 years<br />
85 years+<br />
Families and Households<br />
PERTH Private Households<br />
28% 1 person<br />
38% 2 person<br />
13% 3 person<br />
12%<br />
9%<br />
4 person<br />
5 or more<br />
persons<br />
#<br />
32,770<br />
Total private<br />
households<br />
HURON Private Households<br />
29% 1 person<br />
40% 2 person<br />
12% 3 person<br />
<strong>11</strong>%<br />
9%<br />
4 person<br />
5 or more<br />
persons<br />
#<br />
25,335<br />
Total private<br />
households
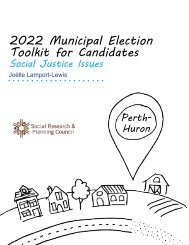
Ontarians Relocating is a Main Contributor to<br />
Population Growth<br />
The main factor contributing to population growth in our economic<br />
region, the Stratford-Bruce Peninsula is net intraprovincial migration<br />
— individuals moving from elsewhere in Ontario — with rates<br />
increasing significantly over the last five years. In the last year’s<br />
period (2020 to 20<strong>21</strong>) the net interprovincial loss — individuals<br />
moving out of province — of 469 people was the most significant<br />
loss over the last five years.<br />
2020-20<strong>21</strong><br />
296 296<br />
-469 -469<br />
366 366<br />
4146<br />
4146<br />
2019-2020<br />
91 91<br />
-94 -94<br />
304<br />
304<br />
4,033<br />
4,033<br />
2018-2019<br />
196<br />
196<br />
-17<br />
-17<br />
370<br />
370<br />
3,504<br />
3,504<br />
2017-2018<br />
620<br />
620<br />
3,594<br />
87<br />
3,594<br />
87 370<br />
370<br />
2016-2017<br />
295<br />
295<br />
3,319<br />
-95<br />
3,319<br />
-95<br />
320<br />
320<br />
2015-2016<br />
422<br />
422<br />
1,575<br />
-134<br />
1,575<br />
-134<br />
325<br />
325<br />
-18<br />
-18<br />
769<br />
2014-2015 -483<br />
769<br />
-483<br />
232<br />
232<br />
-39<br />
-39<br />
356<br />
2013-2014<br />
-470<br />
356<br />
-470<br />
237<br />
237<br />
55<br />
55<br />
733<br />
2012-2013<br />
-442<br />
733<br />
-442<br />
252<br />
252<br />
-15<br />
-308-15<br />
20<strong>11</strong>-2012 -308 -351<br />
-351<br />
<strong>21</strong>8<br />
<strong>21</strong>8<br />
-1000<br />
-1000 0<br />
0<br />
1000<br />
1000<br />
2000<br />
2000<br />
3000<br />
3000<br />
4000<br />
4000<br />
5000<br />
Net non-permanent residents Net intraprovincial migration<br />
Net interprovincial migration Inmigrants<br />
Net non-permanent residents Net intraprovincial migration Net interprovincial migration Immigrants<br />
Graph: Population Mobility<br />
Source: Statistics Canada, Annual Demographic Estimates: Sub-provincial Areas. Population estimates and growth.
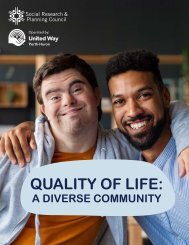
A Diverse Community<br />
A community can be diverse in many ways. It might<br />
be home to people from a range of ethnic, racial and<br />
cultural backgrounds. Community members may have<br />
different lifestyles, interests, values and experiences.<br />
Encouraging and maintaining a diverse community<br />
involves appreciating and respecting the ways<br />
people can be different from one another. , , When we<br />
reflect diversity, such as race, gender, age, ethnicity,<br />
socioeconomic status, culture, and (dis)ability in our<br />
communities and structures, we’re more likely to<br />
have more engagement and better outcomes for all.<br />
Although there is plenty of variation among residents of<br />
Perth and Huron, our region is less diverse than other<br />
parts of our province, something we share with other<br />
rural regions.<br />
Indigenous Population in Perth-<br />
Huron is Small, But Significant<br />
Indigenous refers to people who identify as First<br />
Nations, Métis or Inuit. First Nations refers to a broad<br />
range of Indigenous communities who are distinct<br />
from the Métis and Inuit. Métis refers to communities<br />
or individuals of mixed Indigenous and European<br />
ancestry. Inuit refers to an Indigenous people historically<br />
located in the Arctic. The Indigenous population in<br />
Perth-Huron is slightly smaller proportionally than<br />
across the province, but it is not insignificant. Over<br />
2,300 individuals in the Perth-Huron region identify as<br />
Indigenous.<br />
2,300<br />
individuals in Perth-<br />
Huron identify as<br />
Indigenous.<br />
Established in 2008, the Truth and<br />
Reconciliation Commission formally<br />
documented the history and impacts<br />
of Canada’s residential school system<br />
which operated between 1831 and<br />
1996. It is estimated 150,000 First<br />
Nations, Inuit and Métis children were<br />
forcibly separated from their families<br />
and made to attend residential<br />
schools. Thousands died at the<br />
schools or because of the horrendous<br />
abuse they experienced in the system<br />
and thousands remain missing. The<br />
Commission released its final report<br />
along with 94 Calls to Action in 2015<br />
after years of gathering testimonies<br />
from survivors and witnesses.
Racialized Population is Small for Province,<br />
Like Other Rural Areas<br />
According to Statistics Canada, 5.5% of the population<br />
in Perth and 2% of the population in Huron are racialized<br />
populations. While this is much smaller than the provincial<br />
ratio of 34.3%, these numbers are consistent with other rural<br />
regions. Compared to some other rural areas, Perth and<br />
Huron have a slightly larger population of racialized groups.<br />
The largest racialized population in Perth is South Asian, while<br />
in Huron the largest population is Black.<br />
2%<br />
6%<br />
34%<br />
of Huron are<br />
racialized<br />
of Perth are<br />
racialized<br />
of Ontario are<br />
racialized<br />
We Have a Proportionally High Number of<br />
Young Immigrants<br />
According to the 20<strong>21</strong> census, Huron is home to 4,200<br />
immigrants and Perth has 7,310 immigrants. In other words,<br />
7% of the population in Huron and 9.1% of the population<br />
in Perth were born outside Canada. While these numbers<br />
are lower than the province overall, they are consistent with<br />
other rural areas in Ontario.<br />
Across Perth, Huron and the rest of Ontario, most<br />
immigrants were between the ages of 25 and 44 when they<br />
arrived in Canada. However, Perth and Huron have seen<br />
significantly more young immigrants proportionally than<br />
Ontario as a whole.<br />
8%<br />
of the Perth-Huron<br />
population was born<br />
outside Canada
24% of Ontarians Identify as Having a Disability<br />
Every five years, Statistics Canada conducts the Canadian Survey<br />
on Disability (CSD). According to the most recent one from 2017,<br />
24.1% of people in Ontario identify as persons with a disability<br />
either visible or not visible. 14.7% of people aged 15 to 44, 31.2%<br />
aged 45 to 74 and 53.5% aged 75 and over identify as persons with<br />
a disability. Data for the next CSD is currently being collected.<br />
There is a Significant Gap in Data on the<br />
LBTQ2S+ Community<br />
There is a lot of missing data when it comes to the LGBTQ2S+<br />
population in Perth and Huron, including limited data available<br />
from Statistics Canada through the last census. Out of <strong>11</strong>,782,845<br />
people in Ontario, around 24,000 people identify as transgender<br />
and roughly 15,000 as non-binary persons. However, Statistics<br />
Canada data for our region does not reference transgender or<br />
non-binary identities. Instead, data is broken down by men+<br />
(which includes men, boys and some non-binary persons) and<br />
women+ (which includes women, girls and some non-binary<br />
persons). Similar patterns are seen for data on sexual orientation.<br />
While it is collected, it cannot always be reported. Data must be<br />
aggregated this way because of small population sizes and to<br />
protect the confidentiality of respondents. But it also prevents us<br />
from understanding our community.
Language Family Region of Origin Language<br />
Tai-Kadai<br />
Southern China, Northeast India,<br />
Southeast Asia<br />
Lao, Thai<br />
Sino-Tibetan China, India, Myanmar, Nepal Mandarin, Cantonese<br />
Italic (Romance)<br />
Indo-Iranian<br />
Dravidian<br />
Austronesian<br />
Italy, Spain, Portugal, Romania<br />
India, Iran, Afghanistan, Tajikistan, Iraq,<br />
Turkey, Pakistan, some areas of the<br />
Caucasus Mountains<br />
Southern India, Northeast Sri Lanka,<br />
Southwest Pakistan<br />
Philippines, Indonesia, Madagascar,<br />
Vietnam, Cambodia, Laos, Taiwan<br />
Italian, Portuguese, Romanian,<br />
Spanish<br />
Gujarati, Hindi, Nepali, Punjabi,<br />
Urdu, Persian<br />
Malayalam, Tamil, Telugu<br />
Ilocano, Pangasinan, Tagalog<br />
Afro-Asiatic North Africa, Southwest Asia Amharic, Arabic, Tigrigna<br />
Indo-European<br />
Europe, Asia, Northern India<br />
Balto-Slavic, Polish, Russian,<br />
Serbian, Ukrainian, Germanic<br />
(German, Pennsylvania German),<br />
Dutch, Low German, Plaudietsch,<br />
Greek<br />
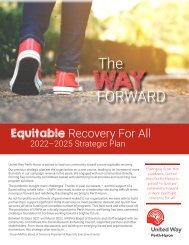
Religious Diversity<br />
According to Statistics Canada, 65% of<br />
the population in Perth-Huron identifies as<br />
Christian, 33% practice no religion and/<br />
or holds a secular perspective (atheism,<br />
agnosticism and humanism, for instance),<br />
and 2% practice various other religions<br />
(Buddhist, Hindu, Jewish, Muslim, Sikh,<br />
Traditional (North American Indigenous)<br />
Spirituality).<br />
Graph: Religious Identity<br />
Source: Statistics Canada, Census 20<strong>21</strong>.<br />
65% Christian<br />
33%<br />
No religion/<br />
secular<br />
2%<br />
Other
Recommendation<br />
Individual /<br />
Community<br />
Organizations<br />
Businesses<br />
Municipal<br />
Gov.<br />
Provincial<br />
/Federal<br />
Gov.<br />
1<br />
2<br />
3<br />
4<br />
5<br />
6<br />
7<br />
8<br />
Learn about Canada’s colonial roots and take<br />
responsibility for meeting the Calls to Action issued<br />
by the Truth and Reconciliation Commission.<br />
Engage with the local Indigenous community to<br />
identify and establish self-determined resources,<br />
such as Friendship Centres in Perth-Huron, that<br />
will among other things, provide opportunities for<br />
collaboration and learning.<br />
The federal government, through IRCC, provides<br />
funding to establish an Immigration Partnership to<br />
better support newcomers and newcomer-serving<br />
organizations in Stratford, St. Marys and Perth<br />
County.<br />
Provincial and federal governments fund programs<br />
and services such as settlement, employment,<br />
language learning, etc., for temporary residents.<br />
Municipal government, community members,<br />
organizations and business engage with Immigration<br />
Partnerships and other programs to support<br />
newcomers, regardless of immigration status, to<br />
create welcoming communities.<br />
Local agencies and governments collaborate to<br />
ensure the availability of quality data on those living<br />
with disabilities.<br />
Local agencies and government collect data in a<br />
manner that complies with the Ontario government’s<br />
Data Standards for the Identification and Monitoring<br />
of Systemic Racis.<br />
Local agencies and governments ensure that gender<br />
diverse options for self-identification are available in<br />
surveys and other data collection tools.
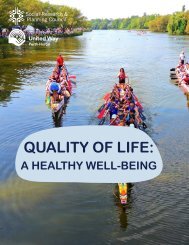
A Healthy Well-Being<br />
This report also describes factors contributing to individual health.<br />
There are societal conditions that keep people healthy which will be<br />
described in Economic Quality of Life in more detail, such as adequate<br />
income, meaningful work, decent housing and healthy food. Shifting<br />
these conditions requires collective action across society to create<br />
equitable communities and policies enabling everyone to enjoy health<br />
and well-being.<br />
Many Youth Struggle with Mental Health,<br />
Worse in Pandemic<br />
Among youth, 30% reported feeling depressed most days in the last<br />
week and 38% felt nervous, anxious or on edge most days in the<br />
last two weeks. As a result of the COVID-19 pandemic, 51% reported<br />
their anxiety increased and 54% reported their loneliness increased.<br />
According to the Ontario Student Drug Use and Health Survey<br />
(OSDUHS) conducted by the Centre for Addiction and Mental Health,<br />
42% of students in Ontario report they wanted to speak with someone<br />
about a mental health problem in the past year but did not know who to<br />
go to.<br />
Youth Use Screens More Than Recommended<br />
According to the Canadian 24-Hour Movement Guidelines, youth aged<br />
five to 13 should have nine to <strong>11</strong> hours of uninterrupted sleep per night<br />
and those aged 14 to 17 should have eight to 10 hours. Among youth,<br />
59% are meeting these guidelines.<br />
24%<br />
of Ontario students<br />
are depressed about<br />
the future because of<br />
climate change<br />
50%<br />
of Ontario students<br />
report being worried<br />
about climate change<br />
Vaping Has Increased in Youth<br />
In Perth-Huron, 10% of youth are smokers and 31% have not smoked<br />
but are susceptible to begin in the future. Meanwhle, underage drinking<br />
increases the risk of heavy alcohol consumption in adulthood. Among<br />
local youth, 24% reported binge drinking in the past month. Smoking<br />
and alcohol consumption were exacerbated by the COVID-19 pandemic<br />
as <strong>21</strong>% reported their alcohol intake increased and 14% reported their<br />
vaping use increased. In the case of vaping, 26% of youth indicated they<br />
vaped in the last 30 days.<br />
Efforts to improve overall youth health and well-being and reduce<br />
social and health inequities can go a long way toward minimizing the<br />
risk of substance-related harms. These include healthy relationships,<br />
community connections, access to high-quality education and a safe<br />
community and school environment.<br />
94%<br />
of youth spend more<br />
than two hours a day<br />
on recreational screen<br />
time<br />
*The OSDUHS reports<br />
on Ontario numbers.<br />
These statistics are not<br />
specific to the Perth-<br />
Huron region
Perth-Huron Less<br />
Stressed Than Province<br />
42%<br />
41%<br />
40%<br />
39%<br />
Percentage<br />
38%<br />
37%<br />
36%<br />
35%<br />
34%<br />
33%<br />
32%<br />
Under 36 Over 36<br />
Age<br />
Perth<br />
Huron<br />
Reported Life Stress<br />
Source: Statistics Canada. <strong>2023</strong>. (table). Census Profile.<br />
20<strong>21</strong> Census of Population.<br />
Activity Levels Decrease<br />
With Age, Down Overall<br />
According to the 24-Hour<br />
Movement Guidelines, adults<br />
need to be engaged in at least<br />
150 minutes of moderate to<br />
vigorous intensity physical<br />
activity per week to be<br />
considered physically active.<br />
Muscle-strengthening activities<br />
should be done at least twice<br />
a week using major muscle<br />
groups.<br />
Percentage<br />
90%<br />
80%<br />
70%<br />
60%<br />
50%<br />
40%<br />
30%<br />
20%<br />
10%<br />
0%<br />
2016 2017 2018 2020<br />
Year<br />
12 to 36 36 and Over<br />
Physical Activity Levels<br />
Source: Environics Analytics. Community Life 20<strong>21</strong>.
Incidence of Chronic Diseases<br />
Chronic diseases are non-communicable (not passed from personto-person),<br />
typically last for longer than one year, develop slowly over<br />
time, require ongoing medical treatment and may limit a person’s<br />
ability to perform daily activities. Chronic diseases result from several<br />
factors — some known and some unknown, some modifiable and<br />
some non-modifiable — such as age. Tobacco use, physical inactivity,<br />
harmful use of alcohol and poor nutrition are risk factors for chronic<br />
diseases. Poor nutrition can be a result of food insecurity — the lack<br />
of access to nutritious foods — and impact a person’s ability to follow<br />
healthy eating guidelines. Smoking any substance is a major cause<br />
of chronic disease. Meanwhile, alcohol is the leading preventable<br />
cause of death, disability and social problems. This includes certain<br />
cancers, cardiovascular disease, liver disease, unintentional injuries<br />
and violence.<br />
Poor nutrition can be a<br />
result of food insecurity —<br />
the lack of access to nutritious<br />
foods — and impact<br />
a person’s ability to follow<br />
healthy eating guidelines.<br />
Perth-Huron Has Fewer Residents With Bachelor’s<br />
Degrees or Higher, But Higher Than Province for<br />
Apprenticeship, College or CEGEP Certificates or<br />
Diplomas<br />
Education level is a significant predictor of quality of life. Investments<br />
in education bring social returns to individuals and society and reduce<br />
income inequality. More highly educated people are healthier, more<br />
active socially and better paid. Knowledge spillovers from education<br />
generate social benefits such as reduction in crime, improved health<br />
outcomes and intergenerational effects. Level of education also predicts<br />
democratic participation and education for future generations.
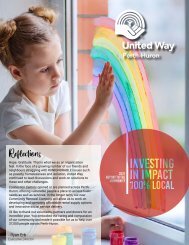
Most Municipal Candidates Are Male, Huron<br />
Saw More Female Candidates Than Perth<br />
Ashfield-Colborne-Wawanosh<br />
Bluewater<br />
Central Huron<br />
Goderich<br />
Howick<br />
Huron East<br />
Morris-Turnberry<br />
North Huron<br />
South Huron<br />
North Perth<br />
Perth East<br />
Perth South<br />
St Marys<br />
HURON PERTH<br />
Stratford<br />
West Perth<br />
0% 5% 10% 15% 20% 25% 30% 35% 40% 45% 50%<br />
Graph 9: Female Candidates in Huron & Perth 2022 Municipal Elections<br />
Source: AMO
Safety<br />
Living in safe communities is essential for well-being and personal<br />
security is a large component. If people feel safe walking in the dark in<br />
their neighbourhoods and communities, this reflects personal safety.<br />
80% 54% 52%<br />
of people in Huron<br />
feel safe walking<br />
after dark<br />
of people in Perth<br />
feel safe walking<br />
after dark<br />
of people in Stratford<br />
feel safe walking<br />
after dark<br />
School Bus-Related Incidents<br />
30<br />
25<br />
20<br />
15<br />
10<br />
5<br />
0<br />
2019 2020 20<strong>21</strong> 2022<br />
Perth<br />
Huron<br />
Graph 10: School Bus-Related Incidents<br />
Source: OPP and Stratford Police
Additional Capacity is Needed to Stop Intimate<br />
Partner Violence<br />
While intimate partner violence calls appear to be declining,<br />
information from women’s shelters and second stage housing<br />
providers indicates an increase in the acuity and complexity of<br />
gender-based violence cases.<br />
Police intimate partner<br />
violence calls<br />
Intimate partner<br />
violence charges<br />
Perth<br />
2020<br />
Huron<br />
2020<br />
Perth<br />
20<strong>21</strong><br />
Huron<br />
20<strong>21</strong><br />
Perth<br />
2022<br />
Huron<br />
2022<br />
726 658 940 617 564 423<br />
276 225 168 168 <strong>21</strong>8 74<br />
Table 3: Reported Intimate Partner Violence Occurances<br />
Source: Stop VAW; DART<br />
Percentage of<br />
People Experiencing<br />
Discrimination<br />
69%<br />
Immigrants &<br />
Visible Minorities<br />
81%<br />
Most Indigenous Residents, Immigrants and Visible<br />
Minorities Have Faced Recent Discrimination<br />
According to the 20<strong>21</strong> report on discrimination by the Huron<br />
County Immigration Partnership, Indigenous peoples are the most<br />
likely to experience discrimination in Perth and Huron, followed by<br />
immigrants and visible minorities.<br />
Indigenous<br />
Peoples<br />
49%<br />
White Non-<br />
Immigrants<br />
Factors Increasing Likelihood of Discrimination<br />
People who have fulltime/part-time/selfemployed<br />
status<br />
People aged 18-35<br />
People whose highest<br />
level of education was<br />
secondary school or lower<br />
People living in the region<br />
for less than 10 years
Recommendation<br />
Individual /<br />
Community<br />
Organizations<br />
Businesses<br />
Municipal<br />
Gov.<br />
Provincial<br />
/Federal<br />
Gov.<br />
1<br />
2<br />
3<br />
4<br />
5<br />
6<br />
7<br />
8<br />
9<br />
Individuals, community organizations, the education<br />
sector and other relevant partners find solutions<br />
related to decreasing screen time for youth.<br />
Service clubs, non-profits and municipalities<br />
continue and expand funding for free recreational<br />
programs, particularly for youth, increasing barrierfree<br />
opportunities for activity and social interaction.<br />
Municipal governments address declining physical<br />
activity levels through supporting the inclusion of<br />
active modes of transportation in infrastructure plans.<br />
Municipal governments use an equity and inclusion<br />
lens when designing new parks to enable physical<br />
activity opportunities for children and youth of all<br />
abilities, in addition to providing a gathering space<br />
for the entire community.<br />
Libraries across Perth-Huron continue supporting<br />
and expanding lending programs including passes<br />
and equipment to access parks and recreational<br />
opportunities.<br />
The Ontario Ministry of Education promote eating<br />
well by including mandatory curriculum teaching<br />
how to shop and prepare food.<br />
Provincial government works in collaboration<br />
with community partners to implement policies<br />
that strengthen alcohol regulations and introduce<br />
mandatory labelling.<br />
The municipal government ban non-tobacco<br />
flavoured vaping products (”vape”) and restrict<br />
advertising and promotion.<br />
All levels of government, along with workplaces,<br />
create smoke-free and vape-free spaces.<br />
10<br />
Community and government-funded organizations<br />
ensure there are vaping cessation programs for<br />
youth and adults.
Recommendation<br />
Individual /<br />
Community<br />
Organizations<br />
Businesses<br />
Municipal<br />
Gov.<br />
Provincial<br />
/Federal<br />
Gov.<br />
<strong>11</strong><br />
12<br />
13<br />
14<br />
15<br />
16<br />
17<br />
18<br />
19<br />
Governments, academics, and public health officials<br />
continue studying public health measures to reduce<br />
risky behaviour in youth, including harm reduction<br />
and further restricting or banning of products which<br />
disproportionately appeal to youth.<br />
Provincial government increases resources and<br />
implements sustainable funding for graduation coach<br />
roles.<br />
Provincial government uses a broader assessment<br />
strategy including transferrable skills and<br />
competencies that are already part of the curriculum<br />
to better reflect the full scope of learning.<br />
Municipal government and community organizations<br />
work with community members to identify<br />
opportunities to enhance social infrastructure such<br />
as parks, libraries and recreation centres.<br />
All levels of government ensure polling stations<br />
offer learning opportunities for children to increase<br />
awareness among future voters.<br />
MPs, MPPs, schools and libraries collaborate, engage<br />
and excite children about the electoral process<br />
during election periods.<br />
Federal and provincial voter registration websites<br />
should include resources for young voters to increase<br />
engagement.<br />
The federal government should continue funding<br />
programs to increase women’s participation in<br />
municipal leadership.<br />
(separate recommendations)<br />
Grassroots organizations in Perth-Huron should seek<br />
funding to support more diverse candidates.<br />
Service providers and community organizations work<br />
collaboratively to reduce the stigma related to mental<br />
health and addictions.
Recommendation<br />
Individual /<br />
Community<br />
Organizations<br />
Businesses<br />
Municipal<br />
Gov.<br />
Provincial<br />
/Federal<br />
Gov.<br />
20<br />
<strong>21</strong><br />
22<br />
23<br />
24<br />
25<br />
26<br />
27<br />
Federal and provincial governments consider funding<br />
the installation of school bus stop-arm cameras to<br />
enforce school bus-related infractions and collect<br />
better data on incidents.<br />
Community services raise awareness among drivers<br />
by increasing the number of public safety messages<br />
on local media around school bus safety rules prior<br />
to the start of the school year.<br />
All levels of government continue working towards<br />
a Vision Zero and Safe Systems approach to road<br />
safety including safe speeds, road design, vehicles,<br />
land use planning as well as post-crash care.<br />
Province should improve educational curricula<br />
around healthy relationships, gender expression and<br />
what constitutes violence, risk factors and warning<br />
signs, particularly to reach youth early in life.<br />
Provincial and municipal governments should<br />
provide sustainable funding for advocacy, education<br />
and coordination of VAW services and among<br />
systems which survivors frequently interact with.<br />
Municipal leadership in Perth-Huron, in<br />
partnership with other municipalities and regional<br />
community services, support the development of<br />
a discrimination reporting and referral tool geared<br />
towards recording and reporting accounts of<br />
discrimination, as well as directing people affected by<br />
discrimination to community resources and supports.<br />
Workplaces, local government, non-profits and<br />
community organizations engage in diversity<br />
education and training focused on reducing and<br />
preventing discrimination with an emphasis on<br />
countering stereotypes, encouraging perspectivetaking<br />
and finding common ground.<br />
The provincial government funds the implementation<br />
of Community Safety and Well-Being Plans.
A Strong Economy<br />
Economic factors have a critical impact on quality of life.<br />
Employment is a significant contributor to overall quality of<br />
life. Employment, income and financial security directly impact<br />
one’s ability to afford essentials such as adequate housing, food,<br />
energy, internet and transportation. Emotional, physical and<br />
mental well-being is connected to accessing these critical rights<br />
Incomes in Perth-Huron are Lower Than<br />
Provincial Median<br />
While low income is an indicator of living in poverty, it is not the<br />
same thing. Poverty is complex and can be described as not<br />
having enough money or access to resources to enjoy a decent<br />
standard of living. It extends beyond having enough income to<br />
afford only necessities — such as food or shelter — and is about<br />
exclusion. As such, poverty is difficult to define.<br />
According to Living Wage Canada, a living wage is the hourly<br />
wage every adult in a household needs to earn to cover basic<br />
expenses and participate in the community. In Ontario, a specific<br />
living wage is calculated for every region.<br />
The minimum wage is the lowest wage an employer can legally<br />
pay their staff. It is not based on a calculation of the cost of living,<br />
nor adjusted annually.<br />
The most recent living wage for Perth-Huron, released in<br />
November <strong>2023</strong>, is $22.75 per hour. As of October 1, <strong>2023</strong>, the<br />
Ontario minimum wage is $16.65 per hour and $15.60 for students.<br />
The gap between minimum wage and living wage in Perth-<br />
Huron is over $6 per hour.<br />
45%*<br />
of residents over the age of 15 made<br />
less than a living wage as of 2020<br />
*Calculated with 2020 taxfiler data and<br />
based upon 2022 Living Wage Rate<br />
2020<br />
median<br />
household<br />
income<br />
Perth<br />
$74,500<br />
Huron<br />
$70,000<br />
Ontario<br />
$79,500<br />
2020 median<br />
one-person<br />
household<br />
income<br />
Perth<br />
$37,600<br />
Huron<br />
$36,400<br />
Ontario<br />
$39,200
The Number of Low-Income Households Dropped<br />
Due To Federal Assistance Programs<br />
The LIM-AT is defined as half the median family income after tax<br />
and varies based upon family size. LIMs are the most frequently<br />
used measurement internationally, especially to make comparisons<br />
between countries. It is widely-used because it is simple to<br />
measure, but not necessarily because it is the best measure of<br />
poverty.<br />
20%<br />
18%<br />
16%<br />
14%<br />
12%<br />
10%<br />
8%<br />
6%<br />
4%<br />
2%<br />
0%<br />
Perth 2016 Perth 20<strong>21</strong> Huron 2016 Huron 20<strong>21</strong><br />
0-17 18-64 65+<br />
Low-Income Population Based on LIM-AT by Age (%)<br />
Source: Statistics Canada<br />
More of the Perth Population is Active in<br />
Labour Force, More Men<br />
The labour force participation rate speaks to the proportion<br />
of the overall population over the age of 15 that is working<br />
or actively seeking work. In Perth, 66.3% of the population<br />
15 and over is actively participating in the labour force.<br />
In this instance, a high participation rate and a low<br />
unemployment rate indicate a robust job market. However,<br />
the participation rates for men and women are significantly<br />
different. The participation rate for men is 72% and for<br />
women it is 60.8%. A similar trend is evident in Huron, with<br />
an overall participation rate of 60.9% but 66% for men and<br />
55.9% for women.<br />
The non-profit<br />
sector contributes<br />
7.9%<br />
to Ontario’s GDP<br />
and employs<br />
844,000<br />
people<br />
77% of whom<br />
are women.<br />
Source: The Ontario Non-Profit<br />
Network
Historically, Perth-Huron Has One of the<br />
Lowest Unemployment Rates in Ontario<br />
10<br />
9<br />
8<br />
Unemployment Rate (%)<br />
7<br />
6<br />
5<br />
4<br />
3<br />
2<br />
1<br />
0<br />
2016 2017 2018 2019 2020 20<strong>21</strong> 2022<br />
Year<br />
Stratford-Bruce Peninsula<br />
Ontario<br />
Unemployment rate in Stratford-Bruce Peninsula and Ontario<br />
Source: Statistics Canada, Labour Force Survey, <strong>2023</strong>. *Data has not been seasonally adjusted<br />
Childcare<br />
While the workforce in Canada rebounded following the COVID-19<br />
pandemic, reports indicate that workforce gaps between men and<br />
women remain and childcare has been identified as a significant<br />
contributing factor. During the pandemic, more than 1.6 million<br />
women in Canada left the workforce. Women are more likely to<br />
work in sectors directly impacted by COVID-19, such as education,<br />
childcare, service and tourism. The biggest decline in participation<br />
rates was for women who had school-aged children. Even among<br />
men, participation gaps exist for those with children and those<br />
without. The largest participation gap is 18.4% between men and<br />
women with children under the age of six.<br />
Among women who are not working, the main reasons they report<br />
being out of the workforce are personal and family responsibilities.<br />
Women working part-time reported that childcare was the<br />
biggest reason they could not work full-time.<br />
1,636<br />
children on<br />
waitlist in Perth<br />
265<br />
children on<br />
waitlist in Huron<br />
The lack of early childhood<br />
educators has impacted the<br />
delivery of services in Perth-<br />
Huron. Licensed daycares, as<br />
well as multiple before and after<br />
school childcare programs,<br />
ceased operating in mid-<strong>2023</strong>.
A Greater Percentage of People in Perth-Huron are<br />
Self-Employed Compared to the Province<br />
HURON<br />
PERTH<br />
18% Self-Employed <strong>21</strong>%<br />
82% Employee<br />
79%<br />
Self-Employed workers in Perth and Huron<br />
Source: Statistics Canada<br />
Housing is a Human Right<br />
Housing is generally considered “affordable” if all shelter<br />
costs amount to less than 30% of a household’s before-tax<br />
income. Shelter costs include rent, mortgage payments and<br />
any necessary repairs. In our region, fewer homeowners than<br />
renters are living in unaffordable housing. In Perth, 17% of<br />
homeowners spend more than 30% of their income on shelter<br />
costs, while the number is 16% in Huron. By contrast, almost<br />
33% of renter households in Perth and 31% in Huron are<br />
spending 30% or more of their income on shelter costs.<br />
Subsidized housing refers to any housing subsidized in a<br />
variety of ways to make it financially accessible to low-income<br />
individuals and families. It includes rent-geared-to-income<br />
housing, co-op housing, social housing, public housing,<br />
government-assisted housing, non-profit housing and housing<br />
subsidized by rent supplements and housing allowances. In<br />
Perth, 14% of tenants are living in subsidized housing, while<br />
the number is 15% in Huron. Waitlists for subsidized housing<br />
are long and, anecdotally, many individuals will have to wait<br />
as much as five years to move into housing.<br />
14%<br />
of people in<br />
Perth-Huron are<br />
experiencing housing<br />
poverty<br />
129<br />
people in Perth<br />
are experiencing<br />
homelessness
Housing Market is Tight<br />
The Canada Mortgage and Housing Corporation’s (CMHC)<br />
Rental Market Survey collects rent rates, availability and<br />
vacancy and turnover data for urban areas with populations<br />
of 10,000 or more. These are used in setting government<br />
and housing policies. The survey targets private structures<br />
on the market for at least three months with at least three<br />
rental units. While useful for urban areas such as the City or<br />
Stratford and North Perth (Listowel), data is not available for<br />
most areas in Perth-Huron.<br />
The Alternate Average Market Rent (AAMR) collects<br />
accurate data on current rental market prices from<br />
residential advertisements in areas not covered by the<br />
CMHC survey. While the CMHC survey includes both<br />
occupied and available rental units, the AAMR covers units<br />
that are available for rent, providing an accurate reflection of<br />
rental prices. The AAMR also covers structures with 1–2 units<br />
and is not only restricted to structures with three or more<br />
units. Many units in both the Perth and Huron rental markets<br />
are owned by landowners with only one or two units.<br />
The<br />
median<br />
household<br />
earning $73,286<br />
spends 29%<br />
on rent<br />
The median<br />
one-adult<br />
household<br />
earning $37,000<br />
spends 46%<br />
on rent<br />
2020 AAMR<br />
from CMHC<br />
20<strong>21</strong> Service<br />
Manager Area<br />
Rental Scan<br />
%<br />
Difference<br />
One bedroom $889 $1,253 41%<br />
Two bedrooms $1,034 $1,487 44%<br />
Three plus bedrooms $1,182 $1,894 60%<br />
Comparison Between CMHC AAMRs and Local Rental Housing Costs<br />
City of Stratford. (20<strong>21</strong>). 20<strong>21</strong>-2 Request Alternate Average Market Rents Business Case.<br />
*The CMHC does not<br />
collect rental data in<br />
Huron due to a small<br />
population size. Instead,<br />
the Canada-Ontario<br />
Housing Benefit<br />
(COHB) data is used<br />
for the Huron County<br />
comparison.<br />
2022 AAMR<br />
from COHB*<br />
2022 Service<br />
Manager Area<br />
Rental Scan<br />
%<br />
Difference<br />
One bedroom $954 $1,345 41%<br />
Two bedrooms $1,144 $1,428 25%<br />
Three plus bedrooms $1,381 $1,800 30%<br />
Comparison Between COHB AAMRs and Local Rental Housing Costs<br />
Huron County. (2022)
Some Causes of<br />
Homelessness<br />
Systemic Barriers<br />
Low income, inadequate<br />
supports for vulnerable<br />
populations<br />
Examples of Self-<br />
Identified Causes<br />
Incarceration, relationship<br />
breakdowns/divorce,<br />
unsafe housing conditions<br />
Some Exacerbating<br />
Factors<br />
Relationship Conflict<br />
Abuse, illness or<br />
mental health<br />
Lack of Housing<br />
Eviction, unaffordable<br />
housing, unsafe housing<br />
conditions<br />
Personal Challenge<br />
Relational, behavioural,<br />
emotional or physical<br />
Discrimination<br />
by race, gender, sexual<br />
orientation or ability<br />
Addiction<br />
or substance misuse<br />
Energy Poverty is Higher in Rural Areas<br />
Households experience energy poverty when they face significant<br />
challenges meeting home energy needs, paying for home energy costs<br />
or affording other necessities because of energy costs. Households<br />
experiencing energy poverty are significantly more likely to suffer from<br />
poorer general and mental health. Households in rural regions are more<br />
likely to experience energy poverty than households in urban areas.<br />
Several municipalities within Perth-Huron are not serviced by natural<br />
gas. This means households are paying more to heat their homes and<br />
water, increasing the cost of living significantly. Additionally, there<br />
are competitive disadvantage for businesses. Portions of Ashfield-<br />
Colbourne-Wawanosh, Morris-Turnberry and Perth East do not have<br />
natural gas service.<br />
In Stratford, approximately 39% of households spend more than 6%<br />
of their income on energy costs, meaning they have a high to extreme<br />
home energy cost burden.<br />
6%<br />
Any household that<br />
spends more than 6%<br />
of after-tax income on<br />
home energy costs is<br />
considered to live in<br />
energy poverty.<br />
Internet Access and Broadband Investment is Needed<br />
Internet access has become a necessity for nearly all of us. The internet<br />
enables access to information, education, healthcare and, increasingly,<br />
employment in remote and rural communities. Many municipalities have<br />
91–100% coverage, meaning over 90% of the municipality has internet<br />
access. Howick ranks lowest in terms of broadband coverage in Perth-<br />
Huron, followed by Perth East. Municipal governments have made highspeed<br />
broadband internet access a priority and significant infrastructure<br />
investments have been or will be made.
Recommendation<br />
Individual &<br />
Community<br />
Businesses &<br />
Organization<br />
Municipal<br />
Gov.<br />
Provincial<br />
/Federal<br />
Gov.<br />
1<br />
2<br />
3<br />
4<br />
5<br />
6<br />
7<br />
8<br />
9<br />
10<br />
Employers increase their rates of pay to a living wage<br />
and certify with the Ontario Living Wage Network.<br />
Employers currently paying a living wage ensure<br />
procurement policies and supply chain decisions<br />
reflect the local living wage.<br />
The provincial government raises the minimum wage<br />
to a living wage.<br />
Employers in all sectors perform both a salary audit<br />
to collect gender pay discrepancy data and address<br />
any pay inequities that emerge.<br />
The provincial government increases social<br />
assistance rates to the equivalent of a living wage<br />
so recipients can more adequately meet their basic<br />
needs, increase earnings exemptions and exemption<br />
rates for recipients and index rates to inflation.<br />
All levels of government establish policies that<br />
support income-based solutions to food insecurity<br />
including a living wage and guaranteed income.<br />
Provincial and municipal government increases<br />
funding and resources to support and encourage<br />
small business entrepreneurship.<br />
The federal government extends the interest-free<br />
full loan repayment period (i.e., the qualifying period<br />
for partial loan forgiveness) by at least one year, to<br />
December 31, 2024, for Canada Emergency Business<br />
Account (CEBA) and Regional Relief and Recovery<br />
Fund (RRRF) loans.<br />
All levels of government provide stable, long-term<br />
and flexible operational funding for nonprofits that<br />
keeps pace with inflation and reflects the true costs<br />
of delivering programs and services.<br />
Employers provide as much flexibility as feasible to<br />
accommodate the diverse needs of the workforce.
Recommendation<br />
Individual &<br />
Community<br />
Businesses &<br />
Organization<br />
Municipal<br />
Gov.<br />
Provincial<br />
/Federal<br />
Gov.<br />
<strong>11</strong><br />
12<br />
13<br />
14<br />
15<br />
16<br />
17<br />
18<br />
19<br />
The federal government and the Canadian Mortgage<br />
and Housing Corporation utilize an alternative<br />
methodology for the Rental Market Survey to collect<br />
data in rural areas that is both reliable and reflective<br />
of rural communities and their housing markets.<br />
All levels of government collaborate with the private<br />
and non-profit sectors to incentivize and facilitate<br />
the development of affordable housing, particularly<br />
tailored to rural municipalities.<br />
The provincial government increases funding for<br />
municipalities and non-profits to expand access<br />
to and availability of supportive and transitional<br />
housing, as well as other emergency and long-term<br />
supports and services.<br />
Governments and utility providers apply a human<br />
rights lens when providing utility services to rural<br />
customers, ensuring all customers have universal<br />
access to services and clean energy.<br />
The federal government allocates funds for lowincome<br />
households to improve energy efficiency,<br />
move towards net-zero emissions targets and<br />
decrease energy poverty for vulnerable households.<br />
Government and providers invest further in universal<br />
access to broadband and cellular service, ensuring<br />
all residents have the critical infrastructure to support<br />
their inclusion.<br />
Governments, community members and businesses<br />
explore alternatives to a fixed route transit system to<br />
meet transportation needs.<br />
Municipal governments consider introducing a<br />
Municipal Accommodation Tax (MAT) to offset other<br />
budgetary items.<br />
The provincial government makes the Ontario<br />
Staycation Tax Credit an annual offering, providing<br />
economic support to the tourism and hospitality<br />
sector.
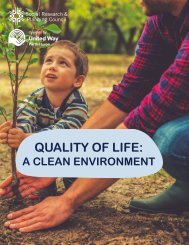
A Clean Environment<br />
The environment that surrounds us is fundamental to our<br />
existence. Our forests, rivers, lakes and soil allow us to have<br />
the food we eat, the water we drink and the air we breathe.<br />
Our health and prosperity rely on the natural world and<br />
we must keep it healthy in order to survive. For Indigenous<br />
peoples, their relationship to the land is spiritual. In our area,<br />
there are reasons to feel concerned about the environment,<br />
from a rise in Special Air Quality Statements to the state of<br />
our forests and wetlands.<br />
Our Climate is Changing<br />
Climate change refers to shifts in temperature and weather<br />
patterns (such as precipitation and wind) over long periods<br />
of time, often decades or more. Ontario uses a two-level<br />
air quality alert system. The number of Special Air Quality<br />
statements has been increasing since 2019, going from zero<br />
to three per year. Worsening air quality can be attributed to<br />
pollutants — including greenhouse gas (GHG) emissions —<br />
as well as the impacts of climate change, chiefly increasing<br />
temperatures and more wildfires.<br />
2081-<strong>21</strong>00<br />
2051-2080<br />
20<strong>21</strong>-2050<br />
1971-2000<br />
16<br />
14<br />
12<br />
10<br />
8<br />
6<br />
4<br />
2<br />
0<br />
Projecte<br />
Perth<br />
1971-20<br />
Projected Annual Temperatures in<br />
Perth, Stratford and Huron (C)<br />
Source: Environment and Climate Change<br />
Canada (<strong>2023</strong>, January 26). Perth, ON. Climate<br />
Data Canada<br />
OUR WATERSHED SCORES IN<br />
COMPARISON TO THE PROVINCE<br />
Most of Perth-Huron is covered by three conservation<br />
authorities: Maitland Valley, Ausable Bayfield and Upper<br />
Thames River. These three authorities release watershed<br />
report cards measuring groundwater quality, surface water<br />
quality, forest conditions and wetland conditions. The report<br />
cards allow authorities to benchmark conditions, measure<br />
change, identify issues and track progress for actions.<br />
Perth and Huron in Comparison to Ontario<br />
Surface Water (rivers, lakes, streams)<br />
Ground Water (important source of water<br />
found in cracks in soil, sand and rock)<br />
Forests and Wetlands<br />
SIMILAR to ON<br />
HIGHER than ON<br />
LOWER than ON
Our Six Largest Industrial Emitters<br />
The national Greenhouse Gas Reporting Program (GHGRP) collects<br />
information annually on GHG emissions from facilities emitting 10<br />
kilotonnes of GHGs or more. The GHGRP is mandatory and data is<br />
reported to Environment and Climate Change Canada. Industry is a<br />
backbone of Canada’s economy and is significant to our region. In Perth-<br />
Huron, six facilities meet the threshold and must report: St. Marys Cement<br />
(St. Marys), Compass Minerals (Goderich), Hendrickson Canada ULC<br />
(Stratford), Stackpole International (Stratford), Lactalis Canada Inc (West<br />
Perth) and Suntastic Hothouse Inc (South Huron). St. Marys Cement is<br />
by far the largest emitter, emitting more than five times as much as the<br />
other five facilities combined. Their emissions data, for the years these<br />
companies reported in the last five years, is shown in the following tables.<br />
The GHGs include:<br />
• Carbon dioxide (CO2)<br />
• Methane (CH4)<br />
• Nitrous oxide (N2O)<br />
• Hydrofluorocarbons (HFC)<br />
• Perfluorocarbons (PFC)<br />
• Sulphur hexafluoride (SF6)<br />
Suntastic Hothouse Inc. (Exeter)<br />
Compass Minerals Canada Coporation<br />
(Goderich)<br />
St. Marys Cement (St. Marys)<br />
Hendrickson Springs (Stratford)<br />
Lactalis Canada Inc. (Mitchell)<br />
Stackpole International (Stratford)<br />
GHG Emissions (kt) of Large Emitter Facilities<br />
Source: Statistics Canada. Greenhouse Gas Reporting Program (GHGRP).<br />
0 100000 200000 300000 400000 500000 600000<br />
20<strong>21</strong> 2020 2019 2018 2017<br />
Diversion Rates<br />
Region kg/hhld/yr 2019 2020 20<strong>21</strong><br />
Perth and Huron<br />
Stratford<br />
Waste 289.97 322.49 345.94<br />
Recycling 230.04 229.24 238.78<br />
Diversion % 44% 42% 41%<br />
Waste 394.74 365.37 349.33<br />
Recycling 259.93 3<strong>11</strong>.69 343.88<br />
Diversion % 40% 46% 50%<br />
Diversion Rates<br />
Source: Bluewater Recycling
Recommendation<br />
Individual &<br />
Community<br />
Businesses<br />
&<br />
Organization<br />
Municipal<br />
Gov.<br />
Provincial<br />
/Federal<br />
Gov.<br />
Climate change mitigation focuses on the reduction<br />
or prevention of climate change and its impacts.<br />
To mitigate climate change, actions must be taken<br />
to decrease GHG emissions. This can be done by<br />
finding other ways to heat buildings and replacing<br />
fueled vehicles and equipment with electric options<br />
Individuals can perform simple actions to reduce<br />
E. coli levels in surface water and improve beach<br />
water quality for everyone.<br />
Actions include:<br />
• Proper disposal of animal and human waste<br />
• Prevention of livestock grazing near lakes<br />
• Maintaining septic systems and decreasing the<br />
use of fertilizer and manure near lakes.<br />
• Not feeding wildlife — particularly geese and<br />
seagulls — at home and in public spaces<br />
• Reducing or eliminating the use of backyard<br />
pesticides<br />
• Implementing farming best practices including<br />
keeping manure storage in a flat area and<br />
covered to limit runoff<br />
• Implementing measures including buffer zones<br />
near lakes to prevent livestock grazing, as well<br />
as effectively managing stormwater runoff, could<br />
also have positive impacts on E. coli levels.<br />
Individuals work to protect groundwater sources by<br />
properly disposing of chemicals. To find out where<br />
and when disposal is offered, check with local waste<br />
management services and/or municipal government.<br />
Limit the use of chemicals, including fertilizers<br />
and winter salt, and always use and store these<br />
chemicals correctly to help protect groundwater.<br />
Ensuring unused wells are decommissioned and<br />
agricultural landowners consult OMAFRA’s source<br />
protection guide for best practices to protect<br />
vulnerable groundwater sources.
Recommendation<br />
Individual &<br />
Community<br />
Businesses<br />
&<br />
Organization<br />
Municipal<br />
Gov.<br />
Provincial<br />
/Federal<br />
Gov.<br />
Landowners, community groups, governments and<br />
businesses increase the forest cover and improve<br />
the sustainability of woodlots and urban forests in<br />
consultation with local conservation authorities.<br />
Biodiversity protects forests from insects and<br />
diseases, enhances resilience to climate variations<br />
and provides habitat for wildlife.<br />
Municipal governments share information on the<br />
benefits of urban forests to increase knowledge<br />
and awareness of the importance of the canopy in<br />
improving the land, air and water quality. They can<br />
also support private landowners through stewardship<br />
programs to preserve and enhance woodlots, among<br />
other environmental protection activities, and even<br />
offer access to provincial tax relief programs.<br />
Policy should change to transfer the issue of waste<br />
management to producers and incentivize them<br />
to reduce waste and create products for recycling.<br />
Currently, the cost of waste management falls mainly<br />
on municipalities, which means taxpayers.<br />
Municipal governments ensure that all residents,<br />
including small, rural and remote communities, have<br />
access to recycling.<br />
Provincial and federal governments increase funding<br />
to green infrastructure programs with a dedicated<br />
stream for natural infrastructure projects, particularly<br />
to replace and readapt aging water, wastewater and<br />
stormwater systems.<br />
Municipalities and associated community<br />
organizations in Perth-Huron promote the benefits of<br />
compost and best practices for usage. Compost also<br />
needs to be made easily accessible to all residents<br />
and groups that could benefit from using it.
Thank you for reading Quality of Life in Perth & Huron County <strong>2023</strong>. We<br />
hope these reports act as ongoing resources. If you work with a local<br />
organization, perhaps they will help you apply for funding or create<br />
appropriate programs and policies. If you are an advocate, perhaps they<br />
will inform your priorities or message. More broadly, we hope these<br />
reports help all Perth-Huron residents understand their communities<br />
better. We also hope the recommendations within help individuals,<br />
organizations and elected officials make informed decisions to support<br />
everyone in our region.<br />
These reports do not provide a simple measure of Quality of Life in our<br />
area. They present findings we can celebrate and issues we can work<br />
on. With this knowledge in hand, it’s up to us to decide: What do we<br />
love about our community? What do we wish we could change? What<br />
kind of community do we want to become?<br />
With this knowledge in hand, let’s create the Perth & Huron Counties of<br />
the future together.
WRITING<br />
Areeba Ahmad<br />
Kristin Crane<br />
Will Wellington<br />
EDITING<br />
Chad Alberico<br />
DESIGN<br />
Sonya Heyen<br />
Copyright © The Social Research & Planning<br />
Council <strong>2023</strong>. This work is copyrighted. It<br />
may be reproduced in whole or in part for<br />
educational use subject to the inclusion of an<br />
acknowledgement of the source.<br />
Icons made by SlidesToGo